I like to visit the local supermarkets. And not only for the usual reasons. It helps confirm my faith in the power of market forces. Fully evident in the impressively wide range of goods and services on offer.
The SA retailers very adequately fulfil the all-important task that we have delegated to them. That is to deliver a wide range of goods, including food and medicine essential to life and happiness. The retailers are left mostly alone to manage a highly complex supply chain that involves, farms, ports, roads, trucks and ships, factories and warehouses, banks, landlords and regulators. And they manage the always complicated relations with workers and their supervisors to pack the shelves and fill the checkout counters and increasingly to deliver directly to homes.
They are serving us well for highly robust reasons. That is to make a living. Mostly modest but some very impressive. Generating incomes for the owners and staff that will bear a close relationship to the difference between the costs of providing the essential service and the revenues generated. To generate profits they will have to prevent the corruption of the supply chain.
Such profits will also depend on how well the retailer manages the promotion or demotion of managers and workers- including the succession plans for senior executives. The retailer as must any business manage successfully the relationship between the efforts of and rewards for the work force. Providing the right incentives to work harder or smarter remains highly relevant for containing costs, enhancing revenues, and the margins between them. Without which the firm would not survive the competition for the household budget.
The apparent “chasm” between the pay of the CEO and the average worker should be regarded as an important part of the market in action. To be admired rather than resented as representing the natural outcome of the supply and demand for very different capabilities and talents at work. As explaining the wide difference between what Taylor Swift and her hair stylist takes home after a show, given their very different contribution to the bottom line. Such inequalities of rewards are part of the necessary incentives for the best and brightest to ascend the highly competitive and greasy corporate poles to make a better fist of it. We can’t all hope to be as good as a Taylor Swift, or an exceptional CEO. Yet whose contribution to the bottom line will never be as obvious as that of a Prima Donna.
Moreover, the resulting flow of profits realised will largely be retained by the owners and invested in the firm to improve the offers to households. Profits are good for customers. But the profits they realise are not fully under the control of the retailer. They depend heavily on the purchasing power of their customers, their incomes, that in turn depend on how well the economy at large is being managed. The SA economy has acted as a serious headwind for the retailers and even more so for their local suppliers. A headwind revealed in the form of declining returns on capital employed, and in goods that move more slowly off the shelves for want of demand. And call for more working capital to back up delays in the ports and distribution centres and by load shedding. The result of which are poorer returns on all the extra capital employed and less invested in new plant and equipment and in the work force.
The failures of the SA economy have much to do with the unwillingness of the economic power brokers to follow the example of the retail sector. As in the persistent but unrealistic, given past performance, faith in a reformed SOE’s and government departments to raise their games. Rather than contracting out much more of production to the private sector- honestly selected and helpfully incentivised to deliver as are our retailers.
They refuse to do so for their selfish reasons, as well as misguided notions of how an economy works best. Yet they must know that the slow growth outcome is a consistent threat to their influence. “As hulle net geweet het wat ek geweet het…” (if only they knew what I know) learnt shopping with eyes and minds open to the evidence, SA would be, could still be, in a much happier state for retailers and their customers.
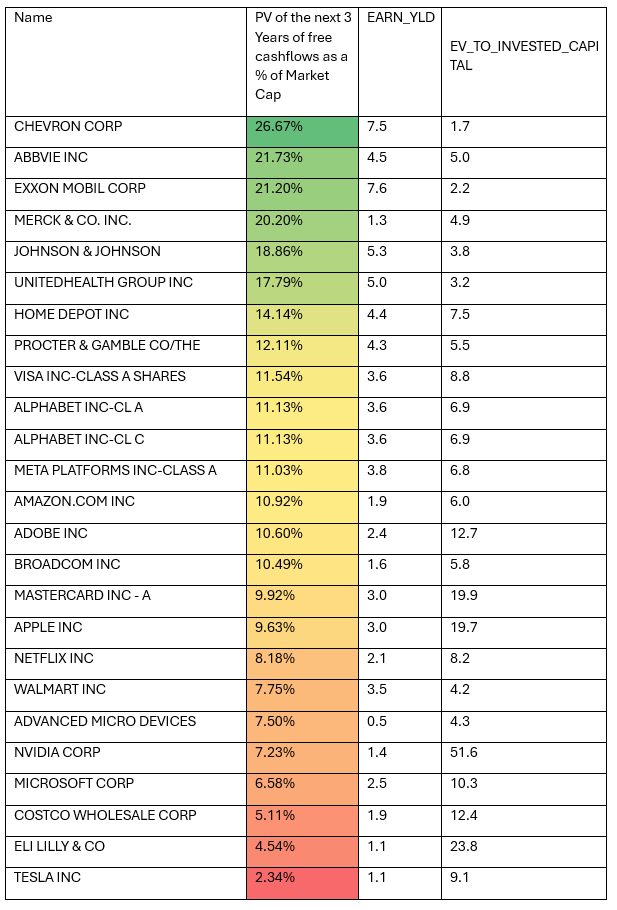
Much of the value of any company can be attributed to profits expected over the long run. If we discount the next three years of Microsoft’s (MSF) free cash flow- cash flow after capex- (FCF) as estimated by Bloomberg- discounted at 8% p.a. – we can explain only 6.6% of its current value. Nvidia has 7.2% of its present value explained this way. The 97% dependence of Tesla on growth beyond the next three years is greater still. By contrast 27% of oil producer Chevron and 22% of Exxon Mobile can be explained by the immediate short-term outlook. They are clearly value stocks.
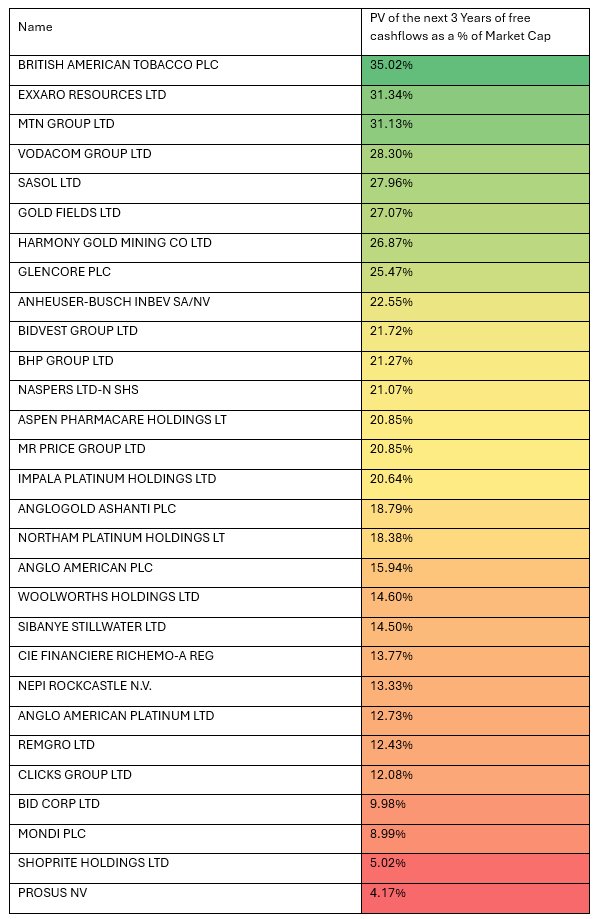
Most of the Top 40 stocks listed on the JSE, fall into the value category. A relatively high 32% of MTN and 28% of Vodacom, depend on the next three years of FCF – discounted at a much higher 14% p.a. While about 21 per cent of Mr Price and Bidvest can be explained this way. Anglo at 16.13% is therefore expected to deliver on its restructuring plans.
Table; Share of Market Value (July 2024) explained by Present Value of next 3 years of Free Cash Flow (FCF)
US Companies – FCF discounted at 8%
JSE Listed Companies. Discounted at 14%
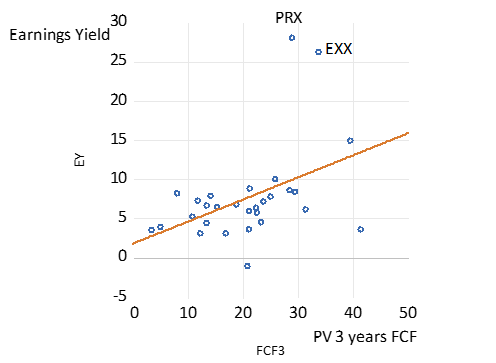
A scatter plot for the JSE Table. Earnings Yield and PV of FCF. Sample 29 companies in Table.
But as may be seen there are notable exceptions on the JSE that are priced for growth. The value of Clicks registers a mere 12% dependence on the next three years of performance while Shoprite with a 5% ratio, is even more of a growth stock by this measure. There is a strong link on the JSE between the PV of the FCF over the next three years and the initial earnings yield- the reciprocal of the P/E ratio as shown in the scatter plot.
Note, a 100 dollars or rands expected in 20 years’ time is worth 21.5 today at a discount rate of 8%. And worth only a third as much (7.28) if we raise the discount rate to 14%. The way to raise the value of SA economy facing companies is to lower the discount rate. As would follow faster economic growth. With a stronger economy the numerator of the SA Present Value calculation- operating profits – would rise and the denominator, the discount rate would fall, to provide a double whammy for present values.
Clearly the share market takes a long-term view. The observed day to day volatility of share prices is explained by the difficulty of forecasting profits or earnings or cash flows over the long run. And the longer the run, the more dependence of present value on future growth, the more that can go wrong or right for shareholders.
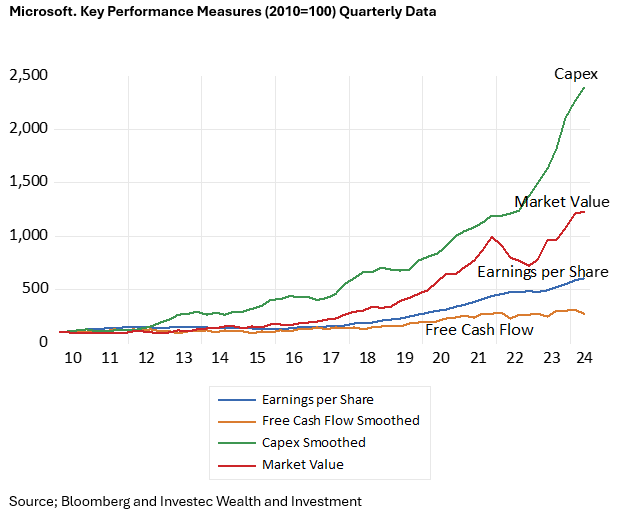
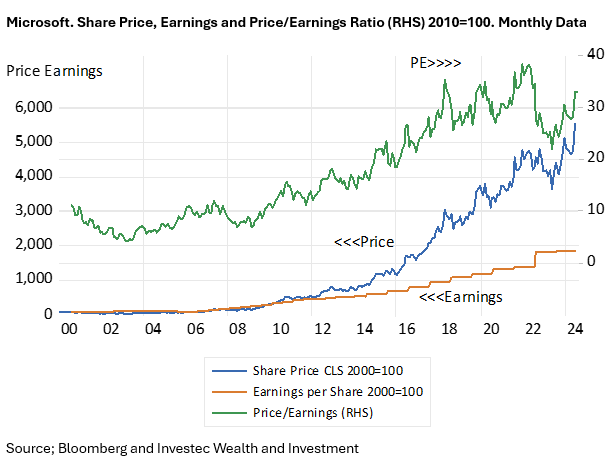
There is always the danger that investors will overestimate the growth potential of a growth company and the disappointment will reveal itself in much lower valuations. But even a very expensive growth company, by the usual metrics, can prove to be a great buy. Take the extraordinary case of MSF itself. It is a hugely successful company that transformed itself after 2010. And was rerated accordingly. In January 2010 MSF was worth $247 billion with a price to earnings ration of 11. By early 2019 the value of MSF had grown to over $800 billion and was then valued expensively and demandingly of growth at 26 times current earnings. The company is now worth over $3.3 trillion, an increase of 142% or by an average 25% p.a. since 2019.
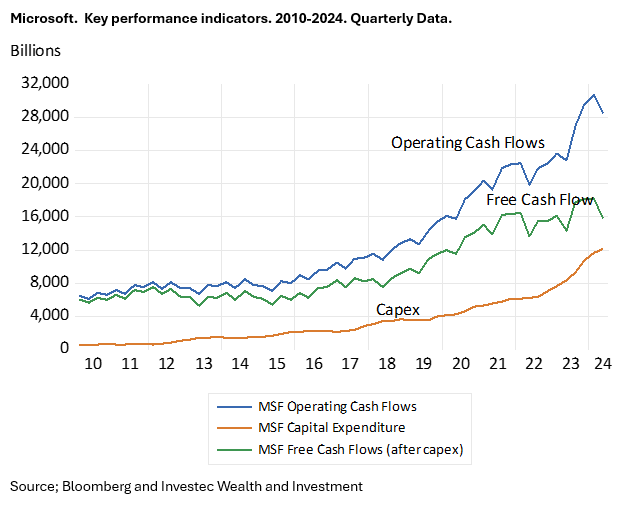
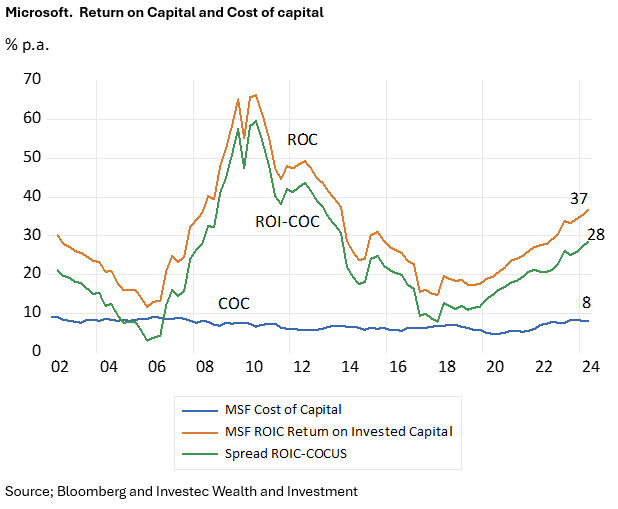
And MSF is now trading at about 38 times earnings after it reported yesterday 30th July. Is it still a buy? The answer will depend on just how well its extraordinary growth in Capex continues to transform into profits – by filling the cloud with data centres powered by microchips and by charging for generative IT. How well will this extra capex be monetised is the essential question? MSF Capex is now 25 times higher than it was in 2010. MSF Capex increased from $8943b to 13873b or 43%, this quarter compared to a year ago. While net cash from operations was up impressively by 29%. And accompanied by a large value adding margin between the return on Capital Invested by MSF – now 28% p.a. The largely unchanged MSF share price (down today by about 1%) indicates that MSF has satisfied very demanding expectations. The expectations of fast and profitable growth remain as they were. The same question is being asked of all the IT companies and not only the Magnificent Seven [1] that are adding aggressively to their plant and equipment.
[1] The original cast of the 1960 production of the Magnificent Seven included Yul Brynner Eli Wallach Steve McQueen Charles Bronson Robert Vaughn Horst Buchholz James Coburn
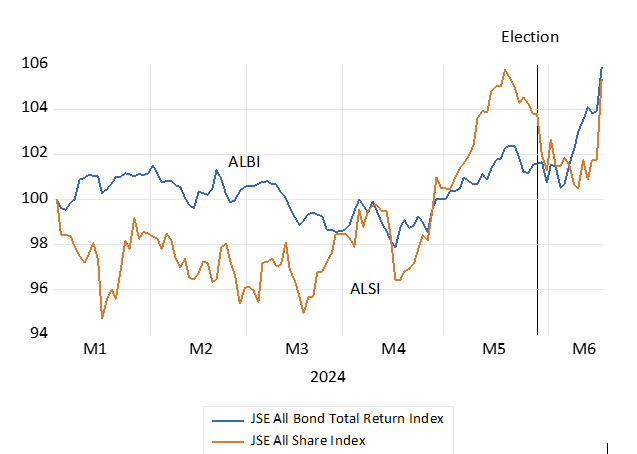
That the Government of National Unity would include the Liberal DA and exclude the EFF (extreme left or is it extreme right?) has been well received by investors. That this would be the new shape of government in SA was only known late on Friday 14th June after the markets were closed and that were only to reopen on Tuesday 17th June. The run up to the election had seen SA listed shares and bonds and the ZAR well up from their mid-April lows. On the presumption that the ANC would be able to do business as usual with the assistance, if necessary, of one or two minor parties. A sense of better the devil you know seemed to characterise market sentiment. That the ANC collected a surprisingly low 40% share of the votes cast, rather than 45-47 per cent expected, raised more uncertainty about the future course of economic policy. The markets in SA assets reacted typically to the new dangers by falling back from pre-election valuations.
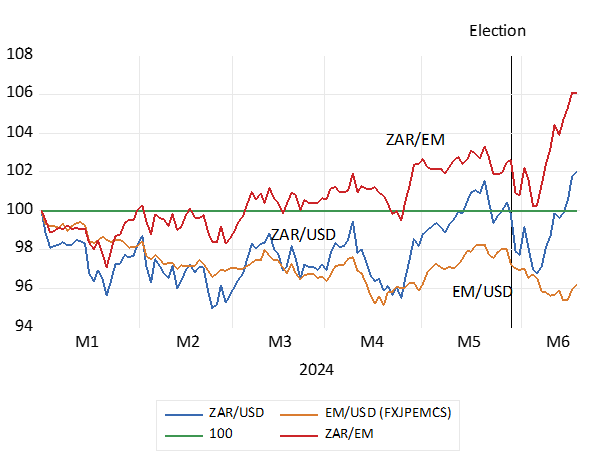
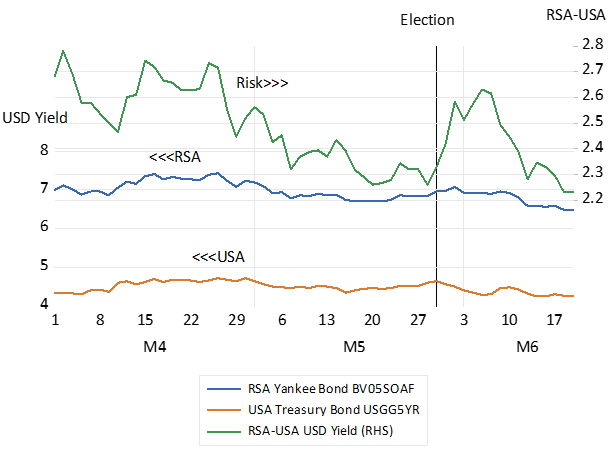
Early days surely yet the share and bond markets are now ahead of their immediate pre-election highs and have both gained about 7% in USD’s from the post-election aftermath. The ZAR has gained ground against the stronger USD and against the other EM currencies, the true measure of rand strength for South African, rather than US reasons. Of further encouragement is that the risks foreign investors attach to their SA assets have also narrowed. These sovereign or country risks are best measured by the spread between the yields on a RSA dollar denominated bond and those offered by a US Treasury Bond of the same duration. The spread between a five-year RSA Yankee bond had narrowed to 2.3% p.a. from 2.7% in the run up to the election. Then post-election the risk spread had widened to 2.6% p.a. and is now helpfully lower at about 2.2%. A good first impression but much more is called for the move the markets higher (see the charts below)
South African Stocks and Bonds in 2024. Daily Data to June 18th (January 2024=100)
Source; Bloomberg. Investec Wealth&Investment
The ZAR in 2024. Daily Data to June 18th January =100
Source; Bloomberg. Investec Wealth &Investment
Interest Rates – Dollar denominated Five Year RSA’s (Yankees) and US Treasury Bonds and the Risk Spread. Daily Data; April to June 18th 2024.
Source; Bloomberg. Investec Wealth &Investment
The DA will now carry a heavy responsibility for realising faster growth. Will the party and its leaders and followers be up to the task? Will they be able to manage change in an environment where the support of senior officials may not be fit for purpose? And when time spent in parliamentary debate and on the hustings may not have been the best possible preparation for expertly and vigorously executing the tasks at hand?
What specific government departments will be allocated to the DA members of the cabinet remains to be revealed. The DA should not be at all shy in coming forward to serve and be accorded a heavy responsibility for executing economic policy. There is apparently agreement on the initial economic policy reforms to be pursued, not surprisingly, given the weaknesses of government departments obvious to those who have sat for so long on the opposition benches and in parliamentary committees.
The Treasury and its Budget is in safe hands and can be supported by the DA in cabinet. It is the other economically vital Ministries that offer great scope for much improved governance and in executing policy and delivering value for the sacrifices taxpayers make to fund their government. The management role to be played by the Ministers to be held responsible for Mining, Industry, Energy, Transport Water and Municipal Services, in and out of Parliament, will be all important promoting economic development. That is the essential growth stuff to truly add value to SA capital from which all South Africans will benefit, those in and out of work.
Will the new appointments be up to the task? Businesses in South Africa can surely be a source of managerial talent. And a source of technical and financial advice to help fashion public-private partnerships to attract the necessary and available capital to revive the infrastructure. The best and brightest will be needed and will not be found wanting. A government that regards SA business as a partner in progress rather than a threat to its power and privileges will be a huge asset value and growth promoter.
How much better would the governing ANC have been received by the voters everywhere had they been supported by a rising tide of incomes and jobs, painfully absent since 2019? Including a scarcity of good jobs in the public sector (teachers, nurses, doctors) that have proved unaffordable, absent the growth in government revenues that comes painlessly with growth?
Yet even impressive and necessary fiscal austerity has not soothed the investors in SA government debt that have to cover our lack of tax revenue. They continue to demand high nominal and after inflation returns funding the RSA for fear that slow growth in the economy and in tax revenues makes printing money and more inflation much more likely sometime in the future.
And households have had to ante up the extra taxes needed to pay the extra interest on their national and on more costly personal debt. And to support a growing dependence on poverty relief provided to half of all SA households. Leaving less spending power available to households to encourage businesses to supply them with more of goods and services they much desire. And businesses, largely bereft of growing markets, have hired fewer workers and added to their growth enhancing plant and equipment, at a slower pace. High interest rates have meant high costs of funding businesses- that further discourage the essential work providers.
Welfare rather than work has been the SA poverty relief programme – and unintendedly but inevitably -discouraged the supply of labour. With regulated minimum wages adding further dis-incentives to the demand for and supply of labour. A potentially very valuable economic resource thus goes wasted and potential workers become highly frustrated. 11 million South Africans are formally employed outside of agriculture, out of an adult population of 40 million. Many middle income participants in formal employment with access to excellent privately supplied medical benefits, apparently were put off by the promise of equally good health care, provided publicly. Their trust in effective government delivery has understandably been lost and will not be easily regained. A fact of SA political life that any political party, that depends existentially on support from the centre, should recognise.
Slow growth has its own vicious spiral downwards and faster growth lifts all boats including those piloted by government agencies. And any governing party chastened by their electorate would surely look to the economy to improve their own re-election prospects next time, as well as the prospects of the citizenry. They would put both Party and SA in joint first place encouraging a stronger economy. The ANC government, recently, especially it’s Treasury, has not wanted for plans for reform. Private-public partnerships to invigorate the failing infrastructure feature prominently and are welcome. And its Budget deserves support from the economically literate. Being allowed to proceed on its announced path, with the hope they could do much better in executing its plans, would clearly be a relief to SA business and its funders. The largely stable stock, bond and currency markets suggest that it will be so allowed.
The essentially market friendly DA party and its fellow travellers, with about 120 of the 400 MP’s under its wing, would offer the much preferred partner for the ANC in government were growth and re-election prospects front of the ANC mind. The EFF and the MK do not offer or even promise faster growth -they have other growth destroying re-distribution objectives.
The very different approaches to racially biased interventions in the labour market, rather than merit based value for money contracts for labour, goods and services, is a serious difference between the ideologically interventionist ANC and the instinctively more market friendly DA. Yet the interference in the SA markets based on racial identity and preferments of one kind and another has been a primary contributor to persistently slow growth. Both by making business less efficient and confident and less valuable than they would otherwise have been. And indirectly when the economic agenda- what government does – is set by rent seeking opportunists – rather than determined by a national interest in value for tax money. Any political development in SA that leads to more meritocratic efficiency and less crony capitalism would be growth and vote gathering.
Chairman Trevor Manuel is “very proud” that Old Mutual has raised the minimum it pays employees to R15,000 a month, “so taking a decisive step towards narrowing the wage gap” One presumes that this minimum does not apply to the cleaners, security guards and canteen staff contracted to supply such services. Fortunately because, if so extended, it would mean many fewer of them would be employed in these humble categories.
I would be much more inclined to share the pride in firms paying more if it was accompanied by a growing pay roll. An outcome difficult to realise when improved rewards must be accompanied by improved performance– if the firm is to survive – productivity augmented by computers, robots and AI and on the job training. The true employment heroes are the firms that can grow salaries and the numbers employed, especially at entry level, enabling the young to begin a lifetime journey up the salary scales.
It appears that this new Old Mutual minimum is very close to industry wide practice, sensibly so. It is reported that the equivalent minimum at Standard Bank is a cost-to-company salary in 2023 was R231,050 (R19,254 a month). Santam, another insurer, has also announced a comparable minimum wage of R15000 per month, noting that its “….remuneration policy has ensured that we remain competitive against market salaries, so as a result of this policy we had a very low number of employees below the living wage. However, as part of our commitment to fair pay, we formally adopted the principle of paying a living wage at minimum.”
It makes good sense for a business to be competitive for all the skills it requires, including how it rewards its senior management and also the Board of Directors who appoint the CEO’s and approve their packages. The more competitive the packages on offer, the more selective the company can be in hiring the best and the brightest. And in firing. Paying market related wages and salaries and bonuses, is not an act charity, at least in the private sector. They must be earned and continuously justified. Though proving the point to those who have never had to meet a payroll, or survive a performance review, and who may not be especially well rewarded, despite their superior intelligence, may be very difficult. Think of convincing envious academics with tenure.
The notion that there will be some gap or ratio between the rewards of those at the top and the bottom of the ladder acceptable to public opinion, is an economic nonsense that needs to be resisted in the interest of any company with an eye to the bottom line. That is given the very different supply and demand forces, sometimes global (visas permitting) that apply to top managers and entry level employees alike.
South Africa’s problem is not the lack of benefits earned by those employed in the formal sector. It is the absorption rate in SA (employed/ population) a tragic 40.8% and lower for the youngest cohorts. Absorbing the entrants to the labour force is the huge challenge for economic policy. But it will surely not be solved paying those in good jobs ever more, after inflation, as has been the practice. And thinking how wonderful it all is to do so.
There are many potential workers who might accept the minimum wage –that is not offered to them or accept even less if allowed to do so. These regulated minimums however exceed the contribution they are thought likely to make to potential employers. Because many potential workers are just poorly equipped by training or education to do so. Yet others, classified as unemployed, might find the minimum wage below their reservation wage. That is below the wage that makes it sensible for them to go to work, that will not exactly be fun, and possibly expensive to get to. That is given benefits in kind, perhaps occasional work, perhaps only a bare subsistence, provided for by an extended family.
Such potential workers are not unemployed, they are just not working – for their own good And foreign workers, with a lower reservation wage, in unknown numbers, take up the employment opportunities.
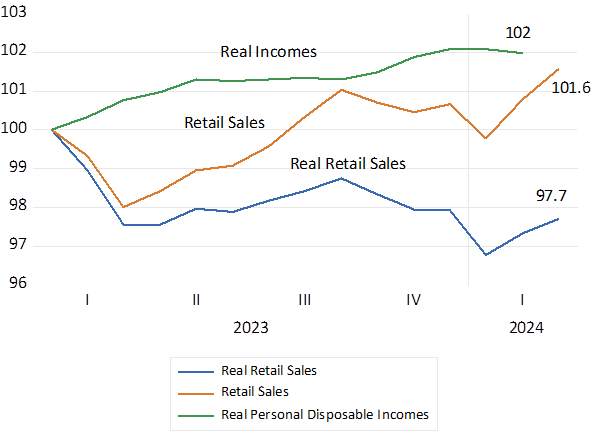
The resilience of the US economy in the face of higher interest rates has surprised many. Members of the Fed Open Market Committee, having pencilled several cuts to interest rates to come this year, have seemingly reversed course. Their pivot was precipitate. The still highly satisfactory state of the US economy must take the credit- or the blame -depending on whether you a borrower or lender be including in SA. US GDP, that is total output, has grown by 3% year on year and by a below expected 1.6% annualised in Q1 2024. Retail sales, an all-important measure of the state of demand in the US, had a lively February and March. Yet sales had declined steadily for many months before and retail sales deflated by the CPI are still two percent below that of January 2023. This revived willingness of US households to spend more has occurred despite minimal growth in real personal disposable incomes. In February incomes were only 2% higher than they were in early 2023, despite very full employment. Tell that to the White House.
US Retail Sales and Real Disposable Incomes (January 2023=100) Monthly Data to March 2024
Source; Federal Reserve Bank of St.Louis, Investec Wealth & Investment.
The good news about spending propensities with its implications for high interest rates for longer had a mixed reception in the financial markets. Given the new uncertainty about Fed action to come, stocks and bonds have fallen back this month.
This minor pull back has come after investors had enjoyed a full recovery from the significant declines in the valuations of stocks and bonds in 2022 when interest rates rose dramatically to deal with the inflation that had taken central banks and the markets by surprise. Yet it has all worked out rather well in the financial and housing markets. History tells us that it takes a financial crisis, to cause a recession, and the global financial system avoided one this time round.
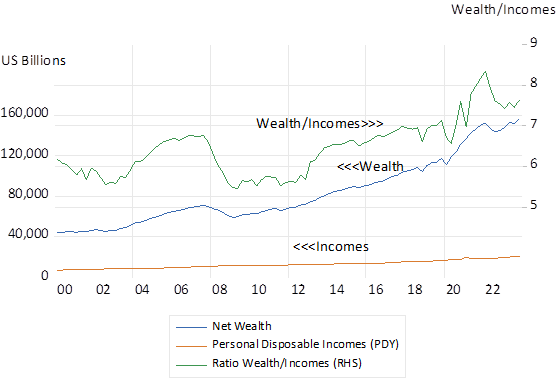
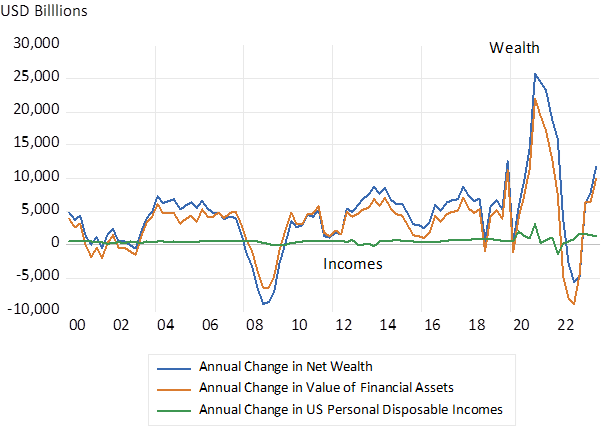
The place to look for an explanation of US economic resilience is the behaviour of the US financial markets themselves. US wealth, consisting mostly of financial assets, stocks bonds and equity in homes, net of household debt, has been increasing dramatically since the Global Financial Crisis of 2010. And received a huge injection from the Covid relief payments and the strength of the financial markets in 2023. US household wealth, net of debts, is now of the order of 156 trillion dollars. That is about seven times Personal Disposable Incomes. It was but 110 trillion dollars in early 2020, and now worth 156 trillion. Up by approximately 40 trillion dollars since the Covid lockdowns. Personal Incomes after taxation have grown by a mere 45 billion dollars since then. (see charts below)
Changes in wealth are as much a source of additional spending and borrowing power as any other source of income. In aggregate unrealised wealth gains dominate changes in other sources of income. Changes in wealth, even if capital gains can reverse, can significantly influence current spending. .Though predicting the wealth effect on aggregate spending requires predicting wealth itself. Which is even more difficult than predicting the disposable income effect on spending. Success in predicting financial markets would be modern alchemy. Yet essential if economic forecasting is to have any scientific validity.
s
US Wealth, Personal Disposable Incomes and Wealth to Income Ratio
Source; Federal Reserve Bank of St.Louis, Investec Wealth & Investment.
US Households. Annual Change in Net Wealth, Value of Financial Assets and Personal Disposable Incomes (USD Billions)
Source; Federal Reserve Bank of St.Louis, Investec Wealth & Investment.
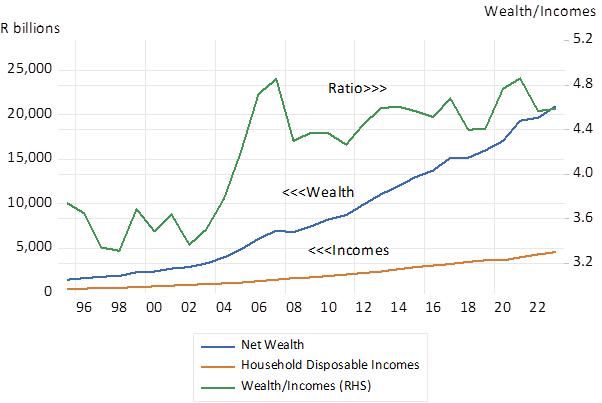
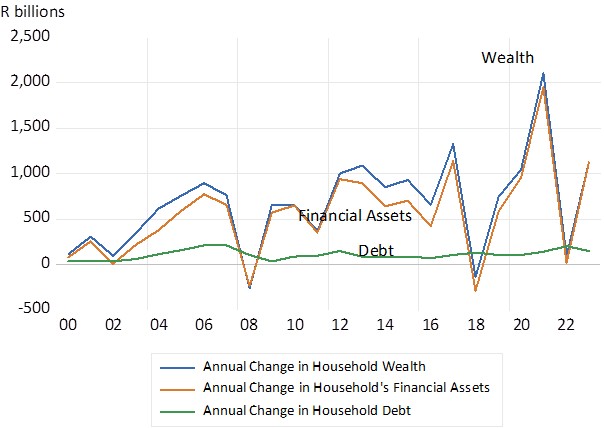
Household Wealth in South Africa is about 4.5 times larger than household incomes after taxation. This ratio increased markedly during the growth boom pf 2002-2008 and has largely stabilised since. (see charts below) The wealth of SA households is about to be challenged by a new dispensation. That is the right to easily draw down a third of their accumulated wealth held in pension funds and retirement annuities, the impending two pot system. The impact on spending, interest rates and on the financial and real estate markets in SA will be significant. The forecasters in and out of the Reserve Bank will be fully engaged in predicting the outcomes. Waiting to see what happens may be the only sensible option.
SA Households. Net Wealth and the Wealth to Disposable Income Ratio
Source; SA Reserve Bank Investec Wealth & Investment.
South African Households Annual Changes (R billion) in Net Wealth, Financial Assets and Debt.
Source; SA Reserve Bank Investec Wealth & Investment.
Private sector involvement in South Africa’s key capital expenditure (capex) projects could be the catalyst to set off a virtuous cycle of investment and growth.
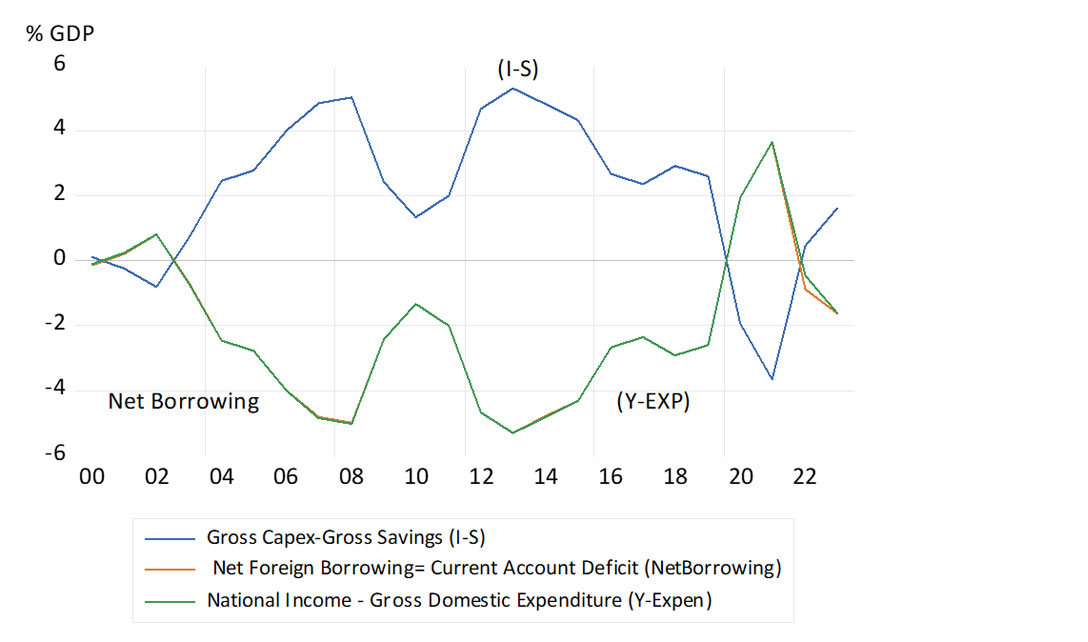
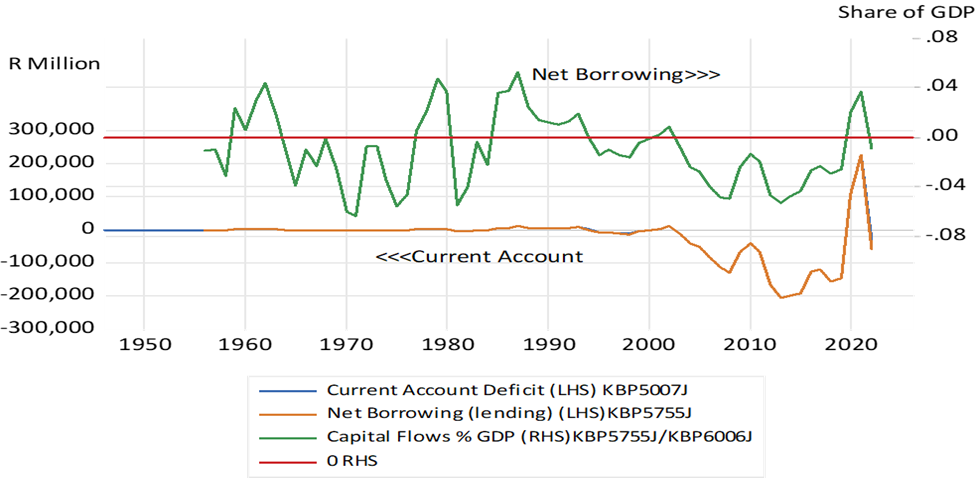
The Covid-19 lockdowns led to some unusual economic developments. Among them was that gross savings in South Africa came to exceed all declining expenditures on capital goods (new plant and equipment, new houses and apartments, etc). Thus, a “capital light” South Africa became an exporter of our scarce savings.
Last year normal service was resumed, capex increased by more than savings and South Africa became a net importer of foreign capital again. This “back to normal” state also meant that incomes fell short of all spending in 2023 and that the current account of the balance of payments went into deficit. All these deficits were equivalent to a modest 1.6% of GDP (see below).
SA national income and balance of payments – measured as a share of GDP
Source: SA Reserve Bank (national income and balance of payments accounts) and Investec Wealth & Investment, 09/04/2024
Is this good or bad news? Clearly, the more capital South Africa can attract from foreign savers – particularly if it were used to fund productivity and income-advancing plant and equipment, and R&D – the better the economy would perform in the short and long run. Or to put in another way, the higher the levels of gross spending, relative to current incomes, the larger the capital inflows and the larger the current account deficits.
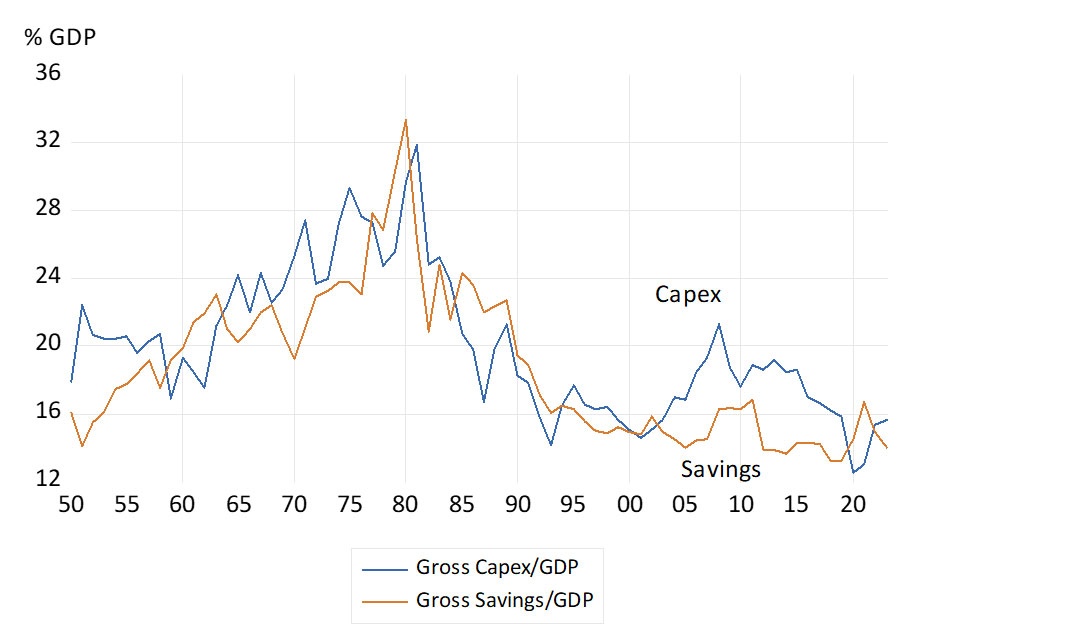
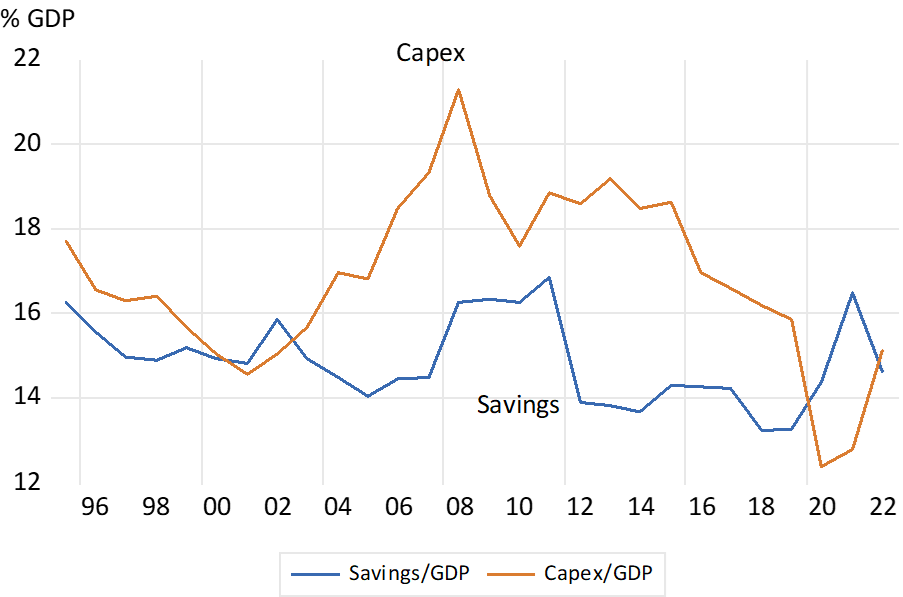
Yet both savings and capex have fallen to low proportions of total incomes. The savings and capex rates, now around 15% of GDP, have been in decline. Compare this with the strong growth years between 2002 and 2008, when capex again surged, the savings rate remained subdued, and foreign capital flowed in to realise faster growth (see below).
Gross capex and gross savings as a percentage of GDP
Source: SA Reserve Bank (national income and balance of payments accounts) and Investec Wealth & Investment, 09/04/2024
To achieve faster growth in incomes and expenditure, you need higher levels of capex. You also need South African households to spend more on the goods and services supplied by the local producers. Without support from interest-rate dependent household spending (now decidedly lacking), private businesses will not invest enough. Thus, any immediate increase in the savings rate (less spent) would neither be welcome nor realistic.
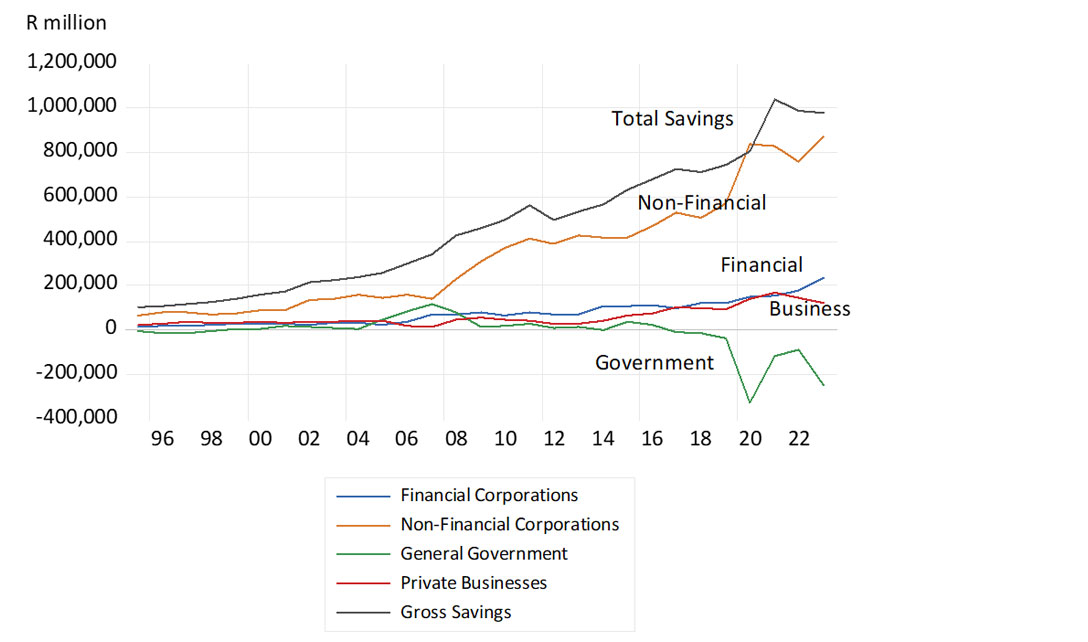
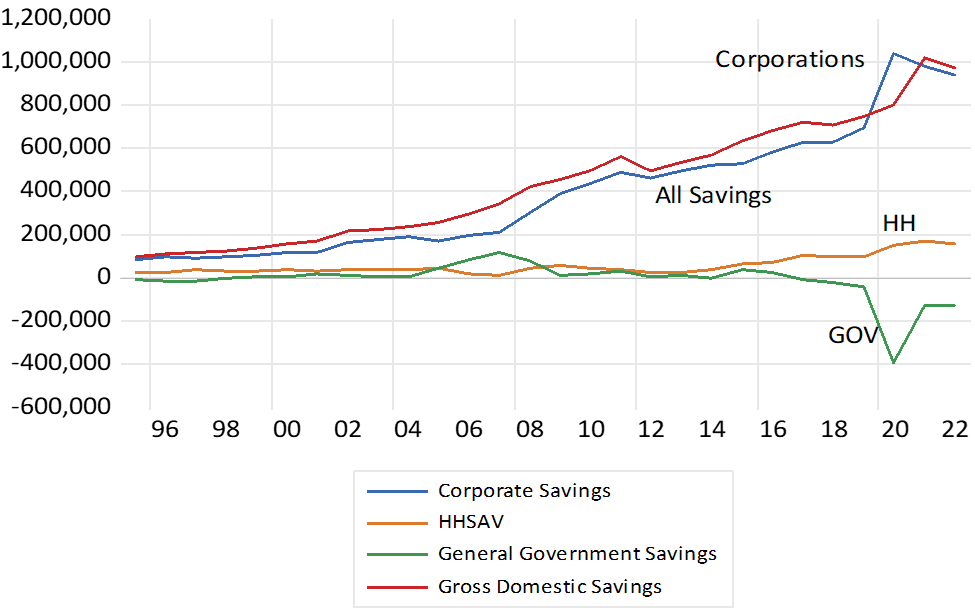
SA distribution of gross savings (R millions)
Source: SA Reserve Bank (production, distribution and accumulation accounts) and Investec Wealth & Investment, 09/04/2024
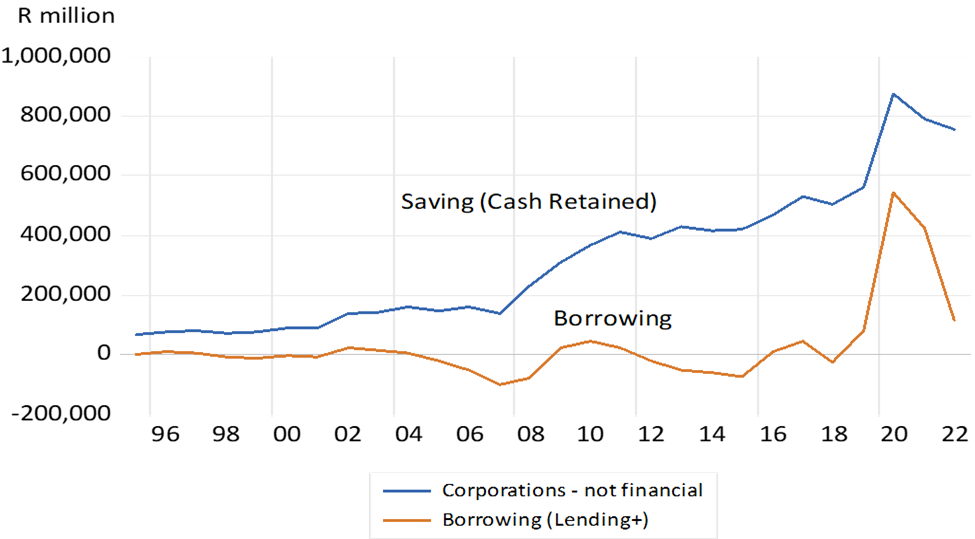
The extra debt raised by households to fund their homes, cars, furniture and appliances, largely cancels out their significant contributions to pension and retirement funds. This is why business savings (cash retained out of earnings) account for all of gross savings in South Africa. In the interest of faster growth for SA we would prefer businesses to spend more, to rely less on their own free cash flow, and augment their capex by raising debt or equity capital, including from abroad, as they did between 2002 and 2008. Negative free cash flow would be good for business and economic growth. As it was between 2002 and 2008 (see below)
But what would it take to set off for a virtuous cycle of more household spending and more profitable businesses, willing to raise their capex and labour forces, to then generate higher incomes for their workers?
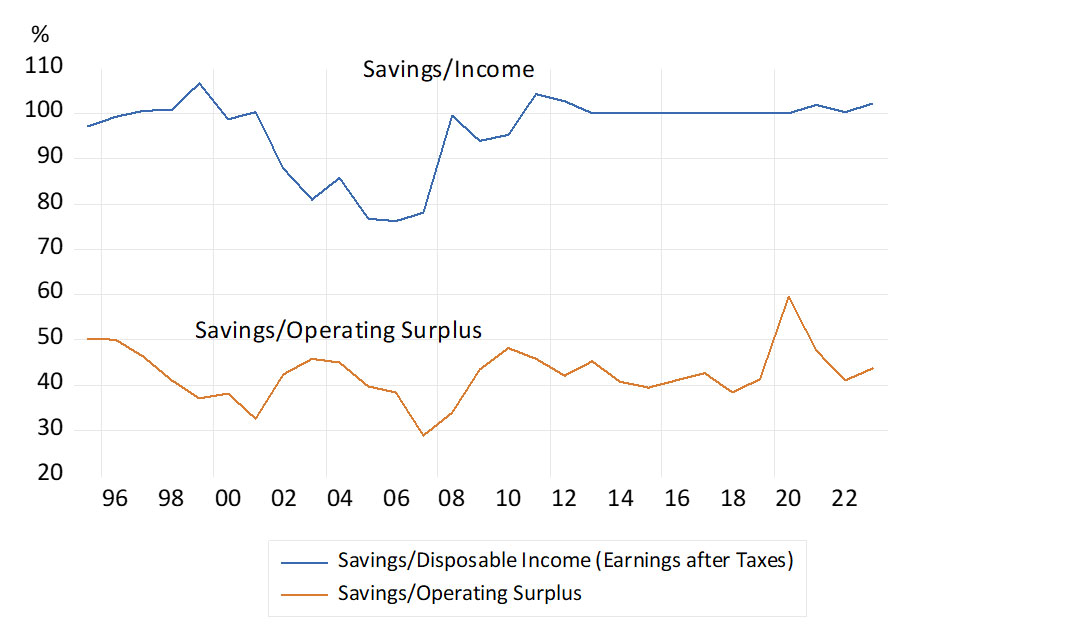
SA corporation savings (cash retained) over disposable incomes (earnings after taxes)
Source: SA Reserve Bank (production, distribution and accumulation accounts) and Investec Wealth & Investment, 09/04/2024
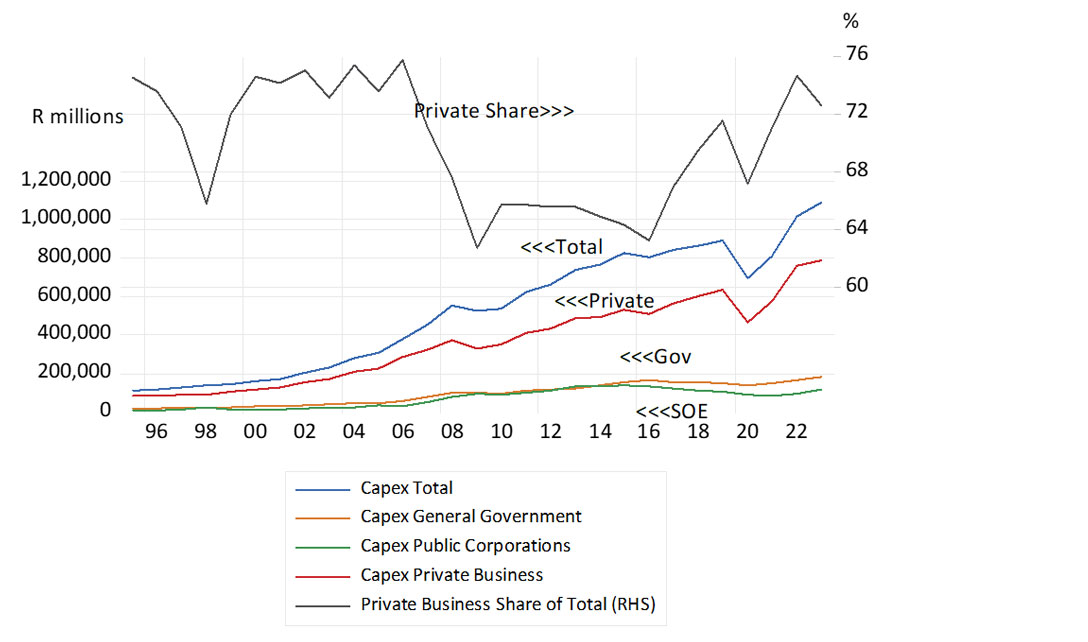
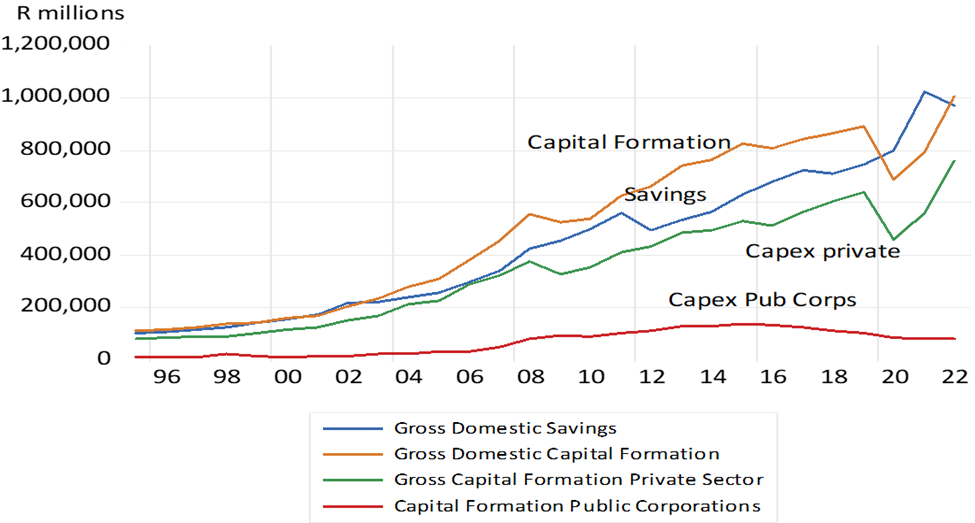
Much of the capex (over 70%) in South Africa is undertaken by private business enterprises. The share of the public corporations and the government in all capex has fallen away in recent years, (now 28%) after rising to well over 30% ten years ago. The Medupi and Kusile power plants and the Chinese locomotives were expensive projects that did not add to electricity generated or tonnes carried. It’s not enough to spend more on essential infrastructure, it must be capital well spent, to ensure the private sector can thrive.
SA gross capital expenditures (R millions) and share of private business in total capex (RHS)
Source: SA Reserve Bank and Investec Wealth & Investment, 09/04/2024
Eskom and Transnet have clearly failed the key economic survival test of earning a positive return on capital, as the government now recognises. The privately managed alternative is very much in prospect and the economic case for investing in South African infrastructure remains strong.
The private capital to fund such capex would be readily available from local and foreign sources. Private equity managers with access to institutional capital would be eager participants and the right terms to attract capital would not be onerous. These terms would have to guarantee inflation-linked utility charges, based on a realistic risk-adjusted return on the capital invested. Private business or private-public partnership so engaged would also need to be left largely free to sign their own procurement contracts. In this way, the virtuous circle would be set in motion.
They never promised us – nor did we realistically expect – a public sector in SA that performs as well as they seemingly do in say Scandinavia. What we have in SA is however widely recognised as an almost complete failure. The government offers little defence of its current practice – only long agendas for reform. Which raises the question – why does the SA public sector perform quite so badly?
One feature of the SA public sector deserves notice. The financial rewards it offers its officials – salaries, medical and pension benefits and secure tenure, are clearly very attractive when compared to the private sector. Such that there is very little movement from public to private employment. The regret of the government is that the limited flow of taxes has provided minimal scope for raising the numbers of teachers, nurses or humble pothole fillers. For those that have jobs are given more– in the form of regular above inflation increases in their salaries. While the hospital wards and classrooms become increasingly crowded and the roads impassable and the lights are off rather than on.
Given the superiority of public employment and given the abject failure of the economy and the labour market to absorb many more men and women of working age into formal employment, the issue of just how the favoured jobs in the public sector are allocated becomes especially important to understand. Recruiting strictly on the merits of potential recruits is clearly not the overriding modus operandi in SA. Observing racially prescribed quotas are one of the binding constraints. And a key performance indicator by which institutions and their leaders are measured.
ANC Cadre employment is another important objective of government employment policy. That notwithstanding the implications drawn by the Zondo Commission of Enquiry, is a practice that has not been disavowed by the President. And yet should cadre deployment not be the overriding mission and practice of the HR specialists in government, nor merit their North Star, the tempting gap between the supply and demand for highly prized employment opportunities with governments, of all kinds and agencies in SA, is very likely to be filled by unorthodox procedures in exchange for a finder’s fee or some equivalent. The opportunity to capture some of the ongoing rents will not have escaped those with bargaining power or influence. Historically in other regimes, shop-stewards, backed by Unions with the power to strike down essential services, have exercised such powers when allocating limited and well-paid jobs as on the Docks or the construction sites or among the waste removers. Nepotism may be another description for it. As they say nature, including homo economicus, abhors a vacuum.
If employment in the public sector is not explained by objective measures of ability to perform important functions – by qualifications carefully vetted and by psychometric measures of potential etc objectively administered. And when advancement is based upon years of service, and not key performance indicators (KPI’s) of the kind common in the private sector, how are the officials so appointed, likely to behave, all the way up the hierarchy? As may be presumed of all in the workplace, they will behave mostly in a self-interested way. You do get what you pay for.
Absent any link between merit, performance and reward, accepting the grave responsibility for carefully spending hard earned taxes, or of being a conscientious public servant for its own reward, is much less likely to be the outcome. Denying the capture of highly valuable contracts with government, opening the tender honestly, whistle blowing when procurement rules are flaunted, becomes essentially quixotic, even dangerous. Going the extra mile when nursing or teaching or policing all becomes much less likely. After all, where else is the citizen to go for a permit or essential documentation, or the poor to go for schooling or medical care or protection? They are easily treated as supplicants rather than valuable customers. Producers rather than consumer’s interest will prevail.
The case for meritorious public service is essential to the purpose of good government. Introducing much more of it in SA will however have to overcome powerful interests in the established favour and crony driven system. It will take the recognition, resentments and ultimately the votes of the victims of poor service to do so.
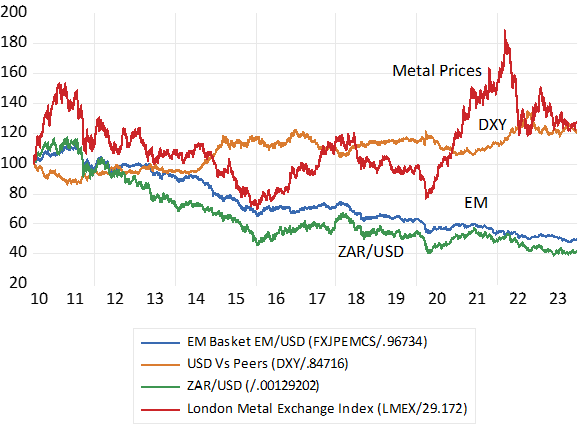
A great deal of commercial, domestic, and speculative energy is spent pondering the future of the rand (ZAR). The foreign exchange value of the rand will remain highly variable and unpredictable. The best prediction for tomorrow’s exchange rate is today’s rate but with a high level of variance that increases with time. As in the past, the rand is unlikely to be a one-way bet. It will experience periods of negative and positive turbulence. On average, persistent rand weakness is expected in the currency markets due to the higher inflation and sovereign risk of South Africa relative to the US dollar (USD) and other hard currencies. The rand cost of a US dollar is priced to rise at an average rate of 5.5% p.a. over the next five years and by about 4.5% this year. Yet, for all its volatility, changes in the foreign exchange value of the rand can be almost fully explained by but two persistent influences on its value. These are the exchange rates of other emerging market currencies with the dollar and the dollar prices of industrial metals that SA exports. 1
Since 2010, daily movements in the EM currency basket explain 54% of daily movements in the ZAR/USD exchange rate. This is a highly significant association. If you had a crystal ball that foretold future EM basket to USD rates, you could make confident and profitable bets on the trajectory of the rand’s exchange rate. Unfortunately, exchange rates are random walk processes that are impossible to precisely predict. And commodity prices also follow a random walk process. Your best guess for tomorrow’s ZAR/USD exchange rate is today’s rate plus or minus 1% (and ±2.2% if you’re looking a week ahead).
Knowing why the rand behaves as it has may however not help much to predict where it is heading. Forecasting the USD/ZAR demands an accurate forecast of the dollar value of other EM currencies and metal prices. A clearly formidable task. A strong dollar, as measured vs its developed economy peers, will clearly force EM and ZAR weakness and probably also weigh on metal prices, when expressed in USD – and vice versa. Though the major force acting on metal prices will be the state of the Chinese economy- the major destination for industrial metals – and so another known unknown with relevance for the ZAR.
The other forces acting on the rand are South African specific events. Political shocks and own goals that move the rand irregularly and unpredictably one way that then may be reversed. These shocks account for up to 46% of the movement in the rand relative to other emerging markets.
This is where wise economic policy and effective implementation of those policies can positively influence the exchange rate. The persistently weaker bias of the rand when compared to not only the US dollar, but also when compared to other emerging market currencies, is due to the failure of the South
African economy to deliver meaningful growth and attractive returns. The rand is riskier than the emerging market basket to a significant degree. A drop of 1% in the EM basket typically translates into a 1.5% drop in the rand. Government’s job is not only to shoot fewer own goals, but to convince through positive coordinated action that South Africa is not significantly riskier than other emerging markets. The potential gains are a less risky rand, a lower cost of capital, greater investment, job creation, and more wealth for the country to share.
Exchange Rates and Metal Prices (USD) Daily Data (July 2010=100)
The ZAR and the EM basket. Higher number indicate rand weakness.
We all know that market determined prices reconcile supply and demand. Higher prices discourage demand and encourage supply. What is true of an individual price is true of all prices on average, as represented by a Consumer Price Index(CPI) That prices generally tend to rise with increased demands or reduced supplies and vice versa seems obvious enough.
Higher prices discourage demand and encourage supply. That prices generally tend to rise with increased demands or reduced supplies and vice versa seems obvious enough. But the supply and demand for all goods and services are not determined independently of each other. The supply of all goods and services produced in an economy over a year is equivalent to all the incomes earned producing the goods and services that year. The value added by all producers (GDP) is equal to all the incomes earned supplying the inputs that produce output. Incomes are received as wages, rents, interest, dividends, taxes on production and what is left over, the profits or losses for the owners after all input costs have been incurred.
Produce more, earn more and you are very likely to spend more. The economic problem, not enough of everything, too little income, is surely not the result of any reluctance to spend on the necessities or luxuries of life. The problem is we do not produce enough, earn enough income to spend really more.
Extra demands can be funded with debt. Yet for every borrower spending more than their incomes, there must be a lender saving as much. Matching financial deficits with financial surpluses, is the essential task of financial markets and financial institutions, and may not happen automatically or seamlessly. There may be times when the demand for credit and the spending associated with it may run faster or slower than the supply of savings. If so incomes and output may increase temporarily above or below long-term trends. We call that the business cycle. Interest rates (yet another price) may be temporarily too low or too high to perfectly much the supply of and demand for savings. But such imbalances must sooner or later will run up against the supply side realities, the lack of income.
There is a further complication. The supply of goods and service is augmented by imports. And demand includes demand for exports. In South Africa both imports and exports are each equivalent to about 30% of the economy, making a large difference to supply and demand. But the prices of these imports and exports are not set in South Africa. They are set in US dollars and translated into rands at highly unpredictable and generally weaker exchange rates. The prices paid for imports and exports affect average prices. And they mostly push the averages higher. It has been the case in SA of a weaker exchange rate leading, equivalent to a supply side shock, and prices following.
And the rand is still expected to depreciate against the dollar by more than the difference between SA and US inflation. The bond market expects the rand to weaken against the USD by an average 7.3% p.a. over the next ten years, being the spread between RSA bond yields (12%) and the US yield(4.7%) While the difference in inflation expected in SA (7.2% p.a.) and in the US (3.2% p.a) over the next ten years is much less, only 4.8% p.a. according to the break-even gap between vanilla bond and inflation protected bond yields.
Lenders to the SA government remain suspicious of SA’s ability to grow fast enough to raise the taxes that could sustain fiscally responsible policies. That is the government will not avoid resorting to funding expenditure with money supplied by the central and private banks. A sure source of extra demands without extra supply that leads to ever higher prices as it does persistently in most African countries.
There is little monetary policy and short-term interest rates can do to strengthen the rand and bring inflation down further against this backdrop. That is without resulting in too little demanded and even less supplied than would be feasible. That in turn bringing still slower growth more fiscal strain, higher borrowing costs and a still weaker rand- and higher prices. The call is not to inhibit already depressed demand but for economic policy reforms that would stimulate the growth in SA output and incomes enough to change the outlook for fiscal policy, the exchange rate and inflation.
The group of countries that will make up the enlarged BRICS, Argentina, Egypt, Ethiopia, Iran, Suadi Arabia and the UAE have little in common other than a deep suspicion of the motives of the US and its close allies. A state of mind also shared by left wing opinion everywhere including in the US itself. If the unlikely combination of kingdoms, autocracies and genuine democracies is to become more than a another talking shop with an anti-West bias, then it should take an important lesson from the economic development of the US and Europe.
What has been of great benefit to the US and to Europe, since it established a common European market and Euro are their highly significant common currency areas. The same money is used everywhere in the US and Europe as a medium of exchange and a unit of account. Thus unpredictable rates of exchange when buying or selling goods and services across frontiers are avoided, as are the direct costs of converting one currency into another- usually converting US dollars -into the domestic money.
Trade and financial flows between the states of the US and now of Europe is greatly encouraged by what is a fixed exchange rate regime within a common market, also free of protective of domestic industry tariffs or discrimination against foreign suppliers, by regulation. As it does incidentally when transactions of one kind or another take place within any country. The important trade between Gauteng and the Western Cape for example is facilitated by prices set in the rand common to both.
In the nineteenth century when which international trade and finance first flourished and economies came to benefit from wider markets for their goods and labour, and the ability to realise productivity and income enhancing economies of scale, currencies were mostly linked by fixed rates of exchange. The link was the ability to convert the different monies, if necessary, into gold at a fixed rate. And the issuers of different monies made sure to maintain convertibility by protecting their balance of payments through adjusting domestic interest rates. If gold generally flowed out interest rates could be raised to conserve and attract gold reserves and vice versa. Provided the commitment to currency convertibility was fully credible, the extra interest received would balance the payments by attracting or retaining capital.
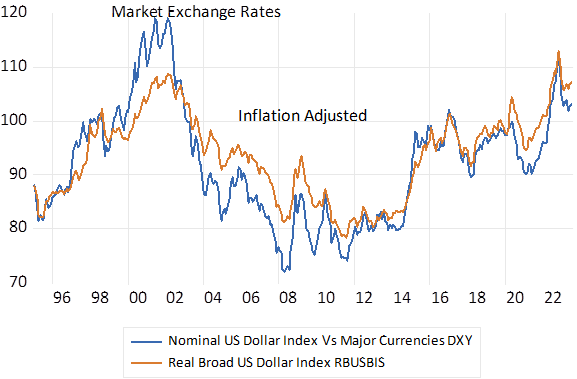
A modified fixed exchange rate system was re-established after the second world war with the US dollar as the reserve currency- but dollars that could be converted into gold at the request of other central banks. This commitment was abandoned unilaterally by the US in 1971 and market determined exchange rates, with the still dominant US dollar, became the norm. Highly variable rather than predictably fixed exchange rates have become the unsatisfactory order of the day. The rates of exchange of other currencies with the dollar, both in money of the day terms and when adjusted for differences in inflation of different currencies have varied very significantly – and unpredictably- damaging volumes of international trade and real investments.
US Dollar Exchange Rate Index. Market Determined and Inflation Adjusted
Source; Bloomberg, Federal Reserve Bank of St.Louis and Investec Wealth and Investment
It has not been a case of exchange rate moves levelling the playing field for traders in goods and services- so maintaining purchasing power parity in the face of differences in inflation rates across trading partners. Rather the exchange rates have adjusted to equilibrate independent flows of capital – large and reversible flows – in search of better risk adjusted rates of return- to which inflation then responds. Weaker exchange rates lead to more inflation and vice versa. Without stable exchange rates, controlling inflation in the face of capital withdrawals and a suddenly weaker exchange rate with the US dollar can become a severe interest rate burden on the domestic economy – as South Africa demonstrates.
The enlarged BRICS could establish fixed exchange rates between each other to promote trade and investment. They might usefully adopt a Chinese standard- that is offer convertibility of their own currencies into Renminbi at fixed rates. And rely on the Bank of China to manage the float of the crucial rate of exchange of Renminbi into US dollars, as it now does.
Peter Bruce has pointed to something in the Stellenbosch water of the late sixties and seventies that produced so many rand billionaires. They would not have been inspired by some professor of economics enthusiastic about the power of free markets telling them to do good for the nation by getting rich. They are much more likely to have been told the opposite. Told why markets will not work nearly well enough and that any faith in entrepreneurial flair would be entirely misplaced. I have yet to meet a Stellenbosch economist who believes that an economy is best left guided by the forces of competition.
And one can perhaps understand why. The interventionist economic policies, long adopted in SA before 1994, clearly helped to completely transform the economic and educational status of the Afrikaner nation, in a generation, both absolutely and comparatively. They might have done even better with freer markets, but this would not have been self-evident. By every measure, the Afrikaner, on average lagged well behind the standards enjoyed by the average English speaker in the nineteen thirties. By the sixties they had caught up. Even, as the average incomes of both communities had improved significantly.
Many of the best and brightest Maties sought their futures working for the state and its agencies. The case for ownership by the state of some of the commanding heights of the economy, steel, electricity, railways and ports was taken as a given and not contended. And they were not, with few exceptions, seen as the path to private riches through corrupted procurement and biased tenders to which SOE’s are so conspicuously vulnerable. Nationalism and strong sense of community may have had something to do with this restraint.
Perhaps with Johan Rupert a fellow student, the example of the ineffable Anton Rupert was the inspiration. He who went door to door selling shares in his fledgling enterprise that was to take down a powerful near monopoly of the cigarette market in SA. The billions of the Stellenbosch cohort, like those of the Ruperts, were made in a conventional way. By competing successfully with established businesses for their customers and executing better combined with intelligent financial engineering that is always the leveraged and risky path to great wealth. Taking the opportunity provided by contestable markets is characteristic of successful, dynamic economies.
Peter Bruce is quite wrong to assert (Business Day July 27th) That Stellies route to billions is gone — and it’s undesirable. Apartheid-era billionaires can’t be reproduced in today’s democratic conditions.
It would be highly desirable were the South African economy to produce a few more billionaires in a similar old-fashioned way. By taking on established interests, winning market share and reviving businesses that have lost their way and are now valued at far below what can be regarded as their replacement cost. With the help of value adding, better designed financial structures and appropriate incentives for managers based on what really matters, return on all capital employed. It seems to me the opportunity to acquire great wealth in rands and dollars is as open, perhaps more open than it has ever been given current market pessimism.
The aspirant billionaire will not have to rob the taxpayer to get rich – though it is still unfortunately the most obvious route. Yet more than a few new billionaires are hard at work proving my point that Bruce may not have noticed from his rural retreat.
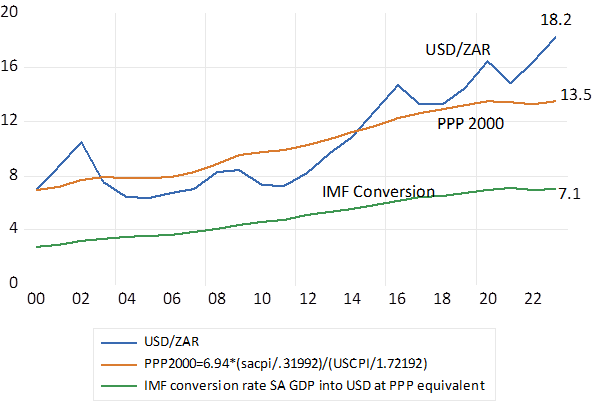
Though admittedly a billion rand today is a lower target, worth a lot less than a billion in 2000 – about 35% as much, after SA inflation. To compare purchasing power in US dollars, you might do as the IMF does – divide billions of rands by 7 not 19 to convert SA GDP into purchasing power dollar equivalents. If the rand just compensated for differences in SA and US inflation since 2000, a dollar would cost R13.5 and a billion rand would buy the equivalent of USD74m – more than nickels and dimes.
The exchange value of the Rand (USD/ZAR) and its purchasing power equivalent
There is a certain balance of payments (BOP) outcome. That the dollar payments and dollar receipts in the currency market will strictly balance over any period- an hour, day quarter or year. The exchange rate and interest rates will continuously adjust to make it so- to equalize supply and demand for dollars and other currencies traded. And it is a very good idea for the authorities not to intervene in or attempt to influence this market determined exchange rate with interest rate adjustments. Or to directly control demands for or supplies of foreign currencies to achieve a temporarily better, perhaps less inflationary rate of exchange. A shadow market will emerge to siphon off undervalued dollars, leading to an official scarcity of dollars. Making it very difficult to do normal helpful income enhancing business across the frontiers and discouraging to foreign investment so important to any economy. As MTN knows only to well from its experience in Nigeria.
Another BOP relationship will also always hold. The current account of the BOP- that measures payments and receipts for imports, exports and the flows of dividends and interest paid or received by South Africans, will always be matched equally and oppositely by what are measured as flows of capital over the exchanges. A current account deficit will always be matched by a capital account surplus of the same amount and vice versa. There is no cause-and-effect relationship implied by this identity. The current account does not determine the capital flows – any more than the capital flows determine net flows of foreign trade, interest, and dividend payments. It is an accounting identity.
The capital and current accounts- an identity, identified.
Source; SA Reserve Bank and Investec Wealth and Investment
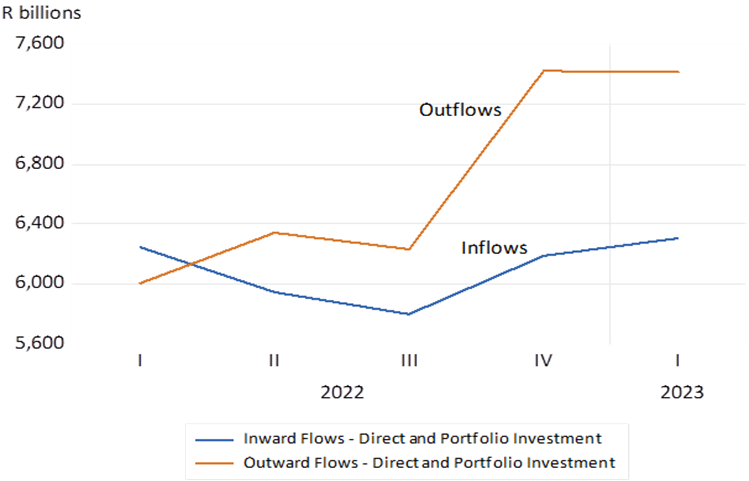
Over most years the current account of the SA balance of payments has been in deficit. Exports of goods and services almost always exceed imports – generating a consistently positive balance of trade (BOT) While the deficit on what might be described as the asset service account, dividends and interest payments, almost always exceeds dividend and interest received by enough to exceed the positive BOT. The interest and dividend yields on SA liabilities much exceeds the dividend and interest yield on SA assets held abroad. But between 2020 and 2022 South Africa ran current account surpluses and exported capital on a significant scale. So much so that the market value of SA assets held offshore now exceeds that of the market value of foreign owned assets in SA. This was not good for the South African economy.
There is a National Income Accounting Identity to help make the point. The current account deficit also equates to the difference between Aggregate Incomes that are equal to Aggregate Output (GDP) and Total Expenditure on final goods and services (GDE) It is also by definition the difference between Gross Savings and Gross Capex. Post Covid, Gross Savings, almost all in the form of cash retained by the corporate sector, held up better than Capex and capital – from a capital starved economy – flowed out.
South Africa, Gross Savings and Capital Formation – Ratio to GDP – Annual Data, Current Prices
Source; SA Reserve Bank and Investec Wealth and Investment
South African Non-Financial Corporations; Cash from Operations Retained and Net Lending (+) or Borrowing (-) Annual Data
Source; SA Reserve Bank and Investec Wealth and Investment
South Africa; Gross Savings and the Composition of Capital Expenditure by Private and Publicly Owned Corporations
Source; SA Reserve Bank and Investec Wealth and Investment
South Africa; Inflows and Outflows of Capital; Direct and Portfolio Investment. Quarterly 2022-2023
Source; SA Reserve Bank and Investec Wealth and Investment
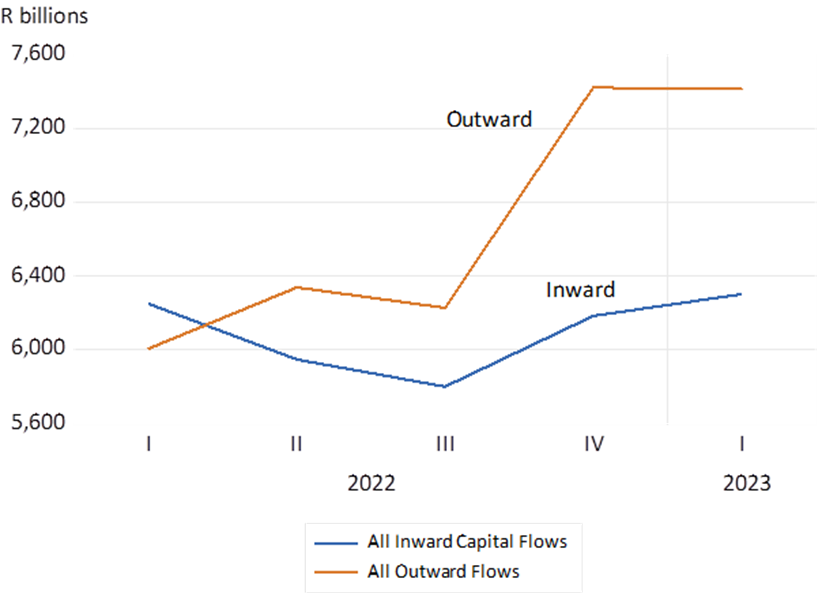
All Capital Flows to and from South Africa; Quarterly Data (2022.1 2023.1)
Source; SA Reserve Bank and Investec Wealth and Investment
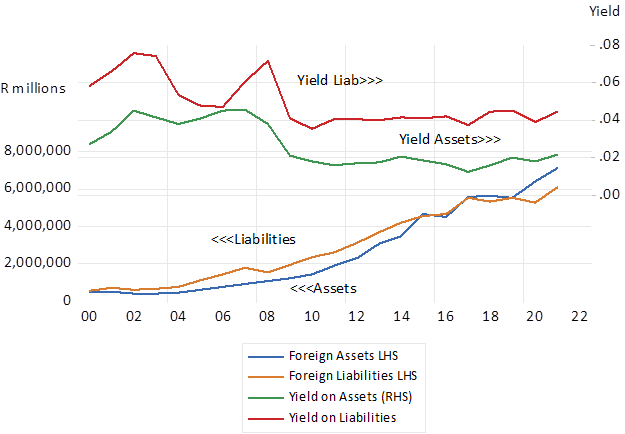
SA; Total Foreign Assets and Liabilities; Direct and Portfolio Investments and Yield
Source; SA Reserve Bank and Investec Wealth and Investment
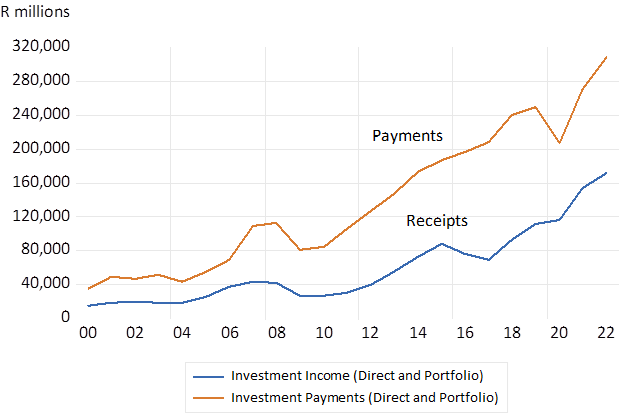
SA Foreign Investment Income (Dividends + Interest) Annual Data
Source; SA Reserve Bank and Investec Wealth and Investment
South Africa; Gross Savings Annual Data (R millions)
Source; SA Reserve Bank and Investec Wealth and Investment
Both the ratio of Gross Savings – and Capex to GDP can be regarded as unsatisfactorily low in SA. The opportunity to raise the savings rate seems limited, given low average incomes. However, the opportunity to raise the rate of capex to GDP and to attract foreign capital to fund income growth encouraging capex and the accompanying larger current account deficits is always open. SA must be able to offer faster growth and the accompanying higher expected returns, to attract more foreign capital and to retain a greater share of domestic savings.
Supply side reforms are urgently needed for the SA economy. We all know what they are. Demand will keep up with supply automatically. Extra Supply – extra incomes earned producing more goods and services- creates its own demands. Yet until the economy can deliver more growth and better returns, the best we can do with our savings is to invest them abroad. (including buying shares of companies listed on the JSE that do almost all of their business outside the SA economy) Without such opportunities, the pension and retirement funds, upon which we depend for our future income, would be in a truly parlous state.
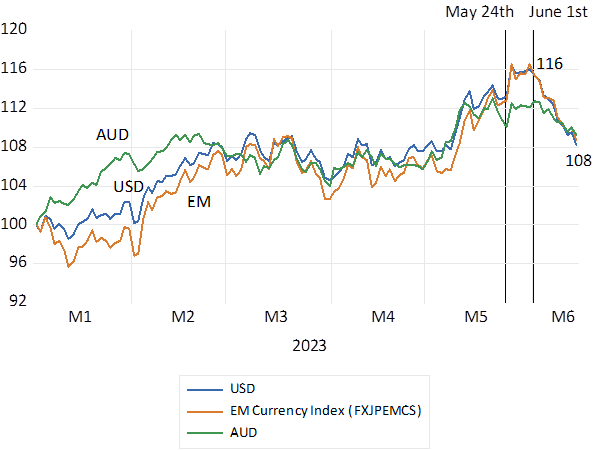
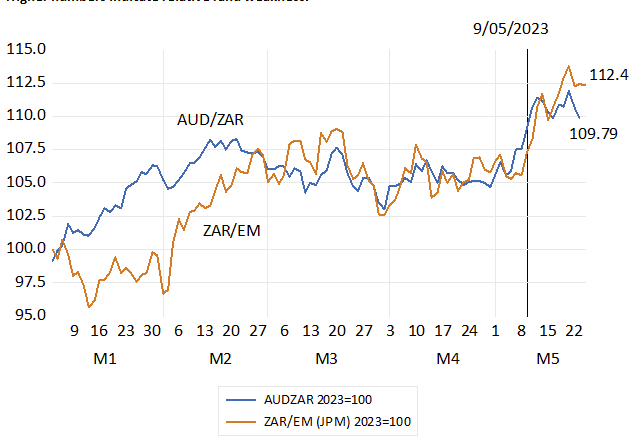
The rand has recovered strongly this month – by about 7% against the US dollar, and has performed similarly Vs the Aussie dollar and an index of EM currencies. The rand had weakened through much of 2023. It weakened by a further 3% when the SARB increased rates unexpectedly sharply by 50 b.p. on May 25th. Since June 1st the ZAR has recovered – as interest rates in SA have fallen away. arply.
The ZAR Vs The USD, the AUD and the EM Currency Index. (Daily Data January 2023=100)
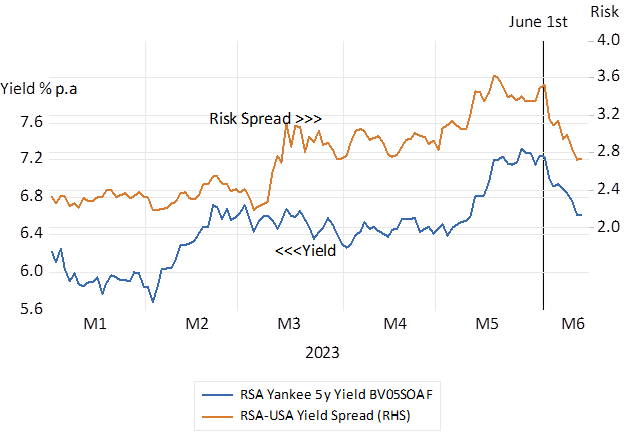
Source; Bloomberg and Investec Wealth and Investment Long term RSA bond yields have declined significantly and helpfully by between 50 and 70 basis points this month. The Yankee Bond, a five year dollar denominated claim on the RSA, now yields a lower 6.4% p.a. compared to the 7% p.a. offered on June 1st. Moreover, the spread between the RSA dollar bond and a US Treasury of the same duration has narrowed significantly from 3.6% p.a to 2.8% p.a. This interest rate spread provides a very good indicator of the risks of default attached to SA bonds. More important perhaps for the direction of the rand and the economy has been the recent inflection in short-term interest rates. When the SARB raised rates on the 25th May, the money market, as represented by the forward rate agreements of the banks, immediately predicted a further one per cent hike in short rates over the next six months. The SARB is now expected to be much less aggressive. The market is now expecting short rates to rise by a quarter per cent.
RSA Dollar Denominated (5 year Yankee Yield) and the SA Sovereign Risk Premium (Daily Data 2023)
Source; Bloomberg and Investec Wealth and Investment
Why have surprisingly lower short term interest rates helped the rand as surprisingly higher rates clearly weakened the rand last month? There is much more than coincidence at work here. Higher short-term rates – higher overdraft and mortgage rates- combined with the higher prices that follow a weaker rand – are expected to further depress spending in SA and the growth outlook for the economy. The weaker the outlook for the economy, the weaker the growth in incomes before and after taxes, the more government debt is likely to be issued. And the graver becomes the eventual danger a of a debt default. For which still higher interest rate rewards have to be offered to investors to compensate them for the additional risks implied by a deteriorating fiscal condition. These higher interest rates then raise the cost of capital for SA business – making them still less likely to undertake growth encouraging capex. The Reserve Bank is ill advised to react to exchange rate shocks in ways that further threaten the growth outlook – and can prove counterproductive by weakening the rand that then lead to still higher prices. Interest rate increases make sense when excess spending – excess demand – is putting pressure on prices. Which is not the case for the SA economy today. The right response to exchange rate shocks is to ignore them as their temporary impact on the price level falls away. Absent any additional consistent pressure on prices from the demand side of the economy, over which the SARB will always have strong influence. The notion of self-perpetuating inflationary expectations, as promoted by the Reserve Bank when explaining its interest rate reactions to a weaker rand, is supported neither by evidence nor is it consistent with self-interested economic behaviour. It is poor theory and even poorer practice. But this leaves open the question- why then have interest rates come down in SA? The answer can be found offshore. The Fed has found good reason not to push its own rates higher. The pause on rate increases in the US became widely expected and was confirmed yesterday gives the SARB even less reason to raise its own interest rates. The Fed by dealing effectively with a surge in inflation (which has not been self-perpetuating) has improved the outlook for interest rates, the SA economy and the rand.
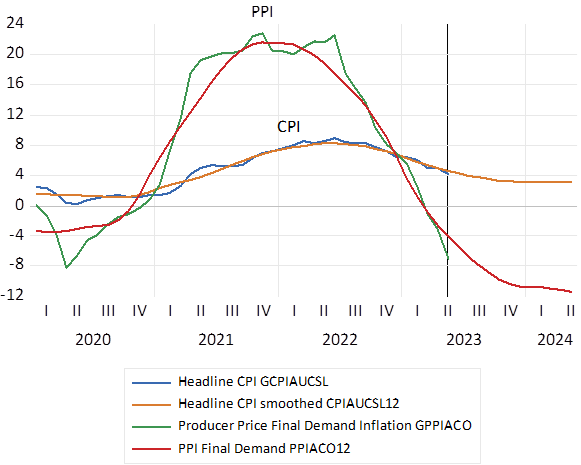
Update on US Inflation – to May 14th 2023.
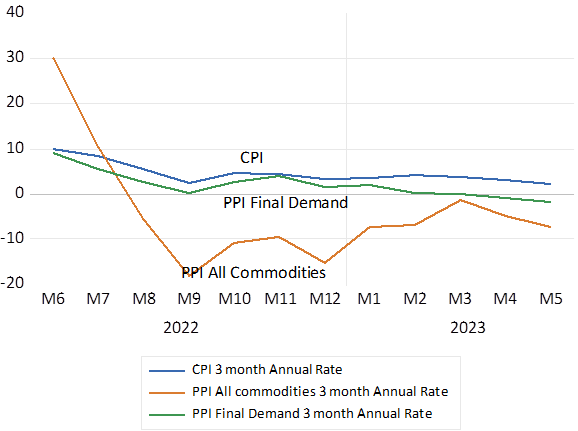
Both CPI (4.0%) and PPI headline inflation fell more than expected in May. Monthly moves were low – 0.2% for CPI and negative for PPI. The only proviso was the elevated rate 0.4% m-m for core CPI- CPI excluding energy and food. But core has a very large rental weight- over 40% which was up 8% y/y – but rentals are clearly heading lower and core may not be the most useful leading indicator for CPI – PPI- now strongly lower may do much better in predicting CPI. The Fed paused but member dot plots indicated further increases to come. But the Chairman says the Fed will remain data dependent and my view is that the Fed panic about inflation is over. Because demand pressures on inflation are largely absent- thanks to higher interest rates and negative growth in money supply and bank credit. The global pressure on interest rates in SA is therefore abating. As discussed in my commentary above
US Headline Inflation Y/Y growth in Index
US Inflation over the past three months – % per 3 months annualized. CPI now running at a quarterly rate of 2%. PPI inflation – headline and quarterly- is now negative
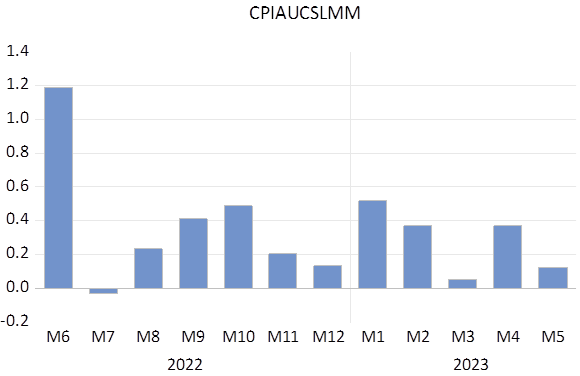
Monthly % move in CPI Seasonally Adjusted. Latest April-May 2023=0.12%.
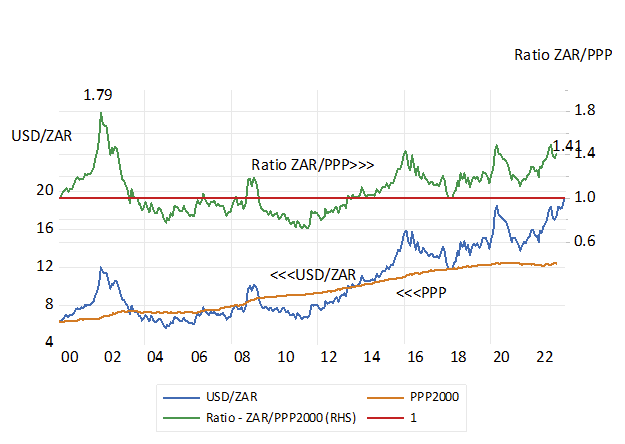
In early 1980 the Rand reached a peak of 1.32 US$ to the Rand; yes, the Rand then bought more than one dollar! This was the time of a very high gold price of $820 per oz. when Russia invaded Afghanistan and WW3 looked like a real possibility. It was but 35 dollars an ounce in 1970. Things have not been as rosy on the exchange rate front since. The exchange rate is currently around 19.2 Rand to the $. This means that in purely nominal terms the Rand is currently 1/25th (against the dollar) of what it was in those heady days of 1980! If the ZAR merely adjusted for differences in SA and US inflation since 2000 the dollar would now cost less than R13. In a relative sense- the ratio of the market to the Purchasing Power Parity was only wider in 2002 when the ZAR was nearly 80% undervalued. At current exchange rates it is about 50% undervalued. Or in other words the rand buys roughly 50% less in NYC than it does in SA as SA visitors will testify. The great deals will now be realised by tourists to SA –until the rand sticker prices in the stores and on the menus are marked higher. See figure 1
Figure1. The USD/ZAR and its PPP equivalent.1 Monthly data to April 2023.
Source; Federal Reserve Bank of St.Louis, Stats SA and Investec Wealth and Investment
In the seventies as the gold price took off- more in USD than ZAR, SA was the largest gold producer in the world and gold mining was hugely lucrative for shareholders in the gold mines and for the SA government who collected much extra revenue from taxes, and royalties paid by the gold mines. Platinum mining was only then getting going and subsequently got a huge boost from the widespread use of catalytic converters in the exhausts of motor vehicles. Coal exports got going after the construction of the huge export terminal at Richard’s Bay, and the rich Sishen iron ore deposit was still to be exploited.
South Africa is now merely the eighth largest producer of gold in the world, producing but a sixth of the gold delivered in 1970. And gold production is now a relatively small part of the South African economy that in the seventies accounted for 60% of all exports from SA and about 16% of GDP. The link between the gold price and the exchange rate
is now correspondingly weak and has done little to save us from facing the second weakest Rand on record and ever higher long-term interest rates.
The strength of the Rand is still much influenced by the state of the commodity-price cycle, as South Africa remains a commodity-based and exporting economy. It is also determined in large part by perceptions of South Africa’s economic future and the associated safety of investing in SA. Foreign and local investors require a return that compensates for the perceived risk of investing in SA- including the risk of rand weakness. These perceived risks influence flows of capital to and from SA and can strongly influence the foreign exchange value of the ZAR, as they have this year. As an emerging market, South African risk generally follows the average emerging market risk, but SA specific risk has recently risen dramatically in the face of income destroying load shedding and more recently for reputation destroying toenadering with the reviled Russians. This year the rand has weakened by about 13% vs the Aussie dollar and 11% Vs the EM basket. Much of the relative weakness occurred in January and February in response to load shedding. With additional exchange and bond market weakness (higher yield spreads) on the 10th May in response to the Russian revelations. (see figures 2,3 and 4)
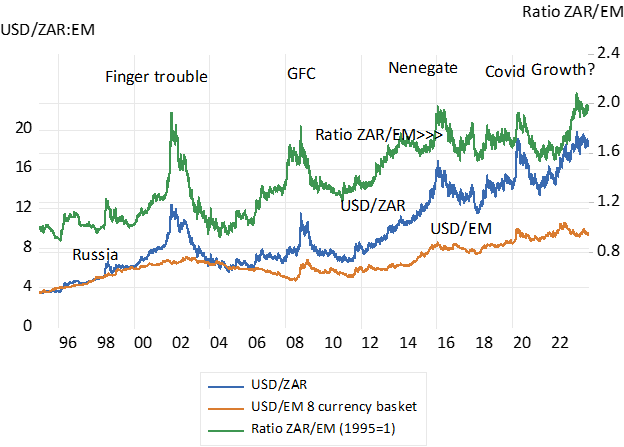
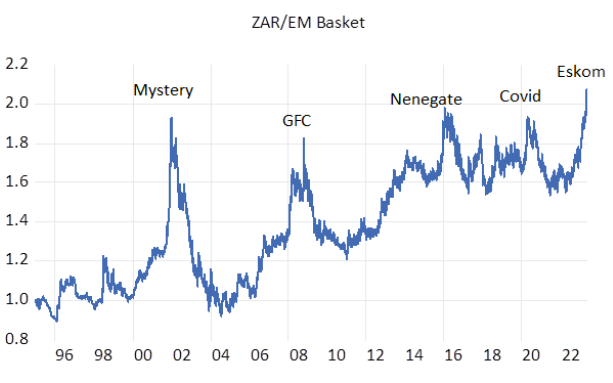
The ratio of the USD/ZAR exchange rate to the USD/Emerging Market (EM) average provides a useful indicator of SA risk. This ratio indicates that SA is again in economic crisis territory. The hope is that this time is not different- and the USD/EM ratio recovers to something like normal, as it has done after all the other crises that have damaged the ZAR and the SA economy. Relative to an average EM currency the ZAR has never been weaker than it is now. The outlook for the SA economy, judged by this ratio, has never been as bleak as it is now.
Fig.2: Identifying SA specific risks- comparing the behaviour of the USD/ZAR exchange rate to that of a basket of EM currencies. Daily Data 2000=1
Higher ratios indicate relative rand weakness
Source; Bloomberg and Investec Wealth and Investment.
Fig.3; Relative performance in 2023 ; ZAR VS AUD and EM Index; Daily 2023 to 15th May 2023. Higher numbers indicate relative rand weakness.
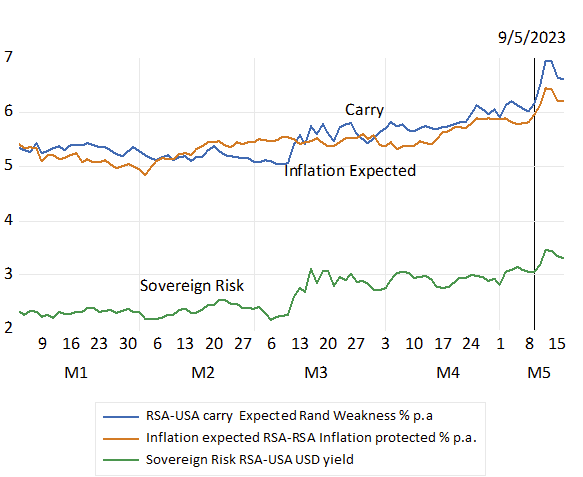
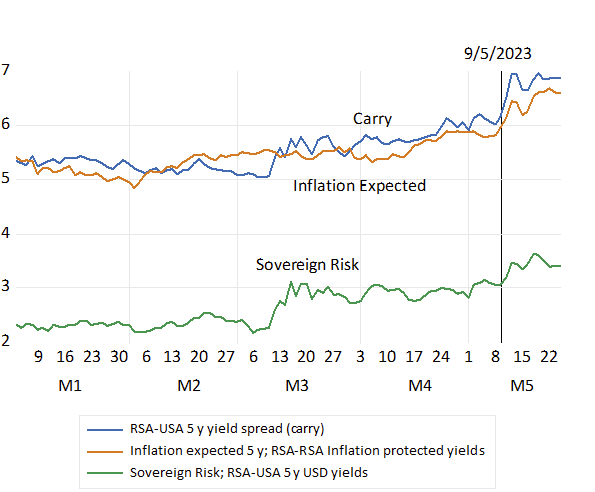
Fig.4; Rand Weakness, Inflation expected and the RSA Sovereign Risk Premium. 5 year yield spreads. Daily Data 2023 to May 16th 2023.
Source; Bloomberg Investec Wealth and Investment
In response to this exchange rate shock – for reasons specific to SA – the SA rate of inflation is very likely to trend higher, independently of by how much the Reserve Bank raises short-term interest rates to further reduce spending pressures on prices. Yet raising short-term rates is almost certainly negative for growth in incomes and employment of which the SA economy is already so sorely lacking, given load shedding and a general loss of confidence in the competence of the SA government. The forces that have given us this latest exchange rate shock are completely out of the Reserve Bank’s control. The
Governor needs to recognise this and do little additional harm to the economy and its growth prospects- by not reacting to the exchange rate shock.
It seems evident that the surging rand prices for our mineral exports may not help the Rand this time. A working Transnet to ship the metals and goods out the country would help – as even more important would be a consistent supply of electricity. But it is hard to be optimistic about such immediate responses and investors shared this pessimism earlier in the year and well before our damaging Russian connection came to light to add further to relative rand weakness.
Unfortunately, we do seem saddled for now with a weak Rand and a near-term uptick in inflation. Yet the weaker rand is not an unmitigated disaster. Exporters and firms competing with more expensive imports will benefit from higher rand prices for their production. Their extra rand costs of production will lag higher rand revenues until local inflation catches up with the inflation of the rand prices, they will be able to charge on foreign and domestic markets. The window of extra profitability will be supportive of extra output, incomes and employment. And of the rand values of the exporters and global plays (e.g. Richemont or Naspers) listed on the JSE. Sectors of the JSE that face abroad can provide a very good hedge against rand weakness that occurs for SA specific reasons, as they are predictably doing.
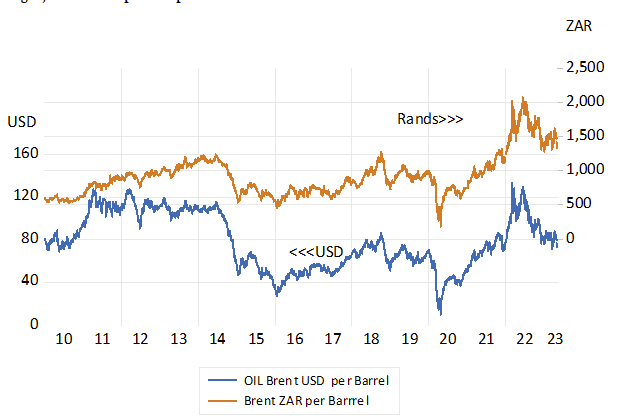
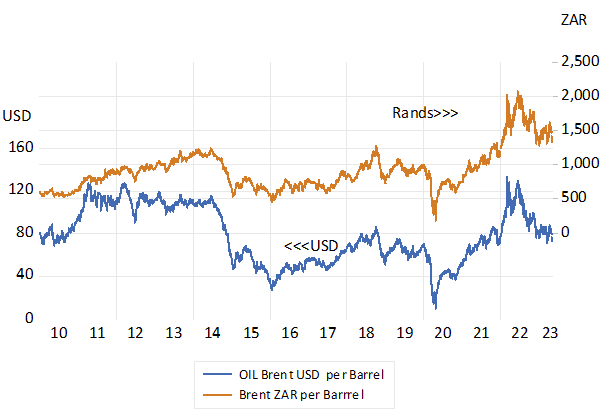
The rand cost of petrol and diesel will play an important role in influencing the inflation rate in the months to come. A saving grace for the inflation outlook is that the dollar price of oil and gas has fallen away- by more than the ZAR has weakened against the USD. (see figure 5)
Fig.5; Brent Oil price – per barrel in USD and ZAR
Source; Bloomberg and Investec Wealth and Investment
The biggest danger to the local economy is that the Reserve Bank will raise interest rates further (the money market already expects increases of over 100b.p. in the next few months) The most recent attempt to support the ZAR raising interest rates by 50 b.p. at the last Monetary Policy has been a conspicuous failure. It has not helped, could not support the rand in the circumstances, but has further depressed spending and the growth outlook. And helped push long term interest rates and the cost of capital higher.
The best approach to rand shocks – that have nothing to do with monetary policy settings- is surely to ignore them – and let the inflation work itself out without higher interest rates. One has long hoped that SA had learned the lesson to not interfere with the currency market. Interest rates can have little impact on the ZAR in current circumstances. The best support for the rand will come from faster economic growth that raises incomes and tax revenues for the state.
Long term interest rates in SA are now punishingly higher than they were last week and the rand is now expected to weaken at an even more accelerated rate than was the case a week ago. This is because SA remains at greater risk – given the even more depressed outlook for growth – of not easily balancing its fiscal books. The expectation of even slower growth to follow still higher borrowing costs, as is widely expected, has added to these risks.
The only way out of the mess SA has got itself into is to surprise investors by delivering surprisingly faster growth- even an extra one percent higher GDP would be helpful. The Reserve Bank has a crucial role to play in this by ignoring the exchange rate shock. Eliminating load shedding and delivering more exports are even more important to improve the growth outlook and reduce SA risks.
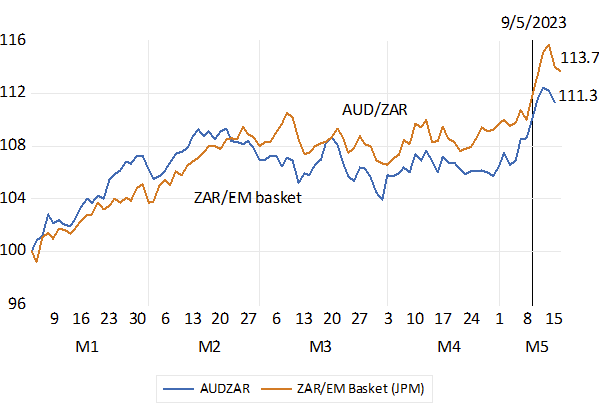
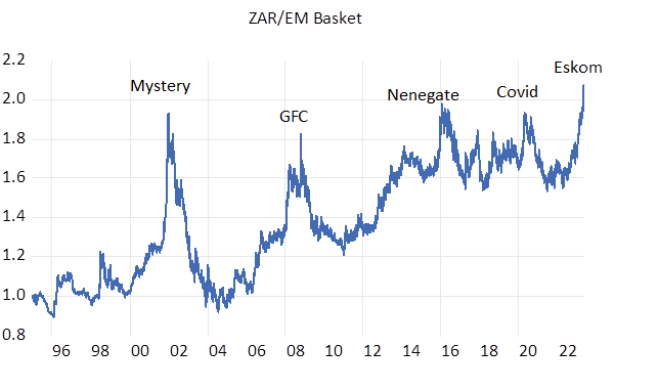
The latest shock to the SA currency and bond markets is of a large scale, similar to those of 2001, and of 2008-9, that was linked to the Global Financial Crisis, also to the Zuma-Nenegate shock of 2015-16, and the Covid shock of 2020. This shock is entirely of our own making. It is the punishing result of a failure to keep the lights on and choose our friends more carefully. We can assert this not only by reference to the abruptly higher rand costs of a USD or Euro, but by the poor performance of the ZAR against other emerging market (EM) and commodity currencies. A weakness that was pronounced earlier in the year as load shedding increasingly hurt the growth prospects of the economy and that was accentuated on the news of our arms business with Russia. The ZAR this year to the 24th of May, after a further burst of weakness on the 10th May, is about 10% weaker Vs the Aussie dollar and 12% weaker Vs the JPMorgan Index of EM exchange rates.
Fig.1 Relative performance in 2023 ; ZAR VS AUD and EM Index; Daily 2023 to 24th May 2023. (2023=100) Higher numbers indicate relative rand weakness.
The ZAR compared to a basket of seven EM currencies – the ZAR/EM ratio – has never been weaker than it is now. The ratio very easily identifies the periodic shocks to flows of capital to and from SA since 1995. One can only hope that this time will not be different and that the ZAR bounces back- at least relative to our peers.
Fig.2. Identifying SA specific risks- comparing the behaviour of the USD/ZAR exchange rate to that of a basket of EM currencies. Daily Data 2000=1 to 15th May 2023
Higher ratios indicate relative rand weakness
Source; Bloomberg and Investec Wealth and Investment.
The RSA bond market could not escape similar punishment. Yields on long dated RSA Rand and USD denominated debt rose by about 60 b.p. between the 9th and 15th of May having all tracked higher through much of 2023. The case for investing more in SA plant and equipment has become that much harder to make. And the rand -judged by the wider carry- the difference between interest rates in SA and the USA- is now expected to weaken at an even faster rate- despite recent rand weakness. All bad news for our economy
Fig.3 Interest rate movements in 2023. Daily Data to 24th May
Source; Bloomberg and Investec Wealth and Investment.
The weaker rand is not an unmitigated disaster. Exporters and firms competing with more expensive imports will benefit from higher rand prices. Their extra rand costs of production will lag higher rand revenues and until local inflation catches up with the higher rand prices they will be able to charge on
foreign and domestic markets. The window of extra profitability will be supportive of extra output, incomes and employment. And of the rand values of the exporters and global plays (e.g. Richemont or Naspers or the International Mining Houses) listed on the JSE and who account for more than half its market value. The JSE is not in shock- it is well hedged against SA specific shocks.
How quickly inflation rises in the months to come will depend on the rand price of imported oil. A saving grace for the inflation outlook is that the dollar price of oil has fallen by more than the rand- hence a lower rand price of a barrel of oil.
Fig.4; Brent Oil price – per barrel in USD and ZAR
Source; Bloomberg and Investec Wealth and Investment
The interest rates set by the Reserve Bank will make no difference to the rand or the inflation rate. Hopefully they will react to an exchange rate shock by not reacting to one. And do what little they can not to slow down growth any further.
The Treasury could help –by keeping the peak loading generators on for longer. And pay for the extra diesel or LPG. Every hour of load shedding not only means less income and output generally – it means lower tax collections. Every rand spent on diesel by the public or on replacing Eskom means less tax revenue in proportion to the company and personal income tax rates and the conversion to solar
allowances. Spending taxpayers rands on diesel will pay for itself. And possibly produce the growth surprise that could turn, only can turn around the rand.
There was no good reason for the Reserve Bank to have surprised with a 50 basis point increase in its repo rate. There is in fact no good reason at all to subject the beleaguered SA economy to any further increases in interest rates. Given the bank’s own assessment of the state of the economy. To quote the statement of the Monetary Policy Committee of the 30th March. “Turning to inflation prospects, our current growth forecasts leaves the output gap around zero, implying little positive or negative pressures on inflation from expected growth”. The output gap is the estimated difference between potential growth in the economy (the supply side) and the growth in demand expected. The expectations for both growth in demand and supply are depressingly slow- no more than 1% p.a. over the next two years.. But clearly there are no demand side pressures on the price level.
The Bank’s forecasting model indicates that every 1 per cent shock to the repo rate will reduce GDP growth by 0.17% on an annual basis with the peak impact two or three quarters after the interest rate shock. While inflation is predicted to decline by 0.12% two years after the shock. While these are the estimated impact of higher or lower interest rates, other things equal, other things are very likely to change in highly unpredictable ways. For example exchange rates, or food prices or electricity tariffs or export prices- supply side shocks – over which the Reserve Bank has no control, nor any superior ability to predict. And which are as likely to move higher or lower over the forecast period and therefore should be ignored when setting interest rates. The strong focus of policy attention should be on the demand side of the economy- on the potential output gap over which the Bank does exercise influence. And without excess demand price increases cannot continue in an ever-higher direction- irrespective of recent inflation. Why the Bank would risk even slower growth by imposing still higher short term interest rates is hard to appreciate.
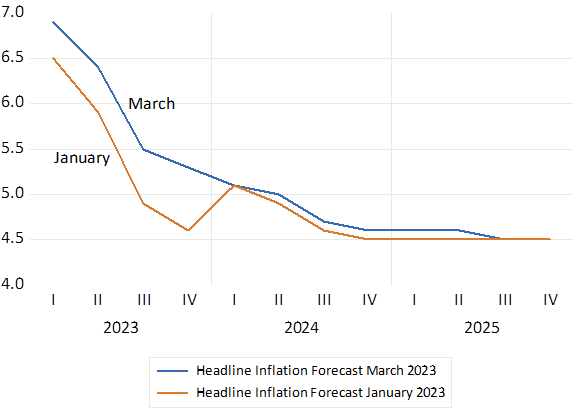
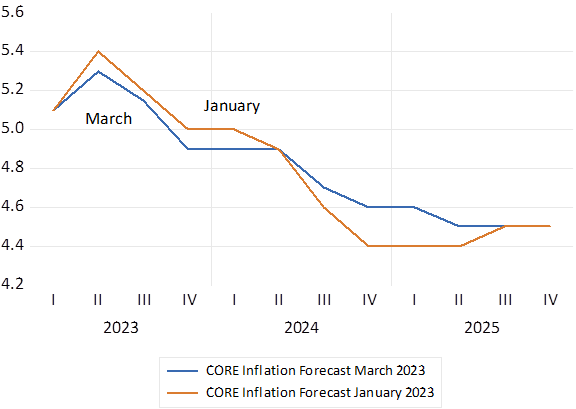
Since its January meeting the Bank, by no means alone, has been surprised by global inflation, by food prices, by rand weakness etc, enough to have taken recent headline inflation rates above what was predicted at earlier meetings. Though the longer term expected trend in headline inflation remains as it was – pointing distinctly lower below the targeted band. Incidentally the core inflation rate that excludes energy and food prices – large supply side shocks – has behaved almost exactly as expected. All further reason to have stood pat.
SA Headline Inflation. Actual and forecast by the Reserve Bank
Source; SA Reserve Bank and Investec Wealth and Investment
SA Core Inflation. Actual and forecast by the Reserve Bank
Source; SA Reserve Bank and Investec Wealth and Investment
There is perhaps more to the decision to raise interest rates than the usual focus on prices. The MPC statement and the Q&A session after the meeting cast unusual concern about the foreign financing needs of the SA economy. To quote the MPC statement again – “South Africa’s external financing needs are expected to rise. With a sharply lower export commodity price index, stable oil prices and somewhat weaker growth in export volumes, the current account balance is forecast to deteriorate to a deficit of 2.7% of GDP for the next three years. Weaker commodity prices and higher sate-owned enterprise financing needs will put pressure on financing conditions for rand-denominated bonds. Ten-year bond yields currently trade at about 11.2%, despite the expected moderation of inflation over the forecast period”
It therefore appears to me that higher interest rates to attract foreign capital interest rates may have played a decisive role in the MPC decision. The rand and the long end of the bond market did benefit from a wider interest rate spread in a modest way. But such experiments in exchange rate management are surely not to be recommended, given all else that can happen to exchange rates. I thought we have learned (expensively) to leave exchange rates and long-term interest rates to sort out balance of payments flows – and yet still to learn to set interest rates with the domestic economy front of mind.
RSA 10 year bond yields and the USDZAR – before and after the decision to raise the repo rate by 50 b.p.
The demise of Silicone Valley Bank (SVB) the 15th largest US bank, with an important systemic role in the roll out of US Tech happened quickly. In less than 24 hours it was all over for shareholders as the regulators took over to prevent banking contagion. By offering insurance not only on the deposits of all denominations of SVB, but effectively on all deposits with US banks, should it be needed.
It was not a run on the banking system – depositors were not lining up to cash in their deposits- as they might have done in primitive times before. They were acting online, transferring their deposits as quickly as they could to their accounts with the banking behemoths JP Morgan, and their like. As the venture capitalists and their many subsidiary companies did with their deposits with SVB,
It was clear what caused the panic withdrawal of deposits from SVB. It was a sudden loss in the share market value of SVB to which the depositors acted as they did. They may not have known what was going on but they took fright. It is the market value of a company and its capital raising potential that protects creditors and this protection had fallen away. For reasons that had everything to do with decisions taken by SVB itself on surely very poor advice, that investors in SVB had recognized as destroying the market value of SVB.
The problem for SVB and other banks was that the fixed interest rate yield on their essentially sound assets had been rising steadily, causing their values to decline, even as the interest rates paid on deposits were edging higher in response to Fed tightening. Accordingly, the net interest income earned by the banks and their earnings per share were in decline. A trend clearly uncomfortable to earnings conscious and presumably earnings growth incentivized managers of SVB.
The advice was to mark the portfolio to market values, and recognize the capital losses on the balance sheet. To raise additional share capital in the market to restore required capital to asset ratios and to invest the capital in higher yielding government and other securities. By so doing improving net interest income and the earnings outlook and the share price.
There was no regulatory compulsion to recognize the losses on their portfolio. The alternative was to have let the assets run off as they became due and to accept the consequent decline in earnings for the next three years or so and the possibly negative reactions of the capital market to a well understood and unavoidable economic reality. There would then have been no need to raise additional capital.
The capital market would surely have been capable of seeing beyond the decline in earnings and focused on the inherent quality of the SVB balance sheet and its potentially durable business model. The problem for SVB was that the capital market clearly did not think that the proposed plans for the balance sheet made good sense and that two billion dollars of extra capital required could be raised on reasonable terms. Doubts that put pressure on the share price that undermined the possibility of raising the additional capital.
The protection in the form of market value for depositors and shareholders in SVB and beyond fell away dramatically and the bank went down. All because of a false belief in managing earnings per share and the failure to recognize how companies are properly appreciated and valued on the share market. Concerns that extend well beyond the short-term prospects for accounting earnings. Adjusting wisely to Covid 19 and its aftermaths has proved difficult enough for the great growth companies with the strong balance sheets. It is even more difficult for banks, with high degrees of leverage, to wisely adjust their balance sheets in such unpredictable circumstances. SVB clearly failed to do so.