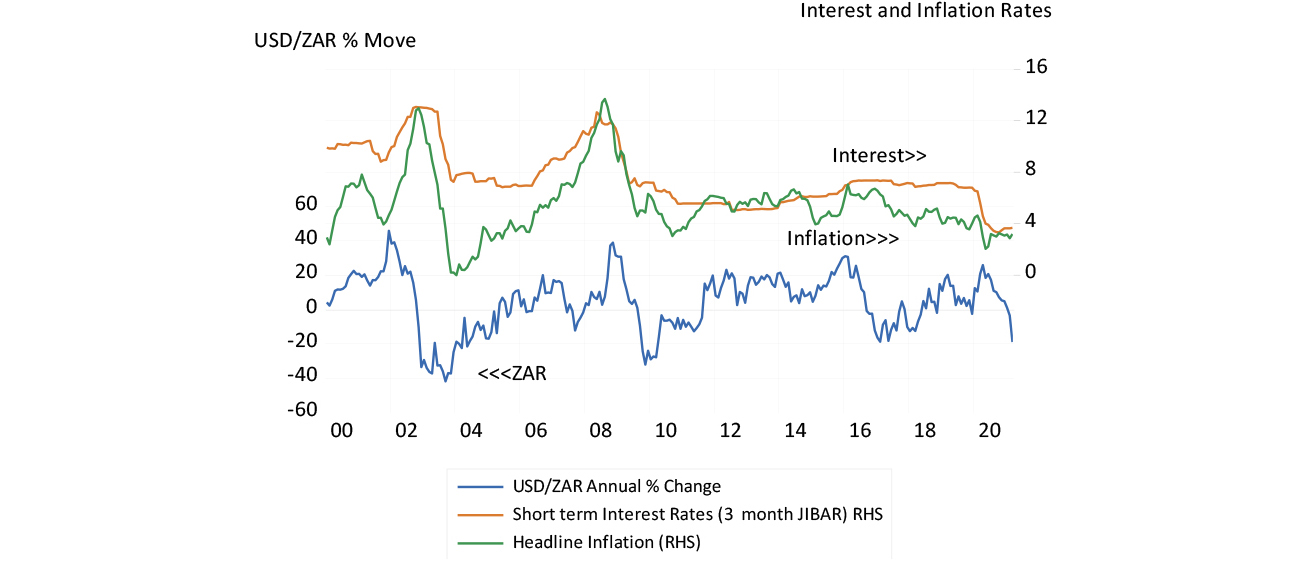
Trade with foreign partners plays a very important role in the SA economy. Exports add about 30% to the demand side of the economy and imports add about the same 30% to the total supply of goods and services. Such trade is almost all conducted in a foreign currency – mostly with the USD – at a rate of exchange that is highly variable and thus very hard to predict. For exporter or importers and those competing with imports knowing what their rand revenues or rand costs will be- that is how profitable their operations will be – is subject to much uncertainty. Such risks to business plans are a clear discouragement to foreign trade. The volatile exchange rate is a burden SA business has had to cope with as best they can- by partly hedging, expensively, their short term exposures to exchange rate movements .
In the chart below we show just how variable that USD/ZAR exchange rate has been- indicating that the volatility of the rate of exchange has not declined much, even as the ZAR has performed much better and inflation has receded since 2023. The oil price shock, as do all globally important events, adds to ZAR volatility. The annual increase in the rand cost of a dollar change (USD/ZAR exchange rate) since 2000 has average by about 3.7% p.a. – with wide spreads about the average- the Standard Deviation about this average has been over 15% p.a. Measured on a six month or three-month basis volatility has also been highly pronounced as we show
The movement of the USD/ZAR exchange. % Move over 12, six and three months. Daily Data 2000-2026
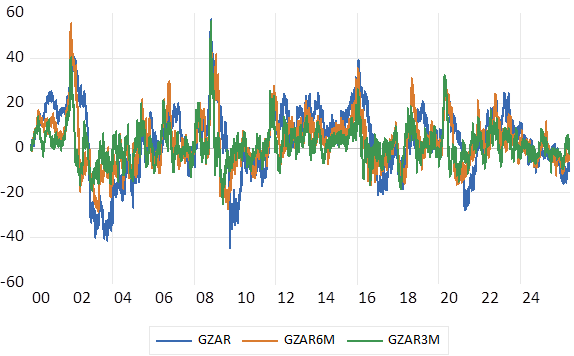
Source; Bloomberg and Investec Wealth & Investment
The movement of the USD/ZAR exchange. % Move over 12, six and three months. Daily Data 2020-2026 and average annual move 2.38% p.a
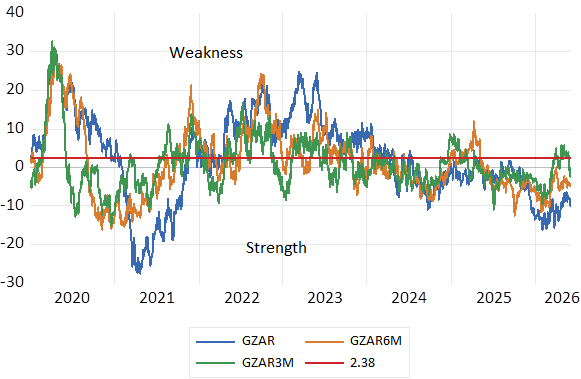
Source; Bloomberg and Investec Wealth & Investment
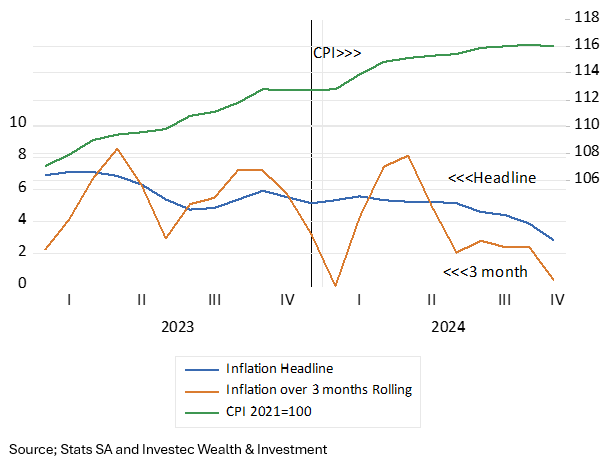
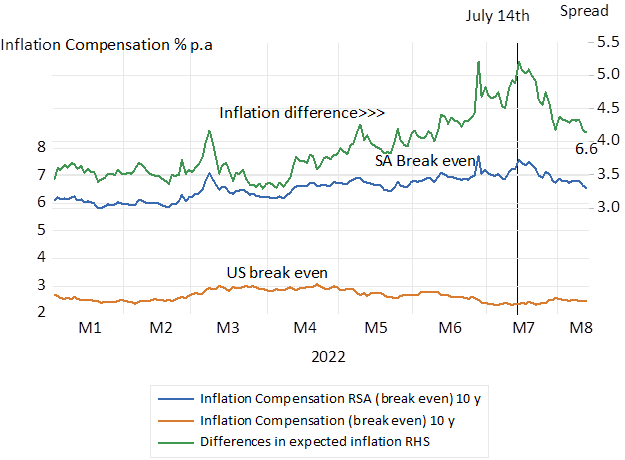
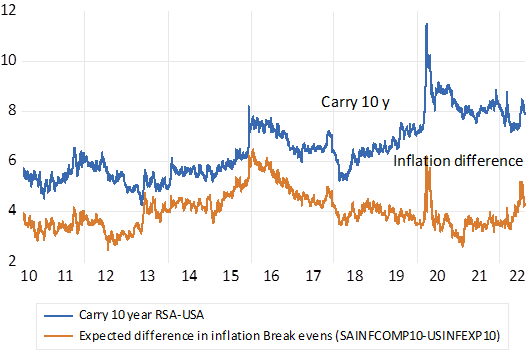
The openness of the economy moreover makes the exchange rate a very important influence on the prices of goods and services in general as reflected in the CPI or PPI. Where the exchange rate goes prices follow in the same direction. Moreover, the exchange rate movements, wide as they are, have led rather than followed the direction of the inflation rate to help level the foreign trading field. What is gained for exporters with a weaker USD/ZAR exchange rate is taken away with more inflation of their local costs of production. And vice versa for importers who are hurt by a weaker exchange rate but assisted by the faster rate at which the costs of local competitors will be rising following rand weakness.
Though as we will show the foreign trading field has not been a consistently level one. The ZAR on average has weakened by more than the difference between SA and US Inflation. SA inflation between 1995 has averaged 5.7% p.a. while US inflation has averaged 2.6% pa, an average 3.16% p.a. slower while the annual move in the USD/ZAR has averaged 6.3% p.a. over the 30 years.
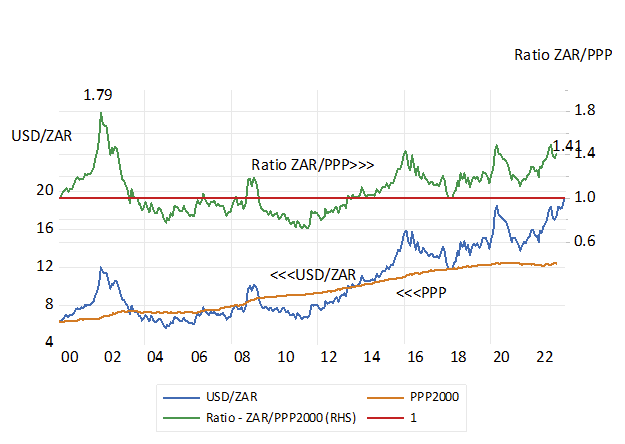
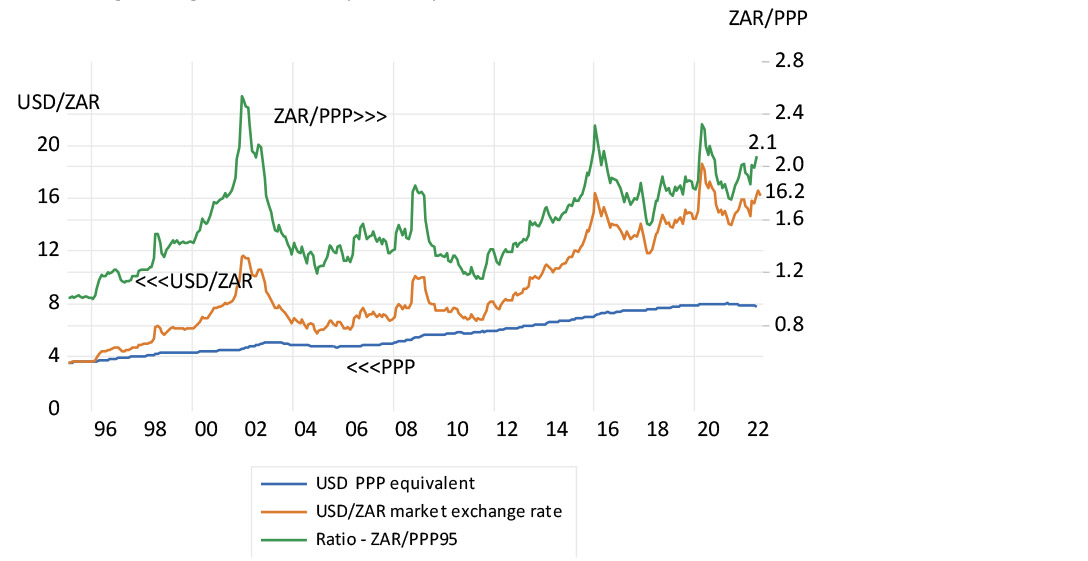
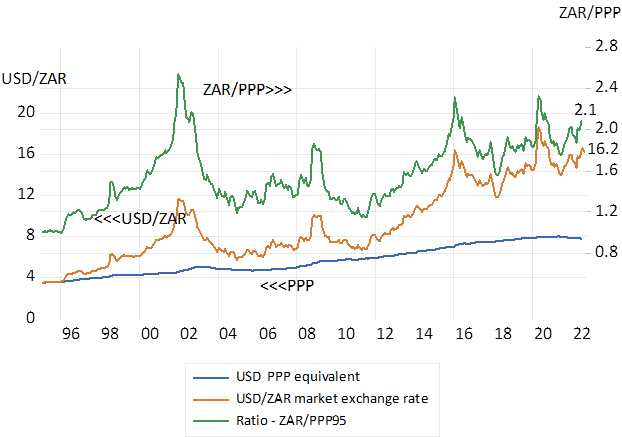
It has made the USD/ZAR a consistently competitive rate of exchange – encouraging presumably more profitable exports and discouraging more expensive imports of goods and services. That is the exchange rate Vs the US dollar has weakened by more than the difference in inflation rates between SA and the USA. In the chart below we show that had the exchange rate largely followed the difference in inflation rates since 1995 ( purchasing power equivalent (PPP) exchange rate) a USD would now cost less than nine dollars. We show also that the ZAR came close to PPP in 2010. The ratio of the USD/ZAR exchange rate to its PPP equivalent has nevertheless averaged well over one to one.
USD/ZAR exchange rate trends. The ZAR/USD exchange rate compared to its Purchasing Power (PPP) equivalent
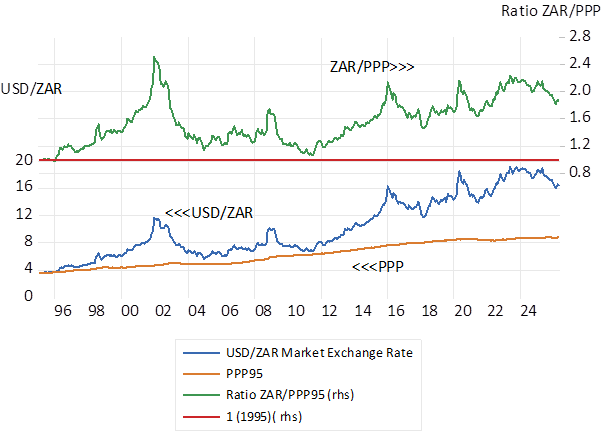
Source; SA Reserve Bank and Investec Wealth & Investment
Though unfortunately faster export led growth has not followed a very competitive exchange rate. Volumes of Exports and Imports have largely stagnated as we show. Largely for the same reasons that SA growth generally has remained highly subdued. The rising cost of electricity and the failures of Transnet have been headwinds slowing growth and exports. The failure to offer competitive returns for investing in SA mining is another reason why exports have not grown faster despite highly favourable metal prices in USD and more so in ZAR. But this is not the place to catalogue the reasons for the failure of the SA economy to grow faster. But export led growth remains a route out of stagnation if SA could get its act together.
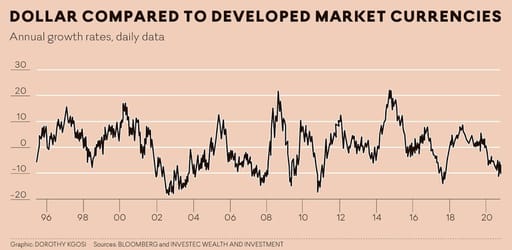
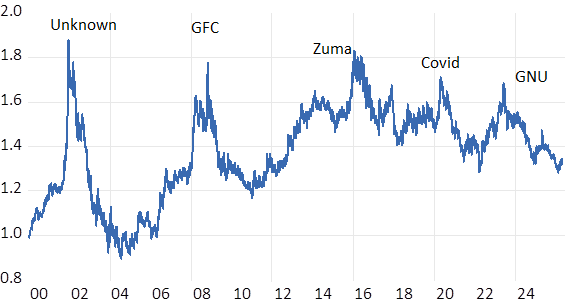
The volatility of the ZAR is explained largely by forces that are beyond South African control. The forces that drive highly variable flows of mobile capital to and from the US and into emerging markets generally of which SA is an actively traded part have moved the ZAR. Global forces much more than SA specific risks explain much of what happens to the USD/ZAR and other exchange rates. And will continue to do so. We should continue to expect exchange rate volatility. Capital flows are far more important flows than trade on the forex markets. Yet the Reserve Bank could do a much better job of not reacting with higher interest rates to exchange rate volatility over which they have little influence.
The volume of SA exports and imports (constant 2015 prices)
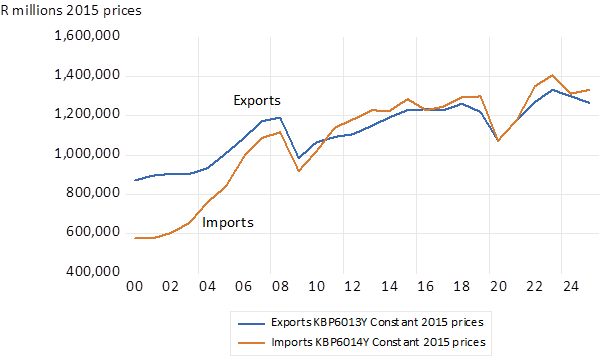
Source; SA Reserve Bank and Investec Wealth & Investment
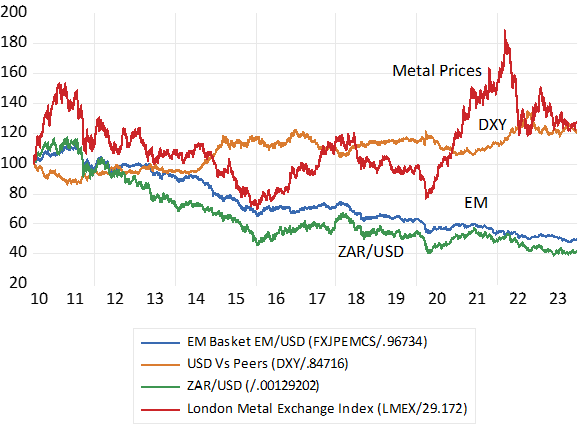
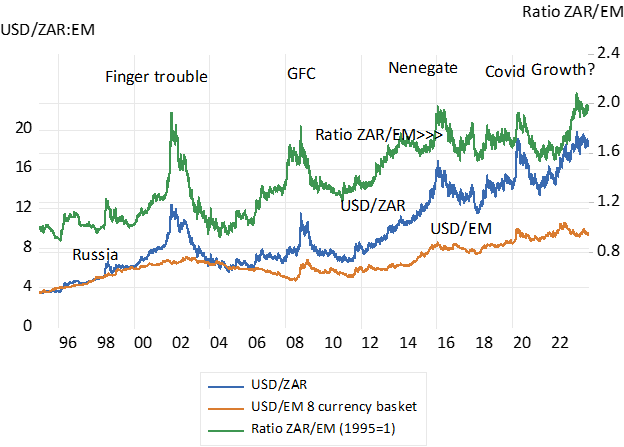
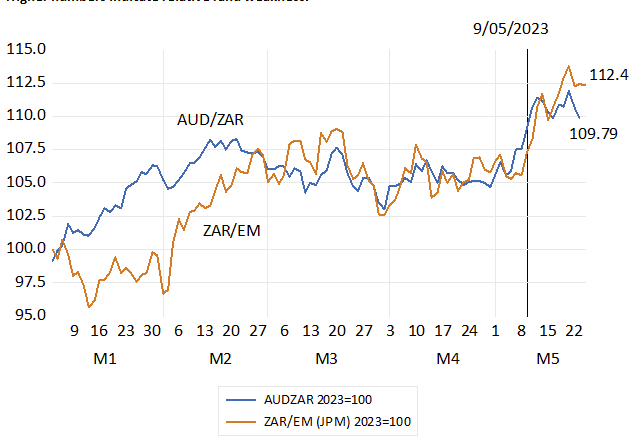
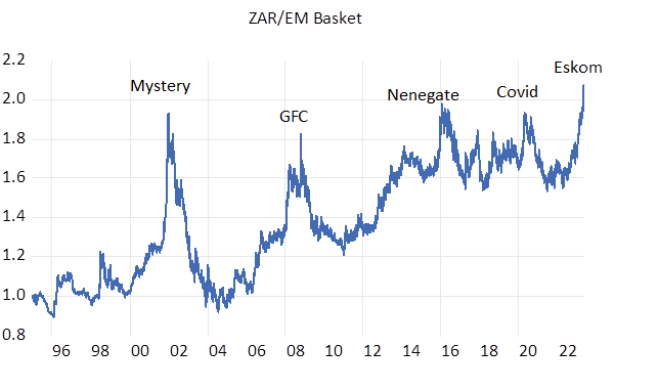
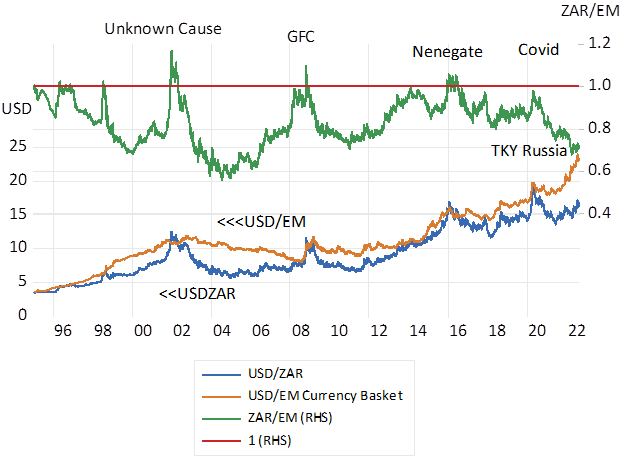
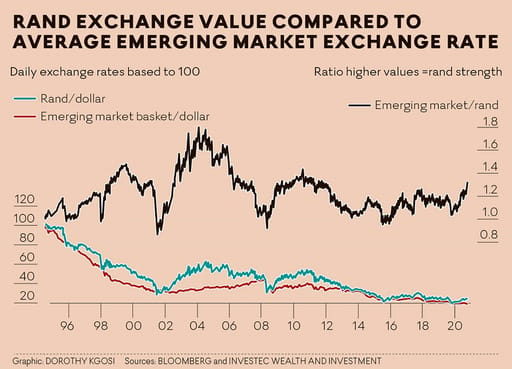
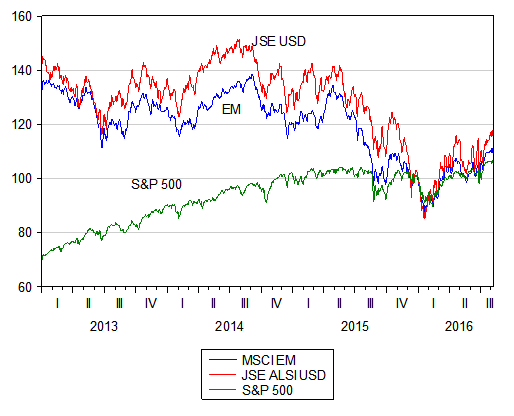
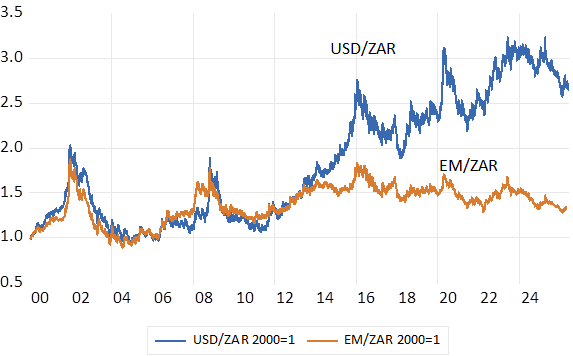
The major force driving the ZAR has been the rates of exchange at which Emerging Market (EM) Currencies as a group have exchanged for the USD. If we could predict the direction of a representative sample of EM currencies we would be able to predict the USD/ZAR exchange rate with a high degree of accuracy. But unfortunately, such a forecast, essentially a forecast of where the USD will be going VS the other major currencies, is a very difficult task.
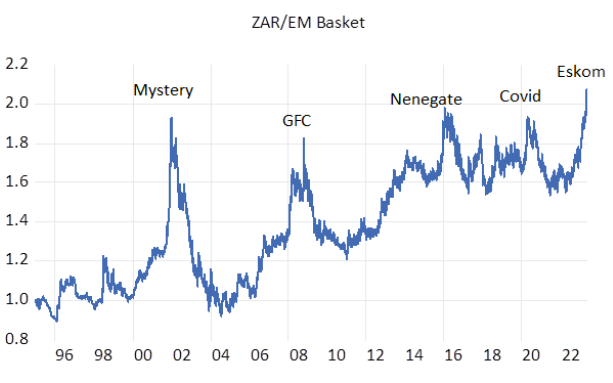
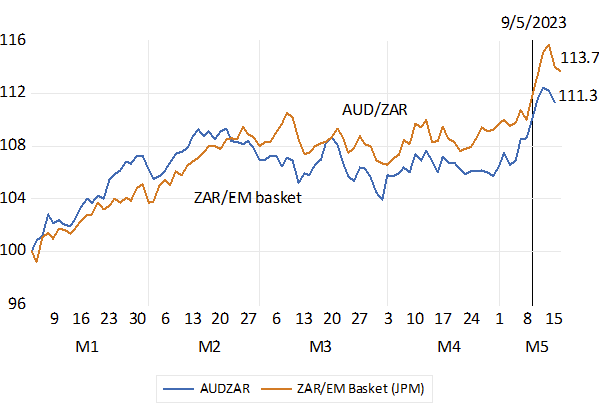
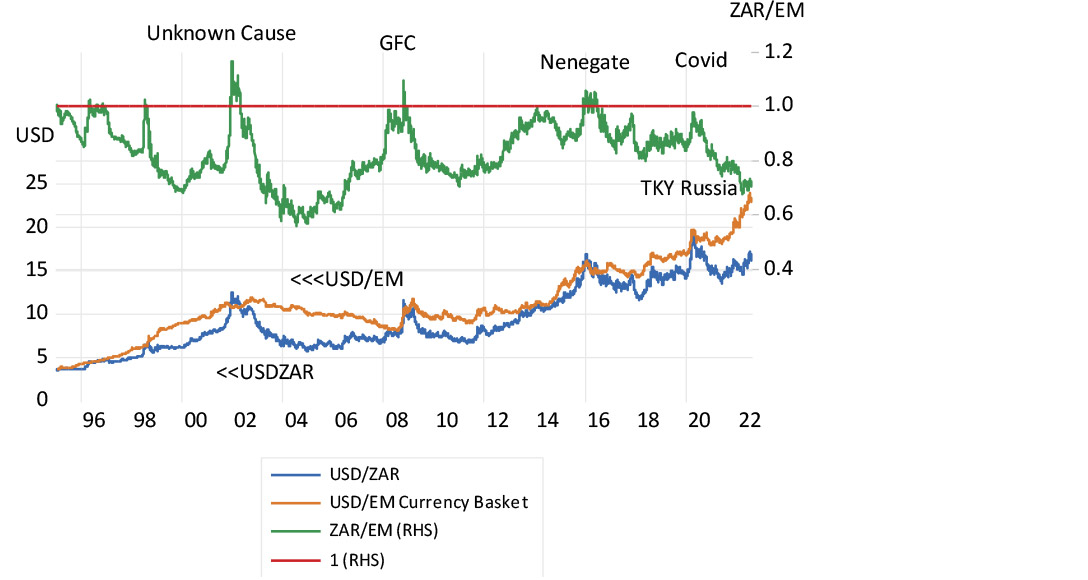
Nevertheless, the ratio of the USD/ZAR exchange to the basket of EM currencies can help explain much of the behaviour of the USD/ZAR exchange rate over the years as we show below. When the ZAR moves away from its EM foundations a movement back to equilibrium can be predicted with some confidence. There has been very little change in the EM/ZAR exchange rates over the past ten years as we show below. It is striking that in recent years with a degree of USD/ZAR strength the ratio ZAR/EM exchange rates is now close to one to one even as the USD now cost about 2.5 times its rand cost of 2000. SA specific risks have not been harmful as they have been in the past. Hopefully these risks will continue to be contained.
The USD and the basket of EM currencies – exchange rates with the ZAR. 2000=1
Source; SA Reserve Bank and Investec Wealth & Investment
The EM/ZAR exchange rate. 2000=1 (ZAR weakness indicated by higher numbers > 1)
Source; SA Reserve Bank and Investec Wealth & Investment
| Date: 06/01/26 Time: 14:39 | |||
| Sample: 1/03/2000 6/01/2026 | |||
| GZAR | GZAR6M | GZAR3M | |
| Mean | 3.699710 | 2.420598 | 1.157351 |
| Median | 5.277807 | 1.517241 | 0.744312 |
| Maximum | 57.26489 | 55.22295 | 56.45716 |
| Minimum | -44.21883 | -28.47029 | -24.67861 |
| Std. Dev. | 15.33566 | 11.29241 | 7.748092 |
| Skewness | -0.378492 | 0.581650 | 0.932699 |
| Kurtosis | 3.192620 | 4.130874 | 6.475632 |
| Jarque-Bera | 175.1832 | 755.7540 | 4467.587 |
| Probability | 0.000000 | 0.000000 | 0.000000 |
| Sum | 25494.70 | 16680.34 | 7975.303 |
| Sum Sq. Dev. | 1620407. | 878603.3 | 413626.9 |
| Observations | 6891 | 6891 | 6891 |