Ramaphosa revealed- and an early test of policy resolve

27/09/2018

The economic policy intentions announced by President Ramaphosa last night (26/09/2018) were encouraging if only because it made clear that the President fully understands the imperative of faster economic growth. As indeed he should. It was not obvious that his predecessor cared at all about growth. He had a very different agenda.

The economic diagnosis offered was apposite – for example, to quote the President ‘…Businesses are not struggling with lack of access to cash. It is due to lack of confidence and a dearth of viable investment opportunities that businesses have been reluctant to spend money on fixed capital. These obstacles require policy and regulatory action that provided clarity and raise efficiency …”   One might have added—or willing to add working capital that might have been applied to employing more people and improving their capabilities.

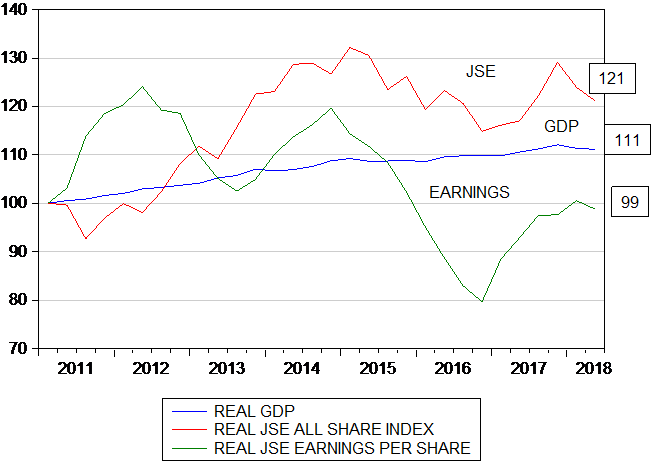
It is important to recognize how JSE listed companies have increased their dividend payments- cash paid out – relative to their after tax earnings in recent years – for want of investment opportunities that offered high enough – risk adjusted returns. Since 2011 dividends have grown 2.5 times while earnings have increased by only 1.6 times

JSE All Share Index Earnings and Dividends per Share (2011=100)

1

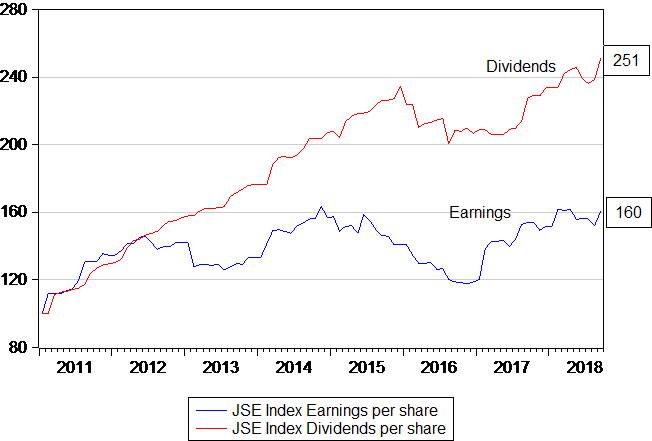
Source; Iress and Investec Wealth and Investment

The economy and the share market would have done much better had the cash flow been saved by the listed firms and invested by them in what in more normal times might have proved to be cost of capital beating investments. That is realized returns on capital invested that exceeded required returns of the order of 14% a year. With hind sight shareholders should be pleased that the firms invested as little as they did.  Since 2011 the JSE All Share Index, adjusted for inflation, has gained 21%, the real SA GDP is up a dismal 11% (equivalent to an average 1.4% p.a rate of growth, while real JSE earnings have not increased at all over this seven and a half years.

The real JSE compared to the real GDP (2011 =100)

2

Source; Iress, Stas SA  and Investec Wealth and Investment

Over recent years the expected returns of SA business have receded with the slower growth expected and realized while the risks to these expected returns have risen. As objectively reflected by the sovereign risk premium demanded of RSA dollar denominated debt. In the fast growth years between 2004 and 2008 (GDP growth averaged over 5% p.a. between 2004 and Q2 2008- ( not fast enough to keep Thabo Mmbeki in his job) the RSA risk premium for five year RSA dollar denominated debt averaged about 0.67% p.a. Since 2014 RSA the yield on SA dollar debt has had to offer on average an extra over 2% p.a on average compared to the yield offered by five year US Treasury Bonds. Put another way returns on an investment in SA assets now have to offer at least an extra 2% p.a in USD to appear worth making.

The South African sovereign risk premium

3

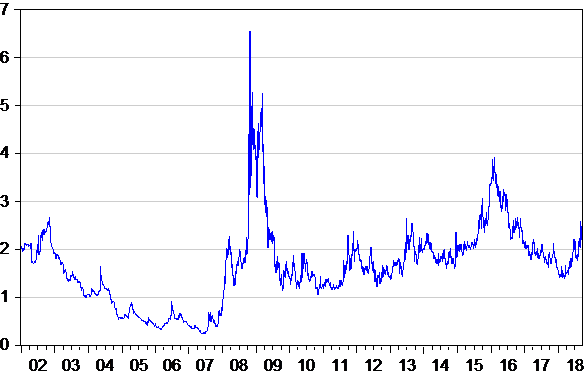
Source; Bloomberg and Investec Wealth and Investment

In the service of growth this risk premium has to be reduced, as the President appears to understand. He also appears to recognize that the risks to SA rise and fall with realized growth. The rating agencies remind us constantly of this – and as the currency debt and equity markets also do so. They reacted negatively in response to the disappointing latest GDP growth estimates for Q2 2018. Clearly capital flows in, in response to faster expected growth and out with slower growth expected.

With growth, more capital becomes available on better terms, to support the exchange value of the ZAR. A stronger rand therefore means less inflation, lower interest rates and so further support from the demand side of the economy for growth. A virtuous circle presents itself with growth encouraging policies. One of more growth expected with less inflation given rand strength. As opposed to slower growth- a weaker rand – and so more inflation accompanied by higher interest rates. This has been the vicious circle SA has been trapped in for many years now.

One can express the hope (though the President is well advised not to question the independence of the Reserve Bank nor its judgment) that the Bank fully understands the link between growth, inflation and the exchange rate – over which it has such minimal influence anyway. Three unnamed members of its monetary policy committee (happily not a majority) voted for higher short term interest rates at its meeting last week. With demand as depressed as it is and inflation, outside of regulated prices as low as it is, given the very limited pricing power of firms, one can only wonder at the logic that called for even less demand – that inevitably follows higher interest rates. Perhaps it is the theoretical notion that more inflation expected leads to more inflation- regardless of the state of demand. For which there is no evidence.

South Africa is suffering from both a lack of supply and a want of demand. Fixing the demand side would simply take lower interest rates. Stimulating more demand would also soon bring faster growth now and less – not more inflation. Fixing the supply side of the economy will take longer but would permanently raise the growth potential of the economy.

Our economy could also do with a bit of luck that has been absent since the end of the metal and mineral price super cycle that lasted beyond the Global Financial Crisis of 2008- and only ended in 2011. The SA mining price deflator, converted into US dollars increased by 2.5 times between 2004 and 2011. Prices in USD in early 2016 were about 40 per cent off the 2011 peak, before they turned up again- slowly.  Stronger metal prices in USD and more favourable economic trends in Emerging Markets generally would do much to help the rand and the SA economy. These are however global forces over which we have no influence but to which the rand and the JSE and bond yields inevitably react. A mining charter that recognized the trade-offs between growth in output and the distribution of its benefits, beyond those who take on the risks of investment, would be a way of helping ourselves – and is an early test of Ramaphosa realism.


High Frequency SA data- interpolating some up to date statistics- and explaining the SA business cycle.

The problem with much of the data that makes up the GDP is that it is out of date. Knowing how well or badly the economy is now doing becomes a matter of judgment and estimation rather than fact. For example the SA GDP estimates for the second quarter of 2018 (to June) became available only on the 3rd September 2018. Nevertheless despite being after the event they came in less than expected and moved significantly the markets in the rand and RSA debt- and the JSE more generally- sending the rand weaker and bond yields higher and the JSE lower.

The quarterly GDP is but an estimate of total national output and expenditure,  based upon sample surveys of the value added by business enterprises, of income earned producing goods and services and expenditure on them. That is when delivered by retailers and others in the supply and demand chains of the economy. These estimates are then revised, sometimes significantly, and often more than once, as more complete estimates become available.  

Much of the data that is used to estimate and re-estimate GDP is made available by Stats SA on a monthly basis. For example retail sales or vehicle sales or credit and debt account transactions. But again such important indicators about what has gone on in the economy may also be based on sample surveys that take time to collect that make them out of date. For example the recently released retail sales statistics issued by Stats SA date back to July 2018.

The Reserve Bank in its Monthly Release of Selected Data available on its Web site https://www.resbank.co.za/Publications provides a large number of economic indicators, including leading, lagging and coincident indicators of the Business Cycle. Its coinciding business cycle indicator, based on approximately twelve time series,  is highly correlated, as intended, with GDP (converted by ourselves into a monthly equivalent of the quarterly series as we show below) However the latest estimate of this coinciding indicator is for May 2018 and lags behind the GDP data itself making it less than very useful as a guide to the current state of the economy.


Figure 1; Comparing SA GDP with the Reserve Bank Business Cycle Indicator
1

Source: Stats SA, SA Reserve Bank and Investec Wealth and Investment

There are however two very up to date and important economic time series that help reveal the current state of the SA economy. Moreover they are actual hard numbers and not based on sample surveys. These are new vehicle sold to SA buyers – released by Naamsa, the vehicle manufacturers,  and the notes and coins issued by the SA Reserve Bank, revealed on the Reserve Bank balance sheet published within seven days of each month end on its web site.

Vehicle sales can be regarded as highly representative of the appetite for durable goods exercised by households and for capex by firms and for the credit used to fund purchases of new vehicles – not only cars that may be rented or leased, but commercial vehicles of all kinds. Cash issued on demand for it by the Reserve Bank is demanded by households to fund their intended expenditure. These demands have a strong seasonal component rising strongly in December and before Easter holidays- that unfortunately for the statistician can come earlier or later complicating the seasonal adjustments. Despite the fast growing exchanges facilitated by credit and debit cards and on-line the demand for cash (and its supply) continues to grow closely in line with economic activity. This makes it very useful as an up to date indicator of current spending that will only be revealed officially much later.

We combine vehicle sales and the real note issue, real cash, giving both equal weight to form our Hard Number Index of the current state of the SA economy. We deflate the note issue by the Consumer Price Index to establish the real supply of cash. This Hard Number Index (HNI) updated to August 2018 is shown below where it is compared with the Reserve Bank Coinciding Business Cycle Indicator (to May 2018)

As may be seen in figure 2 and 3 the two series compare very well. The HNI may be seen to have stabilized with values in the mid 90’s (2015=100) with a slight upward trend. The HNI suggests that economic activity in SA is growing but very slowly and is to some extent recovering from weaker growth of 2016.

No acceleration of growth rates can be inferred from the pace of vehicle sales and real cash in August 2018. The economy appears to be stuck in an extended phase of marginally positive growth. No lift off appears under way a conclusion that would not surprise may observers and participants in the SA economy


Figure 2. The Hard Number Index and the Reserve Bank Coinciding Indicator (2015=100)
2

Source: Stats SA, SA Reserve Bank and Investec Wealth and Investment


Figure3:  The Hard Number Index and the Reserve Bank Coinciding Indicator  2014-2019 (2015=100)

3

Source: Stats SA, SA Reserve Bank and Investec Wealth and Investment

We show the components of the HNI in figure 4 below and compare the growth in the HNI and the Reserve Bank Business Cycle Indicator in a further chart.

Figure 4; Components of the Hard Number Index (2015=100)

4Source: Stats SA, SA Reserve Bank and Investec Wealth and Investment


Figure 5; Growth in the Hard Number Index and the Reserve Bank Business Cycle Indicator
5Source: Stats SA, SA Reserve Bank and Investec Wealth and Investment
The retail sales cycle as did the HNI,  recovered strongly in late 2017 and have both fallen away since. Retail sales in SA exclude sales of vehicles- new and used as well as of the petrol or diesel used to drive them. This retail recovery was well correlated with a strong pick up (from negative rates) in the real cash cycle. It was lower inflation (particularly of retail prices) rather than an acceleration in the supply of notes that was responsible for this stimulation of demand. It is perhaps encouraging to note that while the retail sales volume cycle has turned sharply down- the real supply of cash continues to grow at a faster rate. (See figure 6 below)
Figure 6; The real retail sales and real cash cycles (smoothed growth)

6

Source: Stats SA, SA Reserve Bank and Investec Wealth and Investment

Were the note issue to be deflated by prices at retail level rather than by Consumer Prices- that include a large measure for administered prices-  the real supply of cash would be seen to be growing faster and helping to further encourage sales at retail level. Clearly retailers and their local suppliers are not enjoying much power to raise prices and to pass on cost increases. This pressure on margins is however better news for consumers than firms and helps to sustain their willingness to spend more. We compare headline and much lower retail or what may be described as business inflation in figure 7 below.


Fig 7: Headline and retail price inflation compared

7Source: Stats SA, SA Reserve Bank and Investec Wealth and Investment
The outlook for household spending will depend as always on their incomes and their buying power and on the confidence household have in the employment and income prospects. The stronger rand in 2016-2017 helped hold down price increases and encouraged a revival of spending at retail level – especially of durable goods with high import content. But the weaker rand in 2018 has put upward pressure on prices and on operating margins. Hopefully it will not bring higher interest rates with it.

Consumers and the business that serve them must hope for a recovery in the rand to help hold down inflation – even should pressure on margins are relieved to some extent. And hope that lower inflation will bring in due course lower interest rates to add to the disposable incomes (after mortgage payments) of households and their willingness to spend more and borrow more. This is the path to a recovery of demand and supply and to faster growth in GDP.

The exchange value of the rand is only very partially dependent on actions taken in SA. The expected state of emerging economies generally – and so the exchange value of emerging market currencies with the US dollar – will remain decisive for the rand, interest rates and inflation in SA . Should SA come to be seen as more investor friendly than it is now regarded, it would to a degree help the exchange value of  the rand and boost the confidence of SA businesses and households in their income prospects and so their willingness to spend and borrow more. As always the Hard Number Index will provide us with advance warning of hopefully improving times for the SA economy. To date the Index indicates that the SA economy is still but marking time

The SA economy has more than a supply side problem

Second quarter GDP, announced on 3 September, was disappointingly smaller than the quarter before. The news sent the rand immediately weaker and the cost of servicing SA debt higher. The rand declined not only against the US dollar but also weakened against other emerging market currencies. This indicated SA-specific rather than global forces at work. And the spread between RSA yields and their US equivalents widened taking SA dollar denominated debt further into high yield, junk territory. SA dollar debt with five years to maturity offers investors about 2.5 percentage points more than US debt of the same duration. Investment grade debt would offer only about 1.5 percentage points more than US Treasury Bonds.

Some of the weakness in the USD/ZAR exchange rate and weakness in the rand against its emerging market peers has been reversed in recent days, as has the upward pressure on RSA and emerging market risk spreads.

The market logic that sent the rand weaker and spreads higher on the GDP news seems clear enough. Slower growth drives capital away from our economy helped by the rating agencies that are expected to officially downgrade our credit ratings because slower growth means less tax revenue collected and more government borrowing leading to capital outflow. And the weaker rand adds to inflation and is thought likely to lead the Reserve Bank to raise short term interest rates. Adding higher interest rates to higher prices is the recipe for still slower growth.

What then can be done to reverse the vicious circle in which SA finds itself, the slow growth that drives capital away, weakens the rand that adds to inflation? And leads seemingly inevitably to still slower growth in spending and output? Faster growth by the same market logic would do the opposite: attract capital, strengthen the rand and the Treasury and lower inflation.

South Africa clearly has a supply side problem. We are not producing enough (adding enough extra value) to generate additional incomes. The reasons for this failure may seem complex but I would argue that it is the result of policies that focus primarily on who benefits from the output produced, rather than on how to raise the levels of output, incomes and employment. In other words, redistribution undertaken or feared at the expense of output and incomes. South Africa needs to impress the world and its own citizens that we will care about raising output. The revised mining charter, to be made public soon, gives the timely opportunity to demonstrate a new pragmatic economic approach, one intended to attract rather than repel capital on internationally competitive terms.

But South Africa not only has the problem of too little supply. It also suffers much from too little demand. Too little demand was exacerbated in the Q2 GDP estimates by a large decline in the demand to hold inventories. Without the reduction in inventories of R14bn in constant prices, growth in GDP in Q2 would have been 2.9% higher. Reducing stock piles and goods and services in production to satisfy demands rather than increasing the output of them may however point to more rather than less output to come.

But even leaving aside declining investment in inventories or volatile quarterly changes in agricultural output – that could easily reverse themselves – the growth in final demand by households, firms and government is running well below even our limited potential supplies of good and services. And has been doing so for many years now. That is to say interest rates have been too high to match demand and potential supply even growing slowly. Interest rates have a predictable effect on the willingness of households to spend (out of after-mortgage payment income) and the willingness of firms to spend to satisfy those demands. Their influence on prices is much less predictable.

The link between interest rates, the exchange rate and inflation is highly unpredictable, given the forces that drive the exchange rate. That take their cue mostly from global rather than South African events. Indeed as the market has revealed the relationship between growth, inflation and interest rates is not what standard theory might predict. Slower growth leads to a weaker rand, more inflation and still higher interest rates that depress demand and growth further. The impact of less demand on prices is vitiated by the likely impact of the weaker exchange rate on prices.

Thus raising interest rates in response to rand weakness exaggerates the business cycle rather than smooths it. The Reserve Bank should have reduced interest rates much faster and sooner than it has, to help match weak levels of demand with potential supply. The best it can now do for the economy is to surprise the market by not raising rates. And then over the course of the next few years, if demand remains as weak as it has been, to reduce them without then being thought soft on inflation. This would help take SA closer to a virtuous circle of faster growth and less inflation and give the economy some head room to undertake the supply side reforms that are essential if its growth potential is to be raised permanently. 13 September 2018

GDP – Realism required

Parsing the GDP estimates and calling for more realism about them

The SA economy has now recorded two quarters of negative growth: it is in recession. The decline in real GDP of -0.7% in quarter 2 came as something of a surprise, enough to send the rand significantly weaker. Which in itself makes the growth outlook even less promising given the implications of a weaker rand for more inflation and higher interest rates. That the rand was weaker for South African rather than global reasons was apparent in the performance of the rand compared to other emerging market exchange rates. The rand by time of writing, 16h30 on 4 September, was 2.85% weaker vs the US dollar and only slightly less, 2.2% down on our nine emerging market currency basket.

The logic in the market reactions to the surprisingly low GDP growth estimates seems clear enough – slow growth adds risk to the fiscal outlook. It may encourage the rating agencies to downgrade SA debt further so encouraging capital outflows form the RSA debt market, hence the weaker rand. Though it should be appreciated RSA dollar denominated five year bonds were already trading in junk territory before the GDP release.

Insuring RSA dollar debt against default required paying a risk premium of 180bps. at the beginning of August 2018. The emerging market crisis took this risk premium to 230bps by the end of August. It is now 360bps – up from 330bps previously. The equivalent Turkish risk premium is now 580bps compared to 333bps in early August, up a mere 8bps on the day.

The GDP growth numbers themselves require careful consideration, perhaps more than they have received by the market place. Not only did highly volatile agricultural output drag the quarter to quarter seasonally adjusted annual output growth rates lower by 0.8%, but more important, a decline in estimated real inventories reduced expenditure on GDP by as much as 2.9% at an annual equivalent rate.

By definition output (GDP) is made up of value added by the different sectors of the economy. This estimate of output is by definition identical to the expenditure on this output and the incomes earned producing goods and services. Supply determines demand and demand determines supply – and gives us the national income identity- that is GDP is equal to expenditure on GDP.

This expenditure is made up of spending by households and government on consumption of goods and services and spending by firms and government on additional capital goods- known as gross fixed capital formation (GFCF). To which additional or in the case of Q2 2018 reduced investment in inventories is added or subtracted. Exports less imports are then added to make up the estimate of Expenditure on GDP (see figures 2 and 4 provided by Stats SA). This shows the contributions to the growth outcomes of the different sectors and categories of expenditure. It should be noted that net exports (exports volumes grew faster than imports and so were a positive contributor to growth in GDP in Q2. Perhaps some of these mining exports were sourced from stock piles (inventories) rather than current output- enough to reduce inventories at the rate indicated?

Farming volumes while contributing about 2.5% of all value added in Q2 2018 are inherently variable, subject to drought and flood and may not have any seasonal regularity. The real output of agriculture forestry and fishing fell at an annual rate of 29% in Q2 and was down by 34% the quarter before. In Q4 2017 the growth was as much as 39% at an annual rate and 42% p.a. the quarter before that. For a better sense of sustainable growth rates it might be better to exclude agriculture from the GDP estimates

The run down in inventories had however a much more important influence on GDP growth than farming output in the second quarter as may be seen in the table above. Less invested in inventories reduced estimated GDP growth by 2.9% p.a in the quarter. Inventories fell by an estimated over R14 billion in constant price terms, at an annual rate. Enough to take the growth estimate into negative territory with such significant repercussions and despite the positive contribution of 3.7% p.a made by exports to the GDP growth recorded

The adjustments made for seasonal effects on the change in inventories were highly significant. It is very difficult to make economic sense of the very different estimates of changes in inventories when measured in current or constant prices, or when measured each quarter or alternatively at a seasonally adjusted annual rate. According to the statistics provided by Stats SA the actual quantity of inventories in Q2 grew by R6.7bn (at constant 2010 prices) in the quarter. In current prices and at an annual, seasonally adjusted rate inventories are estimated to have declined by R7.4bn in Q2 2018, (much less than the R14b decline when estimated in constant prices). Using quarterly statistics (not seasonally adjusted) the value of inventories, measured in money of the day, increased by R11.1bn in Q2.

It takes something of a leap of faith to accept and reconcile these very different estimates of inventory changes at face value. When growth in the other components of spending is at the understandably slow rates recorded in Q2 2108, estimates of investments- less or more – in inventories take on particular significance – as they did today on their release. They should perhaps be treated with much greater skepticism than has been the case.

Yet for all these reservations about the estimates of GDP growth, the weakness of household spending cannot be gainsaid. It is by far the largest contributor to expenditure on GDP and on GDP – equivalent to 59.4% of all expenditure in Q2 2018 at current prices. The reluctance of households to spend more is at the heart of South Africa’s inability to grow faster. Without a greater willingness and ability of households to spend more the economy and its output and incomes will not – cannot grow faster.

Household consumption expenditure declined at a 1.3% annualized rate in Q2 2018- taking 0.8% off the estimated growth of -0.7% p.a. The weaker rand and the higher inflation that will accompany the weaker rand will depress household spending further. It is surely inconceivable that interest rates could be raised in circumstances of this depressed kind.

The value of the rand is beyond the influence of interest rates. Surely as much is painfully apparent after events of the past few weeks. But interest rates do effect the ability of the households to spend more. If economic logic were to prevail interest rates in SA would be reduced not increased given the negative growth outlook. And if so the growth prospects would improve – not deteriorate. If so, it might lead to rand strength not further weakness. Weakness that comes with slower growth, as we saw today. 5 September 2018

Charts of the Week – The usual suspects

The week saw renewed pressure on emerging market (EM) exchange rates, led by the usual suspects, Argentina and Turkey. The rand did not escape the damage and did a little worse than the JP Morgan EM benchmark, that gives a large weight to the Chinese yuan and the Korean won. But it was much more a case of EM exchange rate weakness rather than US dollar strength.

Source: Bloomberg

The spread between US and German 10-year yields has stabilised (perhaps taking a little away from US dollar strength), while the US term structure of interest rates continues to flatten as the longer term rates fail to respond to higher short term rates. The cost of borrowing in the US beyond two years has not been increasing, despite the Fed’s intentions to raise rates in response to sustained US economic strength.

Source: Bloomberg

The pressure of capital withdrawn from EMs was reflected in a widening of the spreads on US dollar-denominated debt issued by EM borrowers, including SA. The spread on five-year RSA debt widened from around 202bps last week to 230, while Turkish debt of the same duration commands a risk premium of 562 bps – compared to 481 bps the week before. If only in a relative sense, SA’s credit rating has improved even as our debt trades as high yield (alias junk). The rating agencies, however, appear to be in no hurry to confirm this status for SA debt.

Part of the explanation of the weak rand and the decline in the value of the JSE, more in US dollars than in rands, has been the dramatic decline in the value of Naspers – up over 11% the week before last and down 7.7% last week. The Hong Kong market, where Tencent is the largest quoted company and in which Naspers holds over 30%, however returned 0.8% in US dollars last week. it is consistent that it is now among the weakest equity performers going into the new week. China and Chinese internet companies, in particular, have been a drag on emerging markets. More optimism about the Chinese economy is essential to the purpose of any emerging market currency and equity comeback.

Source: Bloomberg