Brian Kantor
28th September 2022
The Covid lockdowns has quite dramatically altered the relationships between the South African economy and its global trading and financial partners. What followed Covid was a dramatic improvement in the balance of exports and imports. After 2020 exports, helped by higher prices, grew significantly faster than imports to take the balance of trade to a mammoth, nearly 10% of GDP by Q2 2021. As export prices have fallen off more recently the trade surplus has declined to a still impressive 4.8% of GDP in Q2 2022.
The difference between exports and imports is also the difference between GDP- output or equivalently incomes – earned producing that output – and Gross Domestic Expenditure –mostly on consumption by households and partially on capital goods by firms – that can be funded with loans to supplement current incomes. The trade balance – when positive -represents an excess of local supply over local demands- a contributor to global supply chains- rather than a drawer or absorber of them. The SA economy has thus helped dampen global inflation.
The closely watched current account of the balance of payments adds foreign mostly investment income to the trade balance. South African borrowers and capital raisers pay out interest and dividends at higher rates and yields than they typically receive from their foreign investments. Even though South African’s foreign assets roughly match their foreign liabilities (thanks to Naspers and its Ten Cent investment) This force usually turns trade surpluses into current account deficits – being the sum of the trade balance and the net foreign income accounts.
By definition of the balance of payments accounting system the current account deficits (or surpluses) are equal to foreign capital inflows or outflows. Instead of drawing on global capital markets to fund its capital expenditure budgets South African savers- almost all realized by its corporations to offset very marginal surpluses of the household sector and public sector deficits, became a significant source of savings for world capital markets. Instead of drawing on global capital markets to fund capital expenditure budgets we became a significant source of savings for world capital markets- some 300 billion rands worth since Covid. The current account is now in rough balance.
The trade balance, the current account and net foreign income. South African Balance of Payments Statistics. Quarterly Data
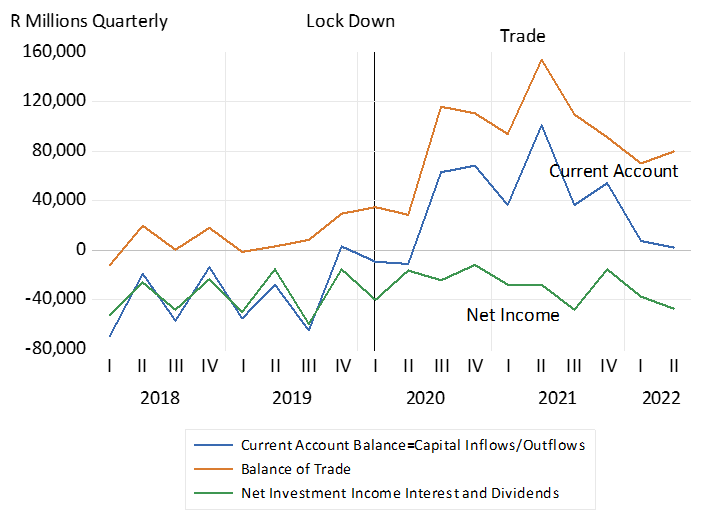
Source; SA Reserve Bank and Investec Wealth and Investment
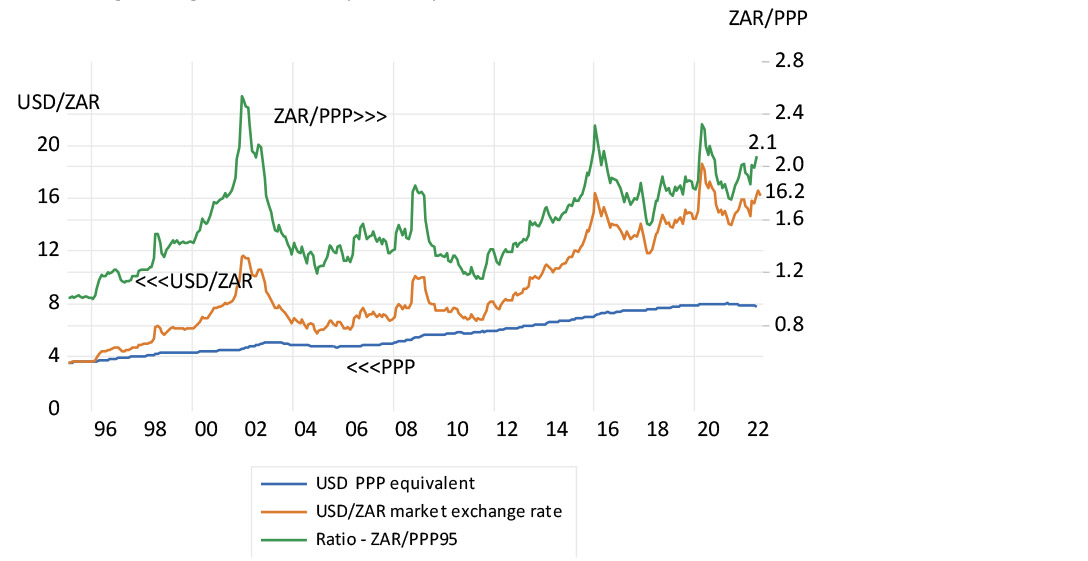
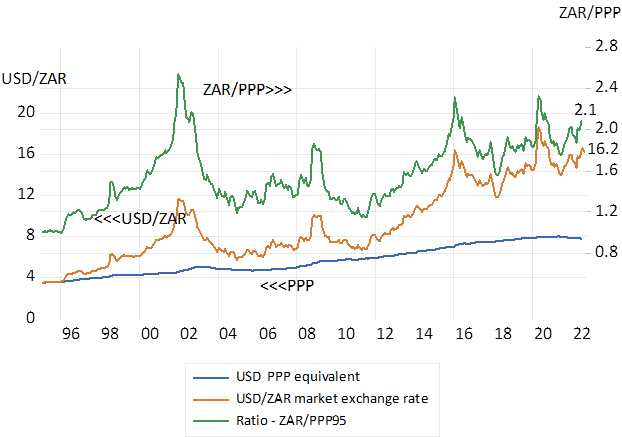
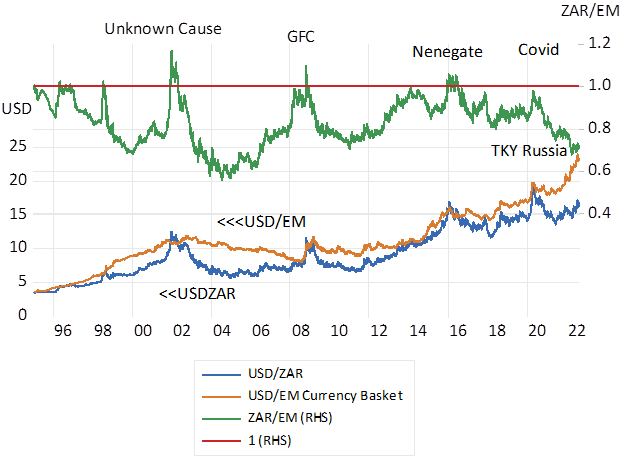
Rather a lender than a borrower is conventionally good news for balance sheets and credit ratings- – provided all else remains the same. Ideally raising capital even debt – to spend on capital goods with long productive lives that earn above the cost of debt- is good for any company or government and all its dependents. It means faster growth- and faster growth is the key to attract capital – especially equity capital – on favourable risk adjusted terms. Though the influence of removing one of the SA deficits, the capital account deficit – and improving the fiscal deficit, also with the help of the exporters, has not been conspicuous in the market for rands. The exchange rate of the ZAR with the USD, as for all other currencies, is being dominated by the dollar and the actions of the US Fed.
There is a dark side to South Africa’s lesser dependence on foreign capital. The reason the SA trade balance has improved as much as it has is because the rate at which South African’s have saved since Covid disrupted incomes and output has held up much better than the rate at which the economy has added to its capital stock. The ratio of Capital Expenditure to GDP has very worryingly continued to decline – from the 20% of GDP range before 2016 to the current 14% of GDP rate. The savings rate appears to have stabilized at the 14% rate.
These capital expenditure trends portend very poorly for the economy. They imply persistently slow growth that will continue to threaten the ability of the SA government to raise revenues to fund its ambitious welfare programmes. Slow growth adds to the risk of investing in SA and the cost of raising capital from all sources domestic and foreign. It means less capital expenditure and slower growth. Ideally South Africa should be raising its capital expenditure rate and funding more of it by attracting foreign capital on favourable terms, growing faster by reducing the risk premium with appropriate actions. Current account deficits and capital inflows to fund growth would then be very welcome.
The trade balance and the difference between savings and capital expenditure. Quarterly Data
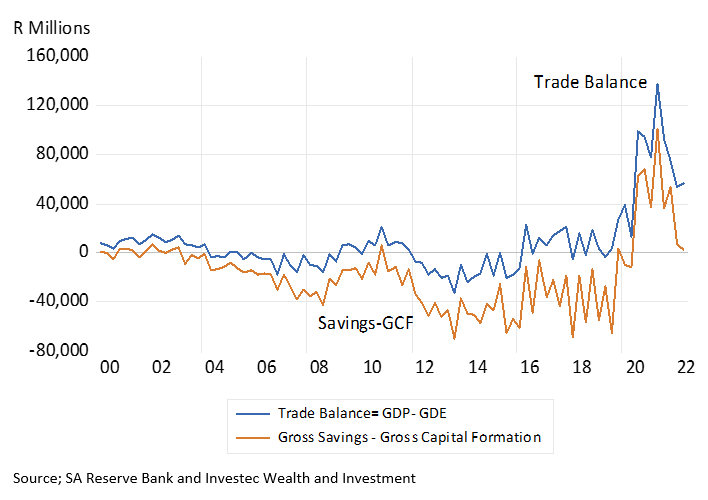
Source; SA Reserve Bank and Investec Wealth and Investment
Savings and Capital Expenditure. Ratio to GDP. Quarterly Data
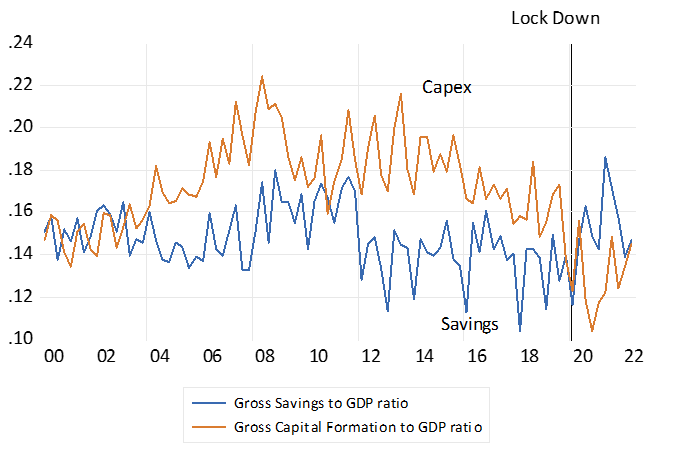
Source; SA Reserve Bank and Investec Wealth and Investment