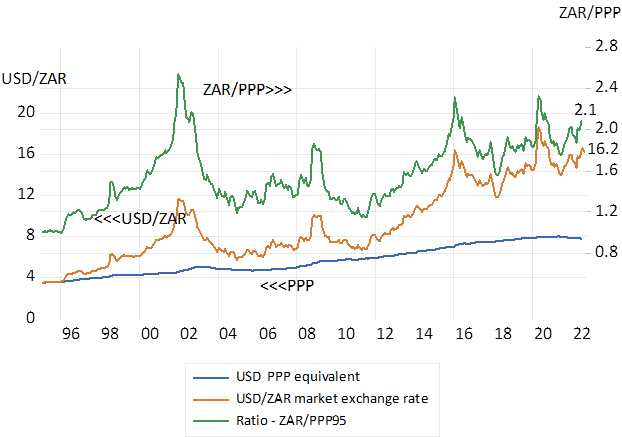
South Africans travelling abroad should not blame the rand for their lack of purchasing power- at least not lately. In mid-January 2016, a USD exchanged for 16.8 rands, the pound then cost R24. Observers of the gyrations of the foreign exchange value of the ZAR should know that the ZAR rate has had very little to do with differences in inflation between SA and its trading partners. The rand has consistently bought less abroad than at home.
The exchange value of the ZAR with the US dollar or UK pound has been weaker than its purchasing power parity (PPP) equivalent rate of exchange ever since 1995 when the capital market was opened up. Though with varying degrees of weakness. Had the rand simply followed the ratio of the SA CPI to the US or UK CPI since 1995 a USD would now cost a mere R8. Since 1995 the difference between SA and UK inflation has been an average 3.3% p.a. while the pound on average has cost an average 8.2% p.a. extra in rands since 1995.
Exchange rates with the US dollar. 1995-2022. Monthly Data
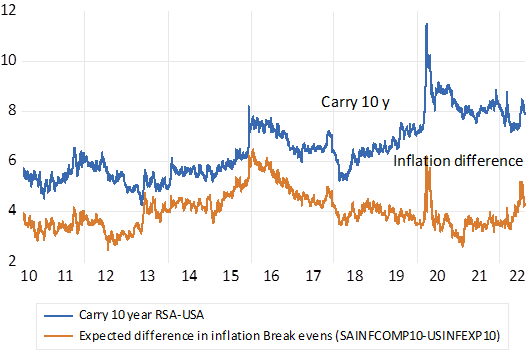
Yet it is not merely that the ZAR has depreciated by more than differences in inflation – it is expected to continue to weaken by more than the expected differences in inflation. The rand is expected to lose its dollar value by an average rate of 7.6% p.a. over the next 10 years and at an average 6% p.a. rate over the next five years. Known as the interest carry – these are the current differences between the market established rand yields on an RSA bond and the dollar yields on the US Treasury bonds of the same duration. While helpful to exporters and import replacers competing in the home and foreign markets – and to incoming tourists – this expectation of further consistent rand weakness has a damaging downside. It raises the cost of funding rand denominated debt, increasing the required return on securities that are expected to lose their dollar value at a rapid rate. Expected rand weakness sharply reduces the expected return from the RSA 10 year bond to under 3% p.a. (10.4 nominal yield less 7.6) Less than the same return in USD offered by a US Treasury.
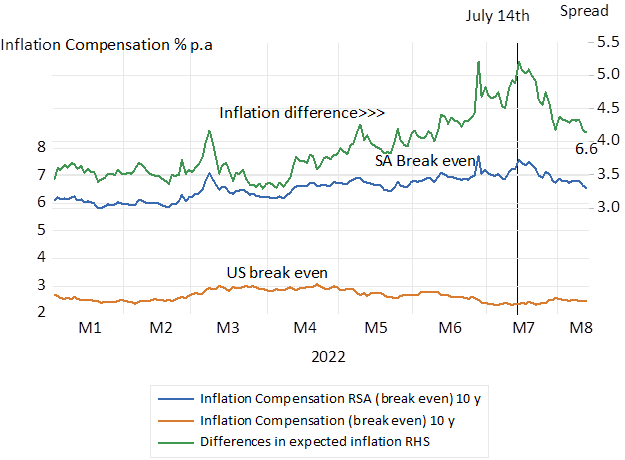
The expected rate of inflation can be accurately estimated or implied in the same bond markets. It can be measured as the difference between a vanilla government bond and an inflation protected alternative of the same duration. The compensation to investors in the US accepting inflation risk is an extra 2.65% p.a. for a five-year bond and 5.91% p.a. extra for rand investors in RSA’s. This difference in inflation expected of 3.2% p.a. is significantly less than the 6% rate at which the USD/ZAR is expected to weaken over the same five years. PPP does not only not hold- it is not expected to hold in the future. Sadly therefore even reducing inflation expected may not much improve the outlook for the ZAR- essential if the cost of raising foreign or domestic capital is to be reduced.
Inflation compensation in SA and US bond markets and differences in inflation expected
The interest carry (difference in nominal yields) and the difference in inflation expected. Daily data- 2010-2022.
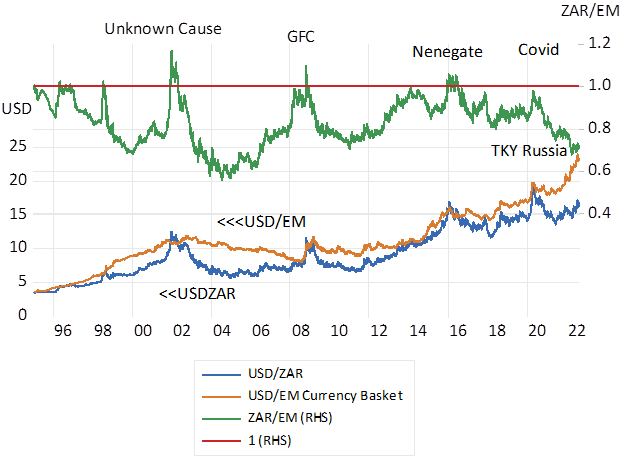
The full explanation for the exchange value of the ZAR is to be found not in PPP but much more in the varying flows of capital into or out of emerging markets generally and to or away from the dollar. SA specific risks move the ratio ZAR/EM about this long term one to one ratio. Both the ZAR and the other EM currencies respond very similarly to the same degrees of global risk tolerances that drives the USD stronger or weaker.
The task for South Africa hoping to promote capex and so economic growth by improving the outlook for the ZAR. It could do so by adopting policies that would make SA a superior emerging market attracting a much lower risk premium. SA’s impressive success in the highly competitive business of international rugby, provides the case study – to be emulated widely.
The exchange value of the ZAR compared to other EM currencies. Higher numbers indicate rand weakness. Daily Data 1995-2022