There is more to tax than what appears on the surface – ask National Treasury and South African homeowners.
National Treasury has had an epiphany. It has acknowledged that higher taxes can lead to slower growth and that lower taxes can lead to faster growth. Hence the decision to forgo R40bn of planned income tax increases and to propose a reduction in the corporate tax rate to 27%. All in the interests of faster growth. Hallelujah.
The Budget Review recognises that taxes have complicated feedback effects. It recognises that the burden of higher corporate taxes ends up being passed on to consumers of goods and services, in the form of higher prices and lower incomes for those who provide labour and other services to the corporation. The supply of capital to the SA enterprise and hence the supply of goods, services and the demand for labour and land, is determined by the required after-tax returns of investors. Higher taxes will reduce expected returns and so the supply of capital, goods, services and the demand for labour. The supply of capital for SA is sourced globally and the required returns are determined in the global market, as the Review recognises.
The Review could have added that personal income tax rates have supply side effects. It is the after-tax benefits provided to taxpayers by governments that establish the standard of living, which in turn determines the willingness to supply labour to an economy. The more internationally mobile the providers of labour services are, the more of a global market South African firms have to compete in for the supply of indispensable skills. Raising income tax rates at the margin drives the emigration of human capital and leads to higher prices to cover higher after-tax costs of inputs. Lower taxes could help do the opposite, that is increase supply of capital and skills. Faster growth becomes possible with a lower tax burden.
The share of income of those who will report taxable income of more than R1.5m in 2021-02 (a mere 113,192 taxpayers) are in the highest of nine tax brackets. They report 12% of all income and will pay over 26% of all personal income tax. Only when annual incomes are above R500,000 does the share of income taxes paid exceed the share of incomes earned. The numbers of high earners and taxpayers in SA have been stagnating. We need more of them to help grow the economy and provide for the relief of poverty.
It is the mix of taxes and the benefits supplied by governments that determines the standard of living and that drives the migration of labour and capital. The burden of income taxes in South Africa is highly progressive, as are the benefits of government spending. Higher income earners in South African pay much of the personal income tax and draw very little on government benefits provided.
Figure 1: Population by the nine income tax brackets (millions)
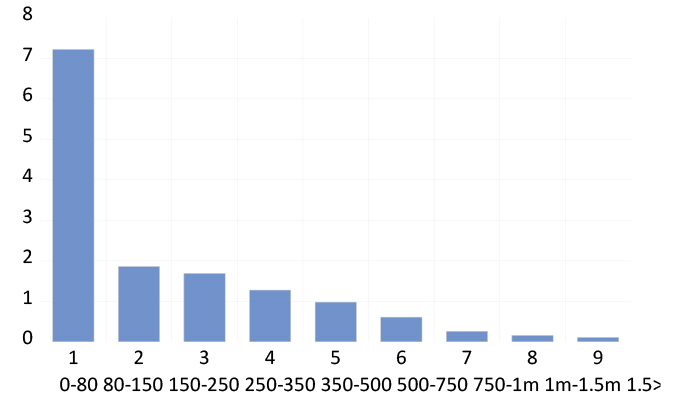
Source: Budget Review 2021-2020, Chapter 4 Table 4.5, Investec Wealth & Investment, 24/02/2021
Figure 2: Share of income and income tax paid of the nine income tax brackets (percent)
Source: Budget Review 2021-2020, Chapter 4 Table 4.5, Investec Wealth & Investment, 24/02/2021
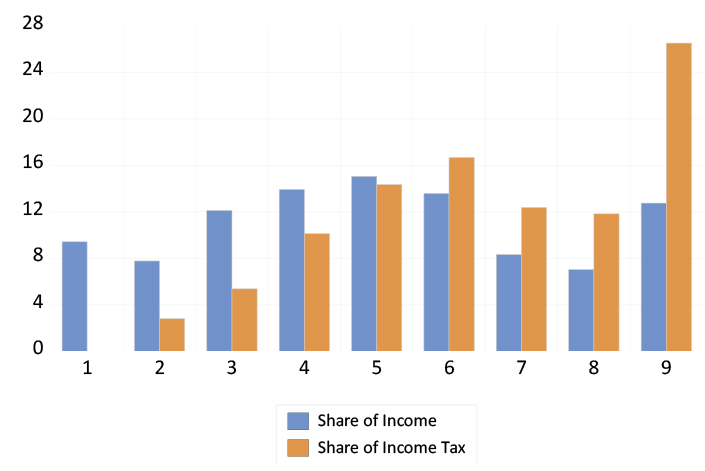
Figure 3: Average income tax saved (rand per annum) per member of each tax bracket (total income tax saving = R51bn)
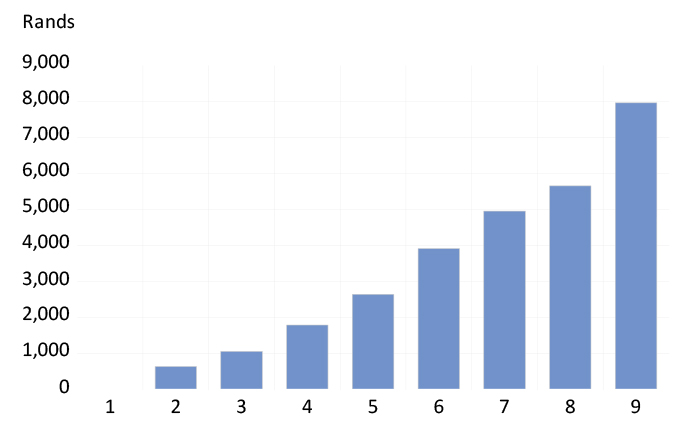
Source: Budget Review 2021-2020, Chapter 4 Table 4.5, Investec Wealth & Investment, 24/02/2021
For evidence of the relationship between taxes paid and benefits provided by government, one need only compare residential property prices in Cape Town with those in the other cities and towns. They can watch the business television channels, to be aware that magnificent homes in Johannesburg or Durban can be had for the price of a small two-bedroomed apartment in Cape Town. This is because of the more favourable mix of higher property taxes (not necessarily higher wealth tax rates) that are paid in return for comparatively good services provided by the local government.
Homeowners should be aware that higher taxes can more than pay for themselves when there is good government. And higher taxes will destroy their wealth when the service is inadequate for the taxes paid.