The inflation news has become out of date

Inflation in SA rose to 4.8in August- up from 4.6% in July 2017. However in August 2017 prices were largely unchanged, rising by a mere one tenth of one per cent in the month. The statistical anomaly is that a year ago Consumer Prices had actually fallen by about the same 0.1 per cent. And so a monthly increase in August this year of 0.1% was enough to raise the year in year increase in Consumer Prices by 0.2%.

Of further and greater importanc% e is that the Consumer Price Index has been largely stable since April 2017. In April prices increased by 0.1%, in May by a still minimal  0.3%, in June by 0.2% and in July by 0.3%. Helped by a consistently stronger rand compared to a year before, and stable food prices following the drought of last year, the direction of inflation has been decidedly lower. Thus as we show below the increase in prices, measured over consecutive three month periods, has declined sharply. Were such trends to continue headline inflation would fall to three per cent. A time series forecast indicates a much lower rate of inflation next year of about 3%.


Picture1
Figure 1: Inflation in South Africa and the underlying trends in consumer prices


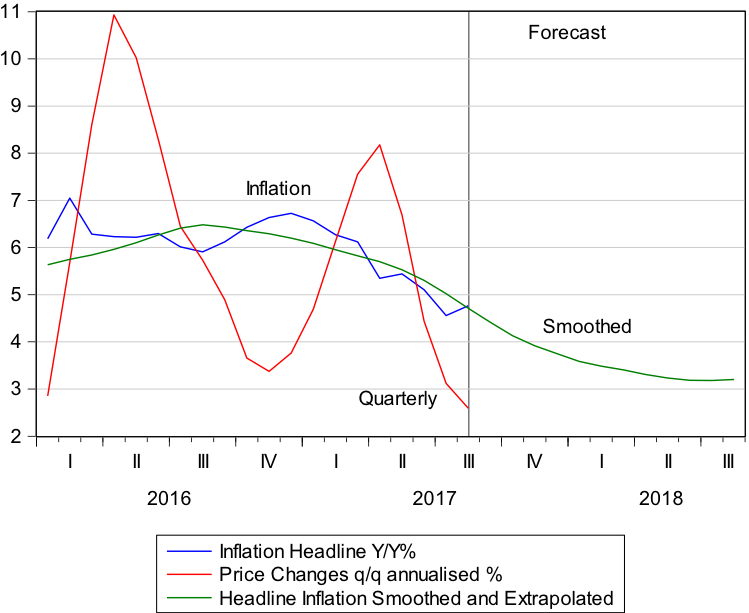
The Reserve Bank forecasting model of inflation, upon which it will determine its interest rate settings, is not a time series extrapolation of recent trends. It will have the trade weighted rand and food prices as amongst its more inputs. Chris Holdsworth of Investec Securities runs a simulation of the Reserve Bank model that suggest that the forecast rate of inflation for Q1 2018 will have declined marginally and would imply a further reduction in interest rates .[1] He remarks as follows

  • Since the last MPC meeting CPI inflation has dropped from 5.1% in June to 4.6% in July. The MPC’s previous forecast was for CPI inflation to average 4.8% for Q3. The slightly lower than expected print should marginally lower the MPC’s estimate of the inflation trajectory.
  • PPI has dropped from 4.8% in May to 3.7% in July. The fall in PPI inflation should further lower the inflation trajectory.
  • We don’t expect the MPC to make meaningful adjustments to its ZAR and oil price assumptions.
  • Subsequent to the last MPC meeting SA GDP growth for Q2 has come out at +2.5%, up from -0.6% in Q1. Given our understanding of the MPC’s macro-economic model, that should imply a small upward revision to the MPC’s growth assumption for the year (currently 0.5%). This should see a reduction in the expected output gap and an associated increase in the inflation trajectory but we expect the effect to be minimal.
  • The net result is that we expect a minor reduction to the SARB’s inflation trajectory over the medium term. We expect that the SARB will forecast inflation to reach 4.4% in Q1 next year.

A further reduction of 25 basis points in the repo rate therefore seems likely. Especially given the continued absence of any demand side pressures on prices. And so given to the near recession state of the economy. And were the stability of the rand to be maintained and a normal harvest delivered in 2018 the current underlying trends in consumer prices in SA  would be sustained and lead to further reductions in headline inflation and forecasts of it and be accompanied by still short term interest rates. Rates that could fall further and until very welcome strength in spending by households and firms becomes manifest. The conditions for a normal cyclical recovery are falling into place. One can only hope that political developments do not reverse the direction of the rand and the SA risks spreads that have also been receding. Presumably on the belief that better government is in prospect.

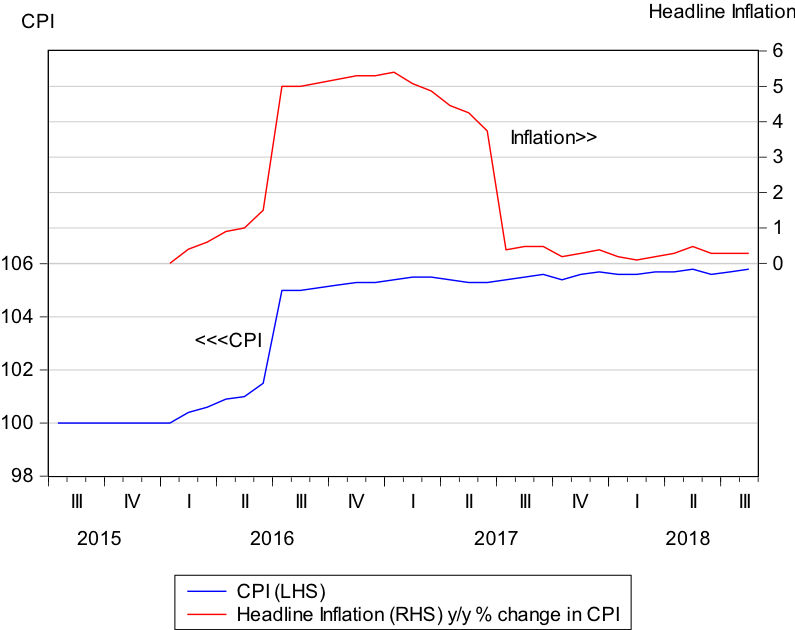
It is perhaps worth making an observation about inflation – measured as a year on year increase in prices and – and the advantage in identifying underlying trends in prices within a twelve month period that may be much lower. And portend lower headline inflation to come. The problem for inflation watches and commentators on it – and drawing implications for interest rates- is that 12 months is a long time in economic life. That much of importance can happen to prices or any monthly series within a year that makes year on year comparisons out of date. This is illustrated in a hypothetical example shown below. We show a case of a sharp increase in the price index after a period of stability and low inflation and how this may lead to more and then sharply lower inflation after twelve months.

In the figure below we show a sharp 5% increase in the CPI in early 2016. An increase in the VAT rate or a collapse in the ZAR might be responsible for such a sharp increase.  Thereafter prices are assumed to stabilise for an extended period of time. Perhaps this is because he exchange rate recovers somewhat and the VAT and other tax rates do not increase further. As we show inflation – measured as a year on year increase in prices – initially increases sharply to about 6% p.a and remains at these elevated levels for a full twelve months- where after it collapses back to about zero inflation.

Thus the impact on inflation of an inflation shock will be very temporary provided the underlying trend in prices is a very stable one. Presumably also inflationary expectations as well as models of inflation are fully capable of see through a temporary price shock.  One would hope that monetary policy settings can also see beyond temporary year on year changes in prices. As we hope the SA Reserve Bank is looking ahead rather than behind and will take the opportunity to help stimulate a recovery in spending that is desperately needed.


Figure 2: A hypothetical example of price shocks and underlying trends in prices


[1]

Forecasting the MPC’s forecasts; Quantitative Strategy, Investec Bank September 18th 2017


What the dollar means for the SA economy

The most important single indicator for the future direction of the SA economy is the value of the US dollar compared to the euro and other developed market currencies. When measured this way, and helpfully for SA and the emerging market world, we see that the US dollar has lost nearly 4% of its exchange value this quarter. Dollar weakness has brought a small degree of strength to emerging market (EM) currencies, including the rand, and to metal prices that make up the bulk of SA’s exports.

Dollar strength put pressure on the rand and EM exchange rates for much of the period between 2011 and mid-2016. This was when something of a turning point in dollar strength, weakness in metal prices (in US dollars) and rand and EM exchange rate weakness, was reached. Over this period, the US dollar gained as much as 30% against its peers, while the EM currency index lost about the same against the US dollar, while industrial metal prices and the trade weighted rand fell to about half their values of early 2011 in 2016. (See below)

The dollar has weakened and industrial metal prices have improved since 2016 because the rest of the industrial and emerging market world has begun to play catch up with the revival of the US economy. A stronger Europe and Japan imply more competitive interest rates and returns outside the US and hence less demand for dollars and more for the competing currencies and for metals.

The rand and dollar-denominated RSA bonds have benefited from these trends – despite it should be emphasised – less certainty about the future direction of SA politics and economic policy and a weaker rating accorded by the credit rating agencies. The rand exchange rate since lost more than 50% of its average trade weighted exchange value between 2011 and early 2016. The cost of insuring five-year US dollar-denominated RSA debt had soared to nearly 4% more than the return offered by a five year US Treasury Bond by early 2016. (See below)

Today this risk spread has declined to less than 1.8%, while the rand since early 2016 has gained about 15% on a trade weighted basis and 17% against the US dollar. This improvement has, as indicated, come with general dollar weakness and EM exchange rate strength. But it has also been strong despite the continued uncertainty about the direction of SA politics. The markets, if not the rating agencies, appear to be betting on a better set of policies to come.

It is to be hoped that the markets are right about this. The recent strength of the rand and metal prices offers monetary policy its opportunity to do what it can to help the economy – by aggressively reducing interest rates. Inflation has come down and will stay down if the rand maintains its improved value – and the harvests are normal ones – and the dollar remains where it is. Lower interest rates will lift spending, growth rates and government revenues.

Interest rates were raised after 2014 as the rand weakened and inflation picked up, influenced also by a drought that drove food prices higher. These higher interest rates and prices further depressed spending by South African households and firms and GDP growth. Consistently, interest rates could and should now be lowered because the rand has strengthened and the outlook for inflation accordingly has improved. Does it make good sense for interest rates in SA to take their cue from an exchange rate and other supply-side shocks that drive inflation higher or lower but over which interest rates or the Reserve Bank have no predictable influence? Their only predictable influence seems to be to further depress spending and growth rates. 15 September 2017

Reading the markets – a spring update

These are very good times for emerging market (EM) equities and currencies. The MSCI EM equity index continues to power ahead and has gained over 25% this year. This may be compared to a gain of about 10% for the S&P 500 and the average European equity. The JSE All Share Index has also had a good year and is up by about 16% in US dollars (see figure 1).

A degree of perspective on these recently favourable equity trends is called for. As we show in figure 2 this EM outperformance has come after years of underperformance between 2011 and 2016, as is shown in figure 2. The EM comeback is still very much a partial one that dates from the first quarter of last year. Perhaps some encouragement can be taken from this perspective.

The EM equity comeback (measured in US dollars) can be attributed partly to a weaker US dollar and stronger EM exchange rates. In figure 3 below, we compare the performance of the US dollar vs other developed market exchange rates – mostly vs the euro. The US dollar has weakened significantly since January 2017, by about 8% according to the trade weighted (DXY) index, while the index of EM currencies vs the US dollar has shown a similar degree of strength. The EM Currency Index calculated by JP Morgan (JPMEMX) includes a small weight in the rand. The rand/US dollar exchange rate has performed in line with the average EM exchange rate. Note higher numbers in these figures indicate a more favourabe rate of exchange.

This strongly negative correlation between US dollar weakness vs its peers and EM currency strength vs the US dollar is of long standing, as we show in figure 4 below. The correlation coefficient is of the order of a negative (-0.83) using daily data.

Thus much of the recent strength in EM currencies, including the rand, reflects US dollar weakness vs its peers. As we will demonstrate further below, the recent strength of the rand is much more a tale of the US economy vs its developed market peers than of political and economic developments in SA. The rand has performed very much in line with its own EM peers against the USD,

EM economies and their equity and currency markets have clearly benefitted from a recovery in metal and commodity prices that are dependent on global demands. The global economy has grown faster and in a highly synchronised way in recent months. This news about the state of the global economy has become more encouraging for metal producers. The underperformance of EM currencies and equities since 2011 and their recent recovery is closely associated with the recovery in metal prices, as we show in figure 5 below. Metal prices bottomed out in mid-2016 and have enjoyed a strong move higher since mid-2017, as we show in figure 6.

As with the recovery in EM equity markets, the recovery in metal prices should also be understood as a still partial recovery from the heights of the super-cycle and one that has come after an extended period of lower prices.

The strength in the rand and in metal prices bodes well for the SA economy. It implies more valuable exports and more importantly raises the prospects of lower interest rates – essential if the economy is to enjoy something of a cyclical recovery. The market place appears to have recognised some of the better news about the global economy. The RSA sovereign risk spreads have receded, as we show in figures 8 and 9. The yield on RSA five year dollar denominated debt has fallen sharply from the yields and spreads demanded when President Zuma first intervened in the SA Treasury in December 2015. The cost of issuing RSA dollar-denominated debt has fallen significantly, despite the downgrading of the debt rating agencies.

What has not changed much in recent months has been the spread between rand-denominated RSA bond yields and their US equivalents. For 10 year bonds, the yield spread remains well over 6% p.a. indicating that the rand, despite its recent strength, is still expected to lose its USD exchange value at an average rate of more than 6%. Consistent with this view of persistent rand weakness, is that inflation compensation in the bond market, calculated as the difference between a 10 year vanilla bond yield and its inflation protected equivalent, also remains well above 6%. Inflation expectations or the outlook for the rand have not (yet) responded to the strength of the rand. 5 September 2017


The Naspers logic – getting our Tencent’s worth

The recent Naspers annual general meeting saw shareholders at serious odds with management about the value of their contribution to the company.

Amidst all the Sturm und Drang and misconceptions about how to measure the performance of the Naspers managers, some facts of the matter deserve proper recognition. Chief among these is that is Naspers managers are expected – emphasis on expected – to destroy shareholders’ value on an heroic (or is it a tragic?) scale.

To explain, were Naspers simply a clone of Tencent, that is the company did nothing but collect and distribute to shareholders the dividends it received for its 34.33% share of Tencent, it would be currently valued as is Tencent itself. Currently it would be worth close to R1.6 trillion. The current market value of NPN is much less than this, about R1.3 trillion, or a staggering near R300bn less than the value of its stake in Tencent.

The correct logical conclusion to come to about this fact is that the market expects the Naspers managers to destroy value on their behalf. In other words, the ambitious capital investment programme of Naspers is currently worth much less (on a net present value basis) than the capital NPN management is expected to deploy over the economic life of the company. To be more precise: worth some R300bn less than it is expected to cost. Why not liquidate all those investments and return the money to shareholders, which would surely close the gap?

Unfortunately for Naspers management, the market has recently become more pessimistic about the capabilities of the Naspers managers. In January 2017, the expected destruction of value was a mere R98bn compared to the current R300bn. It may be concluded that the better Tencent performs, and so adds to the balance sheet strength of Naspers, the more ambition and so the more value destruction the market expects from Naspers. (See chart below)

Independently of the success Tencent has enjoyed in the market place, in which Naspers shareholders share to only a lesser degree, given more value destruction expected, the recent operating performance of the Naspers subsidiaries gives very little cause for believing that their fortunes are about to turn around for the better. We rely here on the Credit Suisse HOLT lens for these observations. Naspers’s cash flow return on investment (CFROI) on its operating assets dropped from -3.6% in 2016 to -10% in 2017. In other words, the operating core of Naspers is destroying value by generating a return on capital far below its opportunity cost of capital. This is nothing new. CFROI has been dropping since March 2011.

The expense missing from every income statement is a charge for the use of shareholders’ equity. Equity is not free and no rational investor wants to give it away for nothing. If we apply a capital charge on the use of Naspers operating assets, its economic profit drops from -R6.2bn in 2016 to -R11bn in 2017. Consistent with these negative returns is that the growth in the sales of these operating subsidiaries has turned negative and the operating margins (expressed as an EBITDA percentage), which were well over 20% between 2004 and 2010, are now barely positive. In 2015 and 2016, the growth in Naspers assets, which includes cash but excludes Tencent and other associate investments, has been at an ambitious rate of over 40% p.a.

Capture

Naspers managers and its shareholders clearly have a very different view of its prospects. Time will tell who has the more accurate view of the capabilities of Naspers management. One would recommend however that the Naspers management put a time limit on their ability to prove the market wrong. If the market in five years continues to value Naspers as a serial value destroyer, its managers should be willing to cut its losses, by radically reducing its investment spending and to unbundle or dispose of its loss making subsidiaries. Any expectation that Naspers is willing to adopt a much more disciplined approach to its capital allocation would add immediate value for its shareholders. 1 September 2017