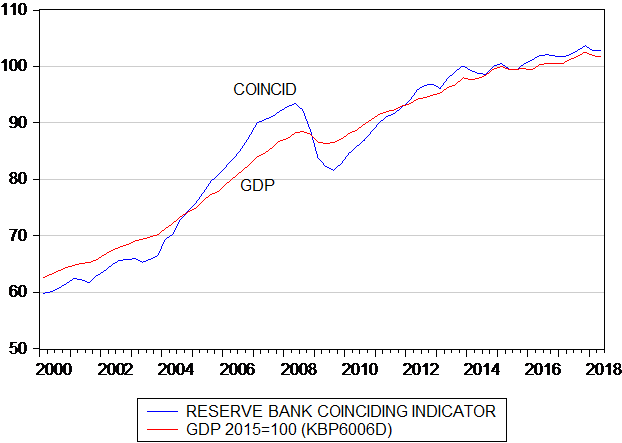
When our newly minted Minister of Finance, Tito Mboweni, presents his update on the finances of the state later this month he will little alternative but to look through the rear view mirror. Total output and incomes (GDP) and the balance of payments – crucial information for the budget – will have been estimated only up to June 2018 and will be revised. The coinciding business cycle, which is a good proxy for GDP, calculated and published on a monthly basis by the SA Reserve Bank (SARB) is as out of date as the GDP.
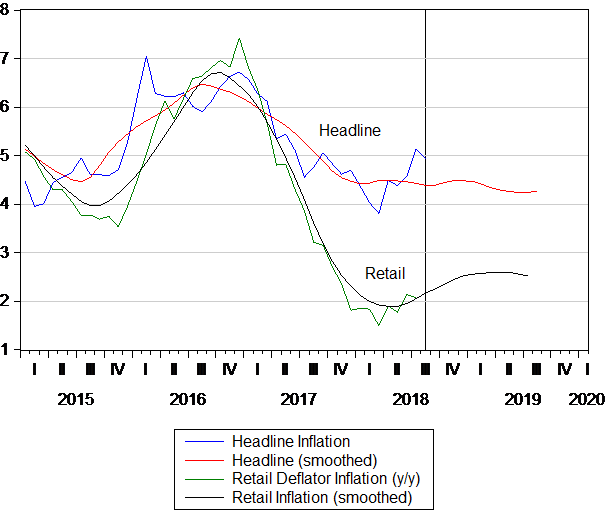
The CPI for September will also be released on the 24th October. He must hope that the misanthropes at his old Reserve Bank do not regard possibly higher inflation, in the wake of the weaker rand and the higher petrol price, very obvious negative supply side shocks to economic growth, as reason to hike interest rates. That would further depress growth in spending and GDP and tax collections without altering the path of inflation in any predictable way.
Mr.Mboweni can take consolation from the market reaction to his appointment. The rand immediately strengthened on the news – not only against the US dollar – but by a per cent or two against the currencies of our emerging market peers. Alas global economic developments a day after his appointment later – pessimism about global and especially emerging market economic prospects- weakened the rand against the US dollar and undid the good news.
A stronger rand can clearly reduce inflation and, if it is sustained, reduce the compensation for inflation, and accompanying expected rand weakness, priced into the high interest rates the RSA has to pay. Inflation expected is of the stubborn order of about six per cent per annum.
Our new Minister will hopefully recognize that raising tax rates to close the gap between government expenditure and revenue is a large part of the problem of, rather than the solution to South Africa’s stagnation. Perhaps he will report progress being made in private-public partnerships, (alias privatization) in taking assets and liabilities (actual and contingent) and interest payments off the Budget- now running at over 11% of all government expenditure and likely to increase further.
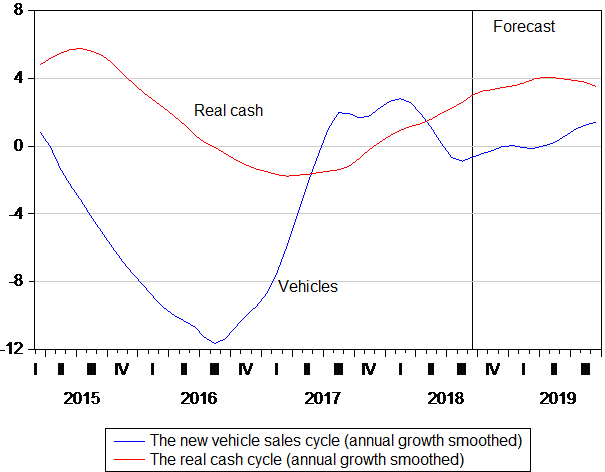
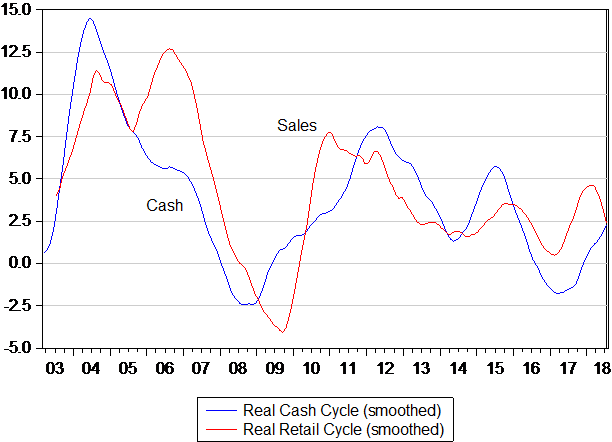
I can offer the Minister a little consolation derived from some very up to date indicators of the current (September 2018) state of the economy. That is from new vehicle sales in South Africa and the supply of cash issued by the Reserve Bank in September 2018. These are actual hard numbers and do not depend on sample surveys that take time to collect and collate. These two hard numbers are combined to provide a Hard Number Indicator (HNI) of the state of the economy. It does a very good job anticipating the turning points in the SA business cycle. (see figure 1 below)
Fig. 1; The Investec Hard Number Indicator (to September 2018) and the Reserve Bank Coinciding Business Cycle Indicator (to June 2018) (2015=100)
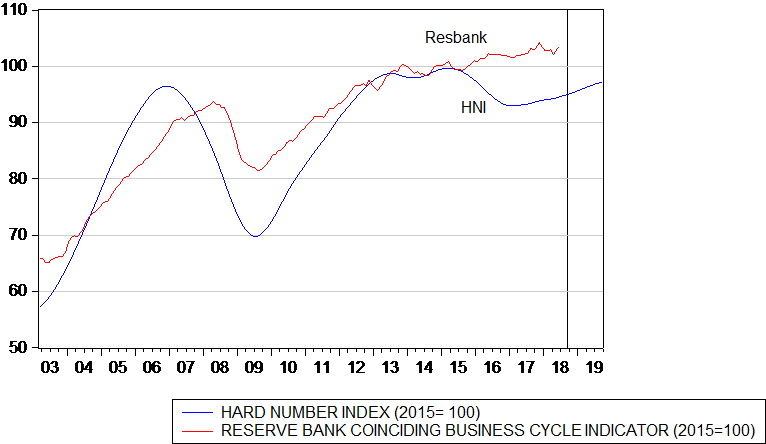
Source; Stats SA, SA Reserve Bank, Naamsa and Investec Wealth and Investment
If current trends in new vehicle sales and the demand and supply of cash persist, the HNI is pointing to positive real GDP growth of what would be a very surprising possibly 3%, over the next twelve months.
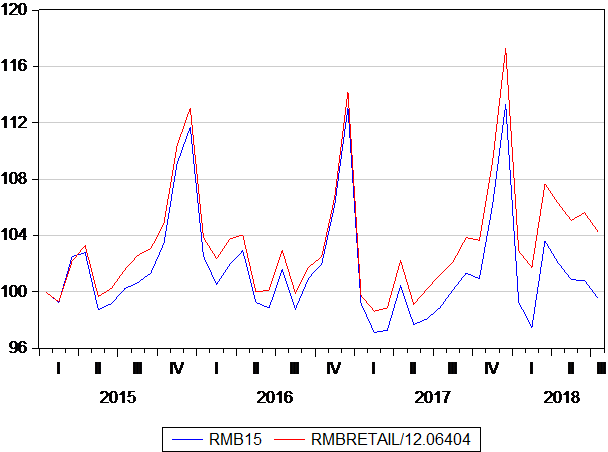
Fig.2; Growth in the Hard Number Indicator and the Reserve Bank Business Cycle Indicator
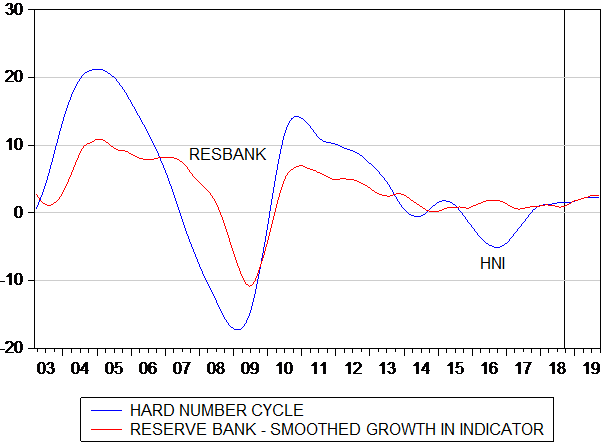
Source; Stats SA, SA Reserve Bank, Naamsa and Investec Wealth and Investment
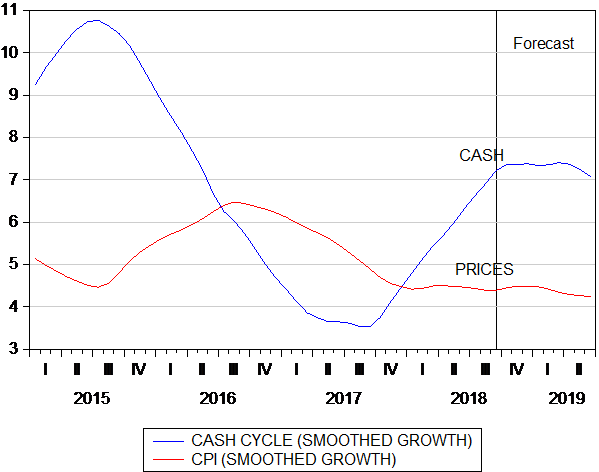
Current sales of new vehicles are running at an annual rate of 551,000 new units sold, forecast to rise modestly to an annual equivalent of 570,000 units in twelve months. The demand for cash is however suggesting more impetus for growth. It is recovering quite strongly and is expected to grow at a 7% rate in 2019 and when adjusted for consumer prices to rise to at a near 4% real rate in 2019. (see figure 3 below
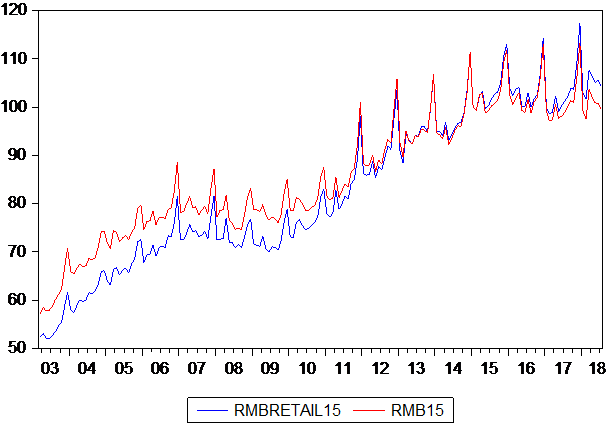
Fig.3; The components of the Hard Number Indicator. Smoothed annual growth rates

Source; Stats SA, SA Reserve Bank, Naamsa and Investec Wealth and Investment
What moreover does this growing demand for old fashioned notes and coin say about the SA economy given all the electronic alternatives to cash? It suggests that much economic activity is not being recorded in GDP. Raising the contribution made by the unrecorded economy to the GDP is long overdue. It would improve all the critical ratios by which our economy is judged.
We economy watchers and the Treasury must hope that this growth in the demand for and supply of cash– so indicative of spending growth – continues to run ahead of inflation.