On Eskom: act soon or it will be too late to get back our investment

One offers commentary on matters of broad SA national interest that might helpfully respond to and benefit from the analysis and arguments raised. It is a tradition that – perish the thought – goes back to colonial times.

The notion that a concern for economic efficiency and economic development in the interests of society at large will prevail in the policy choices SA makes and the economic direction we take, has alas, become increasingly suspect. No other set of policies will be as important for the ability of our economy to raise future incomes, output and employment and to compete globally as taking the right path for delivering energy. Yet following the tempting money trail open to a few potential beneficiaries of energy procurement as currently practiced is much more likely to predict the future of energy production and consumption in SA than any objective analysis can do. But however objective such analysis could be it is still very unlikely to make the right choices- given the unpredictability of the future of energy. The best the government of SA and its agencies – Eskom and the municipalities that have monopoly powers over the generation and distribution of electricity in SA – could do for SA, would be to get completely get out of the business as soon as possible and on the best possible terms. Terms that are very likely to deteriorate the longer they delay their exit.

The reason for getting out and handing over the responsibilities to the fullest possible set of competing privately owned generators and distributors is that the future of energy is impossible to predict with any degree of confidence. Therefore the decisions to be taken in this regard by a government monopoly (with its narrow interest as a monopoly even an honest monopoly) are almost certain to be the wrong ones from which the society and economy will suffer permanent damage.

The most efficient, lowest cost methods of delivering energy in the future cannot be known. It will be discovered in the market place as all such discoveries are made. Discovered, as will be the case with every product and service to be delivered over the next thirty years, by trial and error in the market place, by constant experimentation by owners and managers with their open capital at risk where winners may be rewarded handsomely and losers punished severely with the loss of their capital. It may well turn out to be a future where the cheapest energy is delivered off-grid, making large capital intensive generating plants generating electricity with coal, uranium or gas redundant in time – but just how much time?

Permitting and encouraging such a market place in energy to fund the future demands for electricity on competitive terms , is the right path for SA to take. Adding further highly capital-consuming power plants using whatever kind of input, is surely a most dangerous step for the SA tax base or electricity consumers to have to support. Such plants supported by monopoly powers as were granted their developer Eskom fifty years ago, were arguably then the right way forward. They delivered satisfactory outcomes until recently, in the form of what were globally competitive electricity prices. But they are surely not the way forward today given the risks that technology poses and especially since Eskom itself has become close to bottom of its class of electric utilities on efficiency criteria – as judged by a recent study commissioned by the Intensive Electricity Users Group in SA – who have much at stake.

Eskom has proved very good (predictably so given its monopoly) only at providing employment and generous employment benefits as well as it would appear generous terms to its suppliers – at the expense of its users – who could have proved much better at delivering employment, profits and taxes (with lower electricity costs) including benefits of energy intensive beneficiation of metals and minerals.

There is little time to be lost if the SA tax payer is to recover its investment in and debt guarantees provided for Eskom given the uncertain future. If the plant and equipment were to be privatised soon, they might well fetch a price that would pay off the debts and avoid subsequent white elephants. And help open up, perhaps only gradually, a competitive market for electricity where different owners of generating capacity could compete for customers through the privately owned grid, treated perhaps as a regulated private utility.

The plants Eskom is now mothballing could attract bids and be kept running at a low enough asking price. And help produce electricity at highly competitive prices, enough to cover operating costs and a return on capital, that could perhaps, for a while, keep alternative electricity generators at bay, long enough for SA to get its money back.

*The views expressed in this column are those of the author and may not necessarily represent those of Investec Wealth & Investment


Stock market indices: Swix in the mix

The very large weighting of Naspers in leading indices like the JSE Swix and the JSE All Share Index has major implications for active and passive investors alike. Investors need to be aware of what this means for the risk attached to their portfolios.

 The original reason for constructing a stock exchange index was simple: to provide a statistic that summarised the price performance of the average company listed on a widely followed stock exchange. The calculation of such an average or index is supposed to represent the general direction of the equity market.

The most famous and oldest of the indices that tracks share prices on the New York Stock Exchange, the Dow Jones Industrial Average (DJIA), simply aggregates the US dollar share prices of the 30 largest US companies. The higher the prices of the individual shares included, the higher the DJIA and vice versa. The S&P 500 was introduced later and has become the most important of the global indices. In contrast with the DJIA, the S&P 500 tracks the market value of the 500 largest companies listed on the New York stock exchanges. The share price moves of the largest companies carry the most weight in the index and move the index proportionately.

Indices that attempt to summarise equity market performance, however, have much more than simply an informative role. They are also widely used to measure the ability of fund managers who actively manage their share portfolios and compete with other managers for assets to manage. Relative, as well as absolute price performance and returns, matter to both fund managers and their clients.

The performance (total returns in the form of price changes plus dividend income) of the funds they manage are not only compared to those of their rivals, but also to some relevant equity index. The ability to generate returns ahead of the benchmarks – the returns (theoretically) generated by the index (positive or negative) – becomes their measure of success or failure. Conventional wisdom now dictates that index-beating returns, beating the market (after fees), is the only reason for active management. We will show why this is incorrect.


A passive approach


Because of the difficulty that the average equity fund manager faces in trying to perform better than the index, there has been a large move to so-called passive equity investment strategies. Investors simply track some index by dividing their equity portfolios in exactly the same proportions (weights) as the shares included in the index.

Index tracking funds (under the banner of the so-called exchange traded funds or ETFs) have been created in large numbers by different fund management houses to facilitate such an investment strategy. This process generates no more or less than index-equivalent returns for the investor. The advantage for the investor is that since no knowledge or experience of the market place is needed – only a suitably programmed computer – the fees charged for the service (usually measured as a percentage of the assets under management) can be far lower than the fees typically paid for actively managed portfolios. These latter fees are charged to cover the higher costs of active managers, for example the salaries of the stock pickers and their analysts, as well as the trading and marketing costs incurred by the firms.

The ETFs and their originators and managers are therefore taking full advantage of highly efficient and competitive equity markets, without contributing to the process of price discovery. It is this efficiency in processing information about companies and the economic and political forces that will influence their future profitability (and their current value) that makes the share market so difficult to beat. Such information comes without expense for the passive investor.

Another expensive responsibility incurred by active shareholders is the surveillance of the managers of the companies in which they invest client wealth. This responsibility and the accompanying costs are largely avoided by passive investors.  Good corporate governance demands that shareholders cast their votes on corporate actions by exercising proper diligence, which has a cost. Engaging actively with company managers is essential for active investors but not for index trackers.

The index trackers are free riders on the investment bus, paid for by others. The proportion of funds that would have to be actively managed to make for a well-informed, efficient marketplace and to keep the investment bus rolling cannot be known with any degree of certainty. If all investors simply followed rather than led, the market would be full of valuation anomalies, from which only a few active investors could become fabulously wealthy by exploiting the valuation gaps.


The relevance of risk

Prospects like these are what encourage active investors to take risks. Think of hedge fund managers who take large risks in exchange for prospectively (not always realised) large returns. They also add helpful liquidity to the market that facilitates trading activity by risk averse investors. It is the expected distribution of returns, the small chances of a big win on the markets and the potential to achieve long run returns sustained well above average market returns that explains some of the preference for active managers. A select few of these (though we never know which few) will always beat the market by a large and sustainable margin.

This raises an all-important issue. Investment decisions and the make-up of investment portfolios are not determined only by prospective returns. The risk attached to such prospective returns is at least as relevant for the average wealth owner saving for retirement or a rainy day. This is the risk that the portfolio can lose as well as gain value. Stock market indices and the ETFs that track them can be more or less risky, depending on their character and composition. An essential requirement of a low-risk equity portfolio, actively or passively managed, is that it should be well diversified against risks that individual companies are exposed to.

This is achieved by spreading the portfolio among a large number of shares, none of which should account for a large proportion of the portfolio. The threats to the value of a share of a company that comes from adverse circumstances beyond the control of all company managers – i.e war, revolution, taxation, expropriation, regulation, inflation and financial crises – can only be mitigated by diversifying the wealth owners’ total portfolio across different asset classes, such as bonds, cash or real assets – or different jurisdictions. Index-tracking ETFs can simulate a particular equity market or well traded sector of it. But designing an optimal, risk-aware total portfolio – how much equity or other risks a wealth owner should assume – calls for more complicated considerations.

An important consideration for any investor tracking some equity market index is the issue of how well diversified the index being tracked is. A further consideration is which equity markets should be tracked given their very different risk profiles and how they are constructed.

The S&P 500 is very clearly well diversified against US company specific risks. The JSE All Share Index, by contrast, is not well diversified, nor is the JSE Top 40 Index nor the JSE Shareholder Weighted Index (Swix), which has largely superseded the other JSE indices as the benchmark for measuring the performance of SA equity managers. The Swix is weighted by the shares of the company registered by the JSE itself, as opposed to shares registered for transfer on other exchanges where the company may also have a primary or secondary listing. The larger the value of the shares registered by the JSE (Strate), the larger the weight that company will be allocated in the Swix. It should be understood as a measure of the proportion of the shares registered for transfer in SA, not necessarily of the share of the company owned by South Africans.


How diversified is your index?

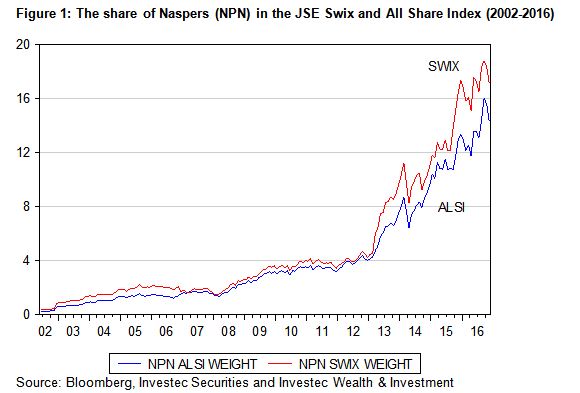
The largest company currently included in the S&P 500 Index is Apple, with an S&P 500 Index weighting of only about 3%. The largest 100 of the S&P 500 account for about 60% of the index. In strong contrast, the largest company included in the market capitalisation-weighted JSE All Share Index in November 2016 was Naspers, with a weight of 17.14% in the Index. The next largest company included was British American Tobacco, with a much smaller weight of 4.31% followed by Sasol with 4.08%. The largest 10 companies included in the All Share Index now account for as much as 42.6% of its weighting – it’s clearly a much less diversified index than the S&P 500. Until its recent takeover, SABMiller was accorded a large weight in the All Share Index and the other leading indices. It is no longer represented and its new owner, AB Inbev, while already listed on the JSE, at the time of writing had still to make an appearance in the indices. The weights in the Swix have become similarly lopsided as we show below in figure 1. The weight of Naspers in the Swix is now even larger than that accorded to it in the All Share Index.

daily1


The weight of Naspers in the JSE indices has risen automatically with the extraordinary and persistent increases in its share price. Naspers shares are also all registered on the JSE, though foreign investors hold a large proportion of the company. As important for increasing the weight of Naspers in the indices has been the near stagnant value of resource companies that once had a very large weight on the JSE, but whose valuations have increased very little over the same period.


From mining to media

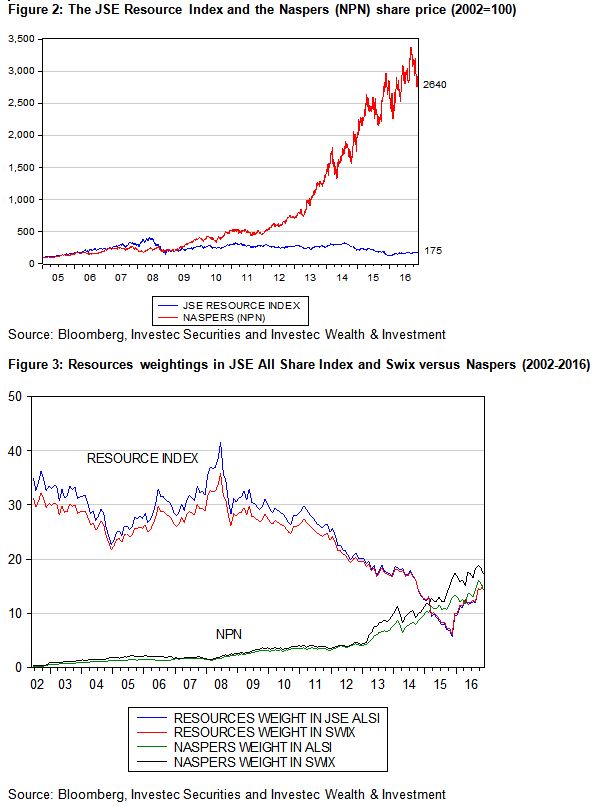
In figure 2 we compare the Naspers share price with that of the JSE Resources Index. The Naspers share price has increased 26.4 times since June 2002 while the JSE Resources Index has not even doubled over the same period. In figure 3 we show consequently how the weight of resources in the JSE All Share Index has declined from over 40% in 2008 to about 15% today, a lower weighting than Naspers on its own. The Swix reveals a very similar pattern, according a very high weight and importance to the Naspers share price moves and much less importance to resource companies in the direction the index takes (and so any ETF that tracks the JSE All Share Index or Swix).


daily2


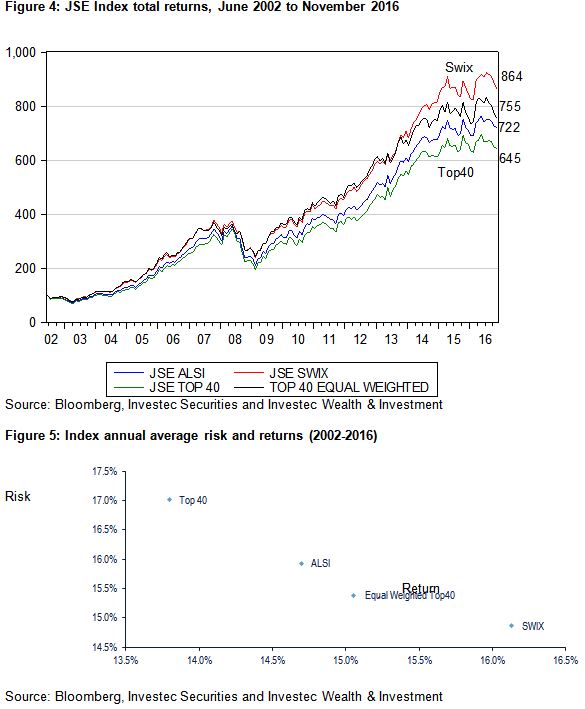
It is the rising Naspers share price and its growing and larger weight in the Swix that has made the latter the best performing of the local indices over the past 14 years. The differences in performance are significant. R100 invested in the Swix in 2002 with dividends reinvested (before fees and taxes) would have grown to R864 by November 2016. The same investment in the JSE Top 40 would only have realised R645, with the All Share Index and an equally weighted index of the 40 top companies performing somewhat better. Not only did the Swix deliver higher returns, but it did so with less volatility than the other indices, thanks to Naspers (see figures 4 and 5 below).

Clearly, choosing the right index to represent and track the JSE and measure the performance of active managers is an important decision for investors or their advisers to make. All indices are not alike and some can be expected to deliver returns with much greater risk or volatility than others.

The major JSE indices that might be used to deliver market equivalent returns by some tracker fund or others are not suitable for diversifying the specific company or sector risks that investors tracking the index will be exposed to. Naspers carries far too much weight and therefore exposes index-tracking investors to much more danger than would be appropriate for any risk averse portfolio. The same criticism could have been made of the composition of the JSE indices in 2008: they were too exposed to the specific risks that faced resource companies. Investing over 40% of an equity portfolio in resource stocks – with their well known dependence on highly unpredictable metal prices – is not something a risk averse investor would want. The same argument could be made of a current exposure to Naspers: investing up to 20% of a portfolio in one company would be regarded as highly unwise.

Wise and risk averse active managers presumably would not have allocated 40% of their portfolios to resource companies in 2008. And, they would have been much more likely to have outperformed the indices over the subsequent eight to nine years as resource valuations fell away. They would also have done even better with a larger-than-index weight in Naspers. But the risk conscious fund manager would have had to become ever more cautious about exposure to Naspers after 2013, when its weight in the index began to exceed 10%. Prudence would suggest that no more than 10% of any equity portfolio should be invested in any one company.

Given this, along with the current 18% plus weight of Naspers in the leading SA indices, active managers are therefore much more likely to underperform the index when Naspers is outpacing other stocks, as has been the case until recently. Conversely, they would outperform should Naspers lag behind the other stocks included in the index. The case for or against active management in SA should not have to depend on the fortunes of one company.

Judging the performance of a fund manager in South Africa by reference to a very poorly diversified Index like the JSE All Share Index or Swix would not be an appropriate exercise. Realised returns should always be compared to the risks that were taken to achieve those returns. The task of the active manager is not simply to aim at the highest returns for their clients, they should also be managing risk.

Recognising the risk tolerance of their clients and allocating assets and planning savings accordingly is a large part of a fund manager’s duties. This is even more important when the market (index) carries identifiable and unjustifiable risk as the JSE indices have done and continue to do. Even when the active investor has not beaten the market, the advice offered can be very valuable.

There is incidentally no risk when calculating past performance. Risks apply only to expected performance – not to known past performance. Investing in an index tracker is not a decision that can be made passively because such advice is not easily provided by a robot and is worth paying extra for, or ignored at the investor’s peril.


daily3

Note: I am indebted to Chris Holdsworth of Investec Securities who painstakingly undertook all the Index and return calculations that are used and represented in this report. All the indices used in the study are dynamic ones representing the indices and the sector and share weights in them, as they occurred over time.


The curious case of Curro

To reward shareholders you have to over deliver- executing well is not enough

When the CEO of a highly successful JSE-listed business aims to “reward shareholders” with a maiden dividend, as Curro CEO Chris van der Merwe has recently promised, one takes notice (Business Day 1 March 2017), particularly because the company is undertaking an impressive programme of investing in new private schools (now 128 of them) with room for the company to grow further and faster. Its plan is to open seven new campuses a year, housing 15 to 18 new schools, intended to take the company to 80 campuses and 200 schools by 2020 and to increase its enrolment from the current 47 000 to 80 000. A longer term potential market for as many as 500 fee paying schools in SA has been suggested.

The 2016 financial year was an extraordinarily good and busy one for Curro. It raised an additional R1.75bn in equity capital to fund about the same amount of capital expenditure. Since 2013 Curro has been investing over R1bn a year in expanding the business. But the growth in the operating lines in 2016 were equally impressive, so helping to maintain a superb track record in executing its business plan. Profits after tax (which was minimal thanks to large depreciation allowances) have grown from R40m in 2013 to R168m in 2016 while the growth in cash generated from operations (helped by the same heavy depreciation and amortisation) has been even more impressive, from R106m to R404m in 2016. These were excellent improvements in organically generated cash flows, but not enough to fund the large current capital expenditure programme.

Why then pay out cash to shareholders rather than continue to reinvest in additional assets? These assets appear to be able to return more than would ordinarily be required by shareholders from other investments with similar risks. Is the value added for Curro shareholders in the form of returns on their capital that are well in excess of the (opportunity) cost of such capital, not reward enough to encourage retaining cash on behalf of shareholders rather than paying it out?

After all the rewards for shareholders come in the form of total returns: capital appreciation plus dividends. And as Warren Buffett has long demonstrated, paying dividends is by no means essential for generating high total returns, indeed dividends may reduce them if paying out cash constrains the scale of value-adding investment programmes that shareholders would have great difficulty in finding for themselves.

The problem however for Curro and its shareholders and managers is that, despite its considerable operational achievements and well executed growth plans, the company has not in reality rewarded shareholders since late 2015. It was then that the value of Curro shares reached a peak of over R52 but are now trading below R48. As may be seen in the figure below, Curro shares performed spectacularly well between 2011, when they traded at R8.92 and its peak of R52.65 in December 2015, equivalent to an annual average compound return of about 42%.


Curro has run into a problem faced by many well-managed companies. That is investors come, understandably, to expect excellent operating results and re-value the company and its management accordingly. They expect more and therefore prove willing to pay up more in advance to own a share of the much appreciated company and its management.

Hence it becomes ever harder for the company to perform well for shareholders given the much more demanding starting values. Unusual share price appreciation (best measured relative to the market as a whole) of the Curro kind, realised until year-end 2015, comes with surprisingly good outcomes, not just good outcomes. Surprisingly poor performance is as likely to be punished in the share market. Under promising and over delivering is the mantra for rewarding shareholders, of whom managers will be an influential minority. Curro clearly greatly surprised the market between 2011 and 2015 as it delivered fully on its promises, but since 2015 has not been assisted by the share market, which has moved mostly sideways. In recent years it has performed well but not better than expected (though offshore investors, measuring performance in US dollars, will regard 2016 with much more favour than their SA partners, given the stronger rand, which was up by about 20% in 2016).

To address this issue, Curro has indicated not only a willingness to pay dividends but to raise debt and debt ratios to supplement internally generated cash flows to fund growth. Cash flows are still expected to increase even though they are somewhat depleted by dividends to be declared.

The company has also revealed an intention to list separately a further entity on the JSE to pursue promising opportunities in tertiary education in SA. Why then list a separate company rather than pursue this opportunity from within the existing structures?

The answer may be that to do so would raise a new opportunity (Curro reprised) to surprise the market with a successful new listing, that is to surprise investors and so achieve capital appreciation more easily than it could do within the established Curro. To expand the tertiary education offering within Curro, with its already large scale, such a build-up of tertiary capacity may not make a very obvious difference to its growth trajectory and the already highly favourable expectations of investors revealed by a demanding share price.

Therefore paying dividends to shareholders will help them fund the new company. Note that the controlling shareholder, PSG, which helped launch Curro and owns 52% of it, must support any new listing. Cash withdrawn from Curro will help PSG fund its share of the new venture that with its small beginnings could surprise the market all over again and reward its shareholders accordingly by over delivering.

It might be sensible for the minority shareholders in Curro to follow any lead given by the controlling shareholder – that is to receive cash dividends from Curro and invest in the new venture and hope to be rewarded for doing so. 15 March 2017

The SA Budget for 2017-18 – Cross road or dead end?

The Budget speech and accompanying Review refer to an economic cross roads, suggesting a new path is to be taken to accelerate growth in SA. There is little in the Budget proposals to indicate a way out of our economic dead end of persistently slow growth and ever higher tax rates. Yet both government spending (up 3% in real terms) and government revenues (up slightly more) and their share of a slow growing economy are expected to rise. The negative feedback from higher tax rates and higher tax revenues to fund an ever larger role for the SA government in the economy – on the growth outlook – is simply not recognised.

Higher income and expenditure tax rates may help to balance the books but will not do anything to revive the creative and entrepreneurial spirits of the key economic actors, the high income earners. The dependence of all South Africans on them goes much further than the taxes they pay to fund welfare benefits. They earn their higher incomes (competing with each other) by directing the markets for jobs, for essential goods and services, and for capital. And they help organise the education, training and skills that make workers more productive and capable of earning more. And they take risks with their capital, human as well as financial, to innovate in the search for better methods and better products and services that is the very stuff of economic advances. This Budget and the accompanying rhetoric will not encourage them; it is likely to do the reverse.

The scale of the redistribution of income from the best rewarded in SA to the wider community is large. One can refer in this regard to Figure 1.3 of the Budget Review that most strikingly demonstrates these outcomes. It shows that the top 10% of income earners contribute 72% of all taxes (VAT etc included) while the bottom 50% receive 59% of the benefits of government spending while contributing 4% of taxes. The middle 40% receive 35% of the benefits (valued at their cost not quality) for 25% of the taxes paid. Clearly there is little scope for further redistribution from the top 10%.

There is much scope for faster economic growth. But this will take less redistribution from the high earners and much better returns (in the form of delivering the extra skills that command jobs and higher incomes) from the large sums the government spends on education and training. It will take much better delivery by the state owned companies that perform so poorly for all but their own employees and directors. Privatisation is the obvious solution to wasteful government spending (the solution to egregious government failure) but alas is not on offer.

What is offered by the Budget as the solution is Transformation for better or for worse (depending on whether you stand to lose or benefit) and the promise of Radical Economic Transformation. By Transformation is meant, presumably, a diminished (proportionate) role in the economy for white South Africans who – presumably – still dominate (disproportionately) the ranks of the movers and shakers of the economy despite impressive transformation to date and despite the indispensability of their contributions to the economy.

It is well recognised in the Budget that economic growth is and has been transformational and that transformation without growth impossible. To quote: “Growth without transformation would only reinforce the inequitable patterns of wealth inherited from the past. Transformation without economic growth would be narrow and unsustainable…”

In a similar vein:

“If we achieve faster growth, we will see greater transformation, enterprise development and participation.”

Economic growth is transformational for SA. Faster growth would mean a greater pace of transformation as the economy would call more urgently upon the skills and abilities of all South Africans and thus help to create improved outcomes. Transformation with growth is inevitable, most desirable and most helpful to the economy. But policies for transformation that intend to handicap white South Africans, who play a crucial role in the economy, to favour a few well-placed, advantaged black South African business people will only frustrate economic growth, rather than grow it, and slow down transformation.

Can the strong rand be more than a headwind for the JSE?

South African investors on the JSE will be only too well aware that it has moved mostly sideways over the past few years. The performance of the JSE in US dollars however presents a very different picture, given the strong recovery of the rand last year. The US dollar value of the JSE, the focus of foreign investors, fell away badly in 2015 and then recovered strongly in 2016. The JSE All Share Index (ALSI) is now back to its value of early 2014 and 2015 having gained nearly 20% in US dollars since January 2016 as can be seen in figure 2. The rand itself is worth about 20% more against the US dollar – compared to February 2016.


The reason for these very different outcomes, when expressed in different currencies, is obvious enough – it is the result of rand weakness in 2014 and 2015 and its significant strength in 2016-17.

Clearly the very strong rand, up 20% year on year, represents a strong head wind for the value of shares expressed when expressed in rands. Or, in other words, for a share to have provided positive rand returns over the past 12 months, would have had to have seen its US dollar value appreciate by more than the 20% gain in the rand, a very high rate of return.

Naspers, with the largest weight on the JSE of about 17%, delivered coincidentally about a 20% increase in its US dollar value since January 2016. This was satisfactory enough, but not quite enough to provide appreciation in 20% more valuable rands.


Resource companies on the JSE did much better than the average listed company, especially from mid-year. Their US dollar value has increased by about 50% since early 2016, more than enough to provide highly satisfactory rand returns, despite the stronger rand. It may be a source of some confusion to market observers that JSE Resources could do so well, despite rand strength. In other words, Resource companies did not behave as a rand hedge in 2016: in reality they performed as rand plays (companies that do especially well when the rand strengthens).

They would have enjoyed much higher operating margins had the rand been weaker – other things remaining the same – including underlying metal and mineral prices in US dollars. But the rand was strong because underlying metal and mineral prices in US dollars had risen, by more than enough to offset the pressure on operating margins that comes with a stronger rand.

Therefore it is always important to establish the sources of rand strength or weakness. Rand weakness for SA-specific risk reasons can make Resource companies or companies with largely offshore operations effective hedges against rand weakness. Their rand values will go up as the rand weakens because they are selling into world markets where business continues as usual and so earn more rands doing so. The opposite influences are at work on SA economy companies when the rand weakens, especially on the rand and US dollar value of companies with an important element of imported components and inventories. The weaker rand not only crimps operating margins; it means higher prices and less disposable income. More inflation also is likely to bring higher borrowing costs in its wake, further depressing the demand of households and firms. Rand strength for SA-specific reasons will have the opposite effect, all other things equal, including the state of global markets, especially commodity markets. But as we have seen in 2016, other things do not necessarily remain the same for global growth reasons. Resource companies can benefit from higher commodity prices, in US dollars, and from higher metal prices in rands – even when the rand appreciates.


The increased global demand for commodities and for the shares of the companies that produce them not only increased their US dollar values. They also increased the demand for the rand and other emerging market currencies and equities generally that have a strong representation from resource companies. In the figures below we show the rand has moved in line with other emerging market currencies- represented by eleven such currencies all equally weighted in our basket. It is also shown how the rand in 2016-2017 has been stronger than its emerging market peers have been against the strong US dollar, with its recovery from a relatively weak position in late 2015.


Of particular interest is how strongly the USD/ZAR rate has been connected recently to emerging market equities. (In turn the JSE in US dollars is as usual strongly connected to the average emerging market equity as we have shown above). The rand is more than ever an emerging market equity currency. It can be assumed (Zuma permitting) that the rand will continue to move in line with them (see figure 7 below).

Furthermore, emerging market equities will continue to be strongly influenced by the behaviour of commodity prices, as they have been recently. Hence the performance of the rand and other emerging market currencies and equities (in US dollars) in the months ahead will depend on the behaviour of commodity prices. Commodity prices will reflect the pace of the global economic cycle. If this cycle continues in its upward direction, the rand could continue to gain value against the US dollar, provided SA specific risks are not elevated, as they were in late 2015.


Furthermore, if the USD/ZAR remains well supported, SA inflation will recede and short term interest rates will belatedly reverse direction. This combination of lower interest rates and lower costs of imports will be helpful to those listed business dependent on the spending and borrowing decisions of SA households. Their rand earnings will grow faster to help add rand value to their shares, perhaps even enough to offset rand strength. Headwinds from the strong rand can become tailwinds for SA economy-dependent business, as was the case between 2003 and 2008. 2 March 2017