A brilliant success story
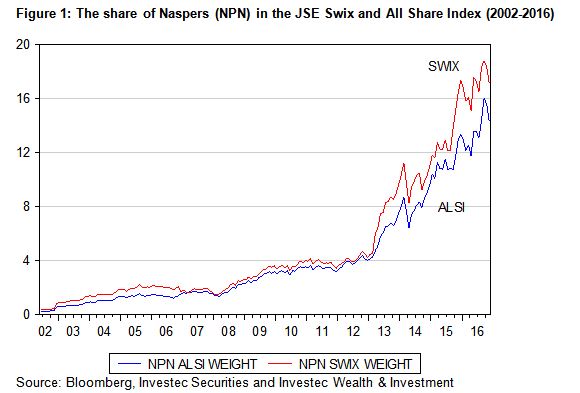
When the financial history of South Africa in the first two decades of the 21st century comes to be written, the role played by Naspers (NPN) will surely be a prominent one. Its achievements reflect many of the important themes of our financial times- not only that of outstanding returns to share-holders that made NPN by far the most important contributor to the JSE – with a weight in the JSE market Indexes of about 17% and a market value that rose from R7b in 2003 to nearly R85b by the end of 2016. But as important and interesting is that the value added for shareholders came from participating in the new digital economy and by taking excellent advantage of South Africa’s newly acquired democratic credentials and consequent access to global markets in goods services and capital.
Fig.1; Naspers (NPN) Market Value and share of the JSE Swix Index
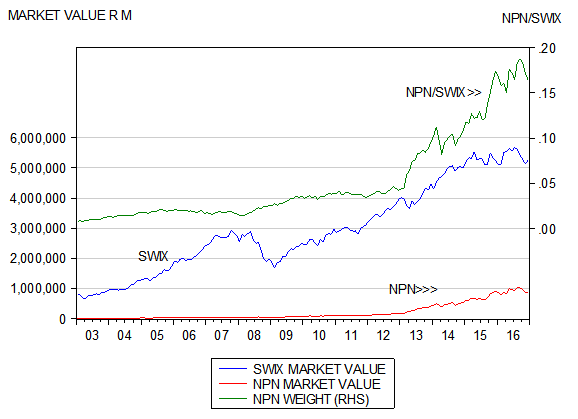
Source; Bloomberg, Investec Wealth and Investment
The most important decision made by NPN management was the decision taken in 2001 to purchase 46.5% of Tencent (a Chinese internet business listed in HongKong for USD34m.[1] This stake has since been reduced to a 34.33 per cent holding. As we show below the rand value of Tencent itself, when converted to ZAR at the current rates of exchange, is now over R3000b and the theoretical or potential worth of the NPN stake in Tencent to over R1000b.
Fig 2. Market Value R millions of Hong Kong listed Tencent and the theoretical value 34.33% NPN stake in it. 2007-2016. Month end data
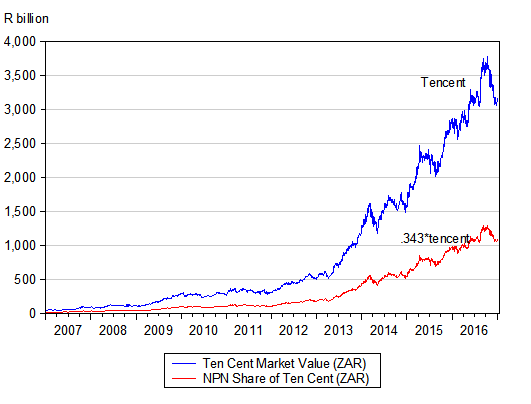
Source; Bloomberg, Investec Wealth and Investment
The theoretical not actual value of the stake in Tencent
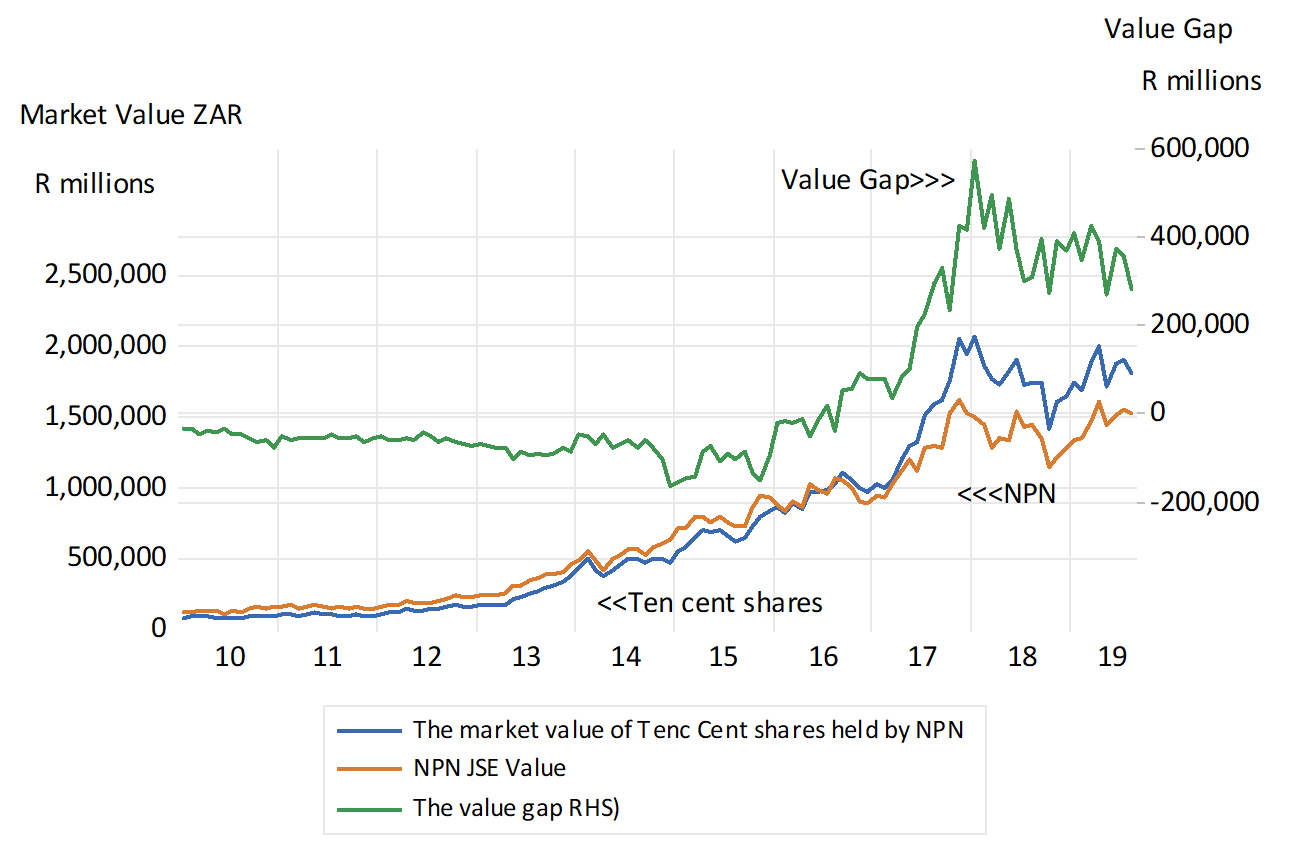
The theoretical nature of this estimate deserves emphasis. Firstly because its holding in Tencent is worth more than the value of NPN itself as we show in figure 3- some 22% or R216b less than its holding in Tencent. This implies that all the other assets of NPN in which it has made very large investments have a large negative value for shareholders of as much as R216b.
Fig 3; The market value of NPN and its stake in Tencent (Rm) (Month end data 2014-2016)
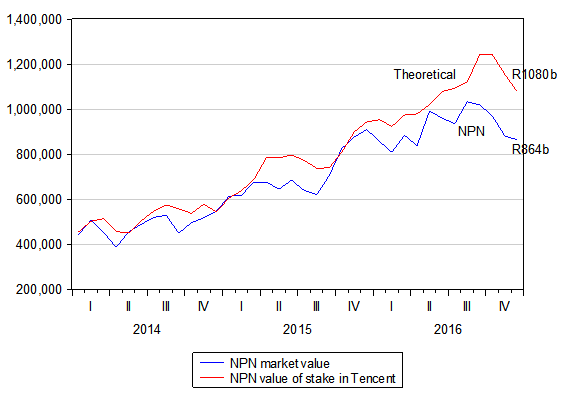
Source; Bloomberg, Investec Wealth and Investment
The link nevertheless between the share value of NPN and Tencent Holdings is very close – notwithstanding the fact that NPN now seems to be worth significantly less than its holding in Tencent. The correlation of the daily level of two share prices measured in ZAR is 0.99 indicating that almost all of the price level of NPN in ZAR can be attributed to its holding in Tencent and the current value of a Tencent share.
NPN is much more than a holding company for Tencent shares- but what is its other business worth?
NPN, as a business enterprise, however is much more than a holding company for its investment in Tencent, as its cash flow statement for the latest financial year to March 2016, demonstrates very fully. NPN reports dividend income in 2016 (mostly from Tencent) of USD146m compared to net cash utilised in investment activity by NPN in FY 2016 of USD1,384m. This investment activity in 2016 was facilitated by additional equity and debt raised in 2016 of USD4470m of which USD2270m was applied to repaying existing debts.
The implication often drawn by investment analysts when comparing the value of NPN to its sum of parts- including the Tencent holding – is that all this investment activity undertaken by NPN management destroys rather than adds significant value for its shareholders. But such a conclusion, or rather the scale of this presumed value destruction, is perhaps not nearly as obvious as it may seem on the surface.
It is firstly not at all clear that NPN would ever be willing or indeed able to dispose of its holding in Tencent. Even if NPN were willing sellers, such a disposal might well be subject to the approval of the Chinese authorities. These authorities would be concerned about who might acquire these rights to the revenue and income from NPN- for example US internet companies that have a dominant share of the global internet business that might not be welcome in China.
Thus valuing the NPN holding in Tencent, as if it could be easily disposed of a current market prices – or even unbundled to its NPN shareholders- may well be an invalid assumption. In reality the NPN stake in Tencent may well be more conservatively valued in the market place as an illiquid asset and so worth less than it appears on the surface- that is valued at less than the prevailing market value of Tencent- but exactly how much less would be a matter of judgment.
Moreover if there is no NPN intention or ability to dispose of its Tencent stake then its value to NPN shareholders will depend on the uses to which NPN puts the dividend income it receives from Tencent, and perhaps more important the borrowing capacity its stake in Tencent may give NPN and the debt capital it raises to fund investment expenditure.
The NPN cash flow statement for financial year indicates significant investment and financial activity as discussed above. The cash flow statement also refers to NPN dividend payments of USD254m in 2016. That is dividends paid to NPN shareholders in 2016 exceeded the dividends received from Tencent and other investments. Clearly these dividend payments are not valued as highly as dividends paid by Tencent a point to which we return below.
Tencent listed in Hong Kong is no ordinary company
The full nature of the holdings of NPN and other shareholders in Tencent Holdings in Hong Kong deserves full recognition. These holdings do not represent an ownership stake in the usual sense. Tencent Holdings in Hong Kong provide its shareholders with contractual rather than ownership rights. They only have rights to the revenues, earnings and dividends generated by the Chinese owned operating company provided by Tencent Holdings- not to the assets of the company in China that have to be owned by Chinese citizens. Accordingly these right holders have no claim on the assets of the company should they have to be liquidated, unless they are Chinese owners. The contractual right is only to a share of revenues earnings and most obviously to dividends- not to the assets of the company operating in China that is limited by law to Chinese citizens.
Foreign ownership of internet and media companies in China including Tencent is prohibited. These ownership restrictions were however overcome and access to foreign capital achieved by Chinese entrepreneurs, including those who founded and developed Tencent, through contractual arrangements known as Variable Interest Entities (VIE’s) of which Ten Cent Holdings listed in Hong Kong is but one of many such entities listed outside of China. The note from Reuters on Alibaba written in September 2016 – a large rival to Tencent Chinese owned internet company –more recently listed in New York –explains the nature of a VIE.
Report from Reuters on VIE’s September 2016
Sept 9 (Reuters) – When Alibaba Group Holding Ltd sells more than $20 billion in shares on the New York Stock Exchange next week, investors won’t be buying equity in China’s biggest e-commerce company. Instead, they will buy into a firm that owns the rights to participate in the revenue created by a handful of Alibaba’s e-commerce and advertising businesses.
* Alibaba Group is set up as a traditional variable interest entity (VIE) structure – an elaborate legal arrangement designed 14 years ago to help Chinese tech and financial companies that hold restricted government-issued domestic licenses raise money overseas.
* VIE structures allow offshore-listed companies to consolidate domestic Chinese firms in their financial statements by creating the appearance of ownership.
* Of the more than 200 Chinese companies listed on the New York Stock Exchange and the NASDAQ, 95 use a VIE structure and have audited financial filings for 2013, according to ChinaRAI, a Beijing-based business consultancy. They include China’s biggest internet companies, such as Baidu Inc and JD.com Inc.
* VIE structures typically involve offshore holding companies in the Cayman Islands and British Virgin Islands; Hong Kong subsidiary enterprises; Chinese wholly foreign-owned enterprises (WFOEs); and local operating companies. The Chinese operating companies that anchor the arrangement are called the VIEs and hold the Chinese licenses that are restricted to domestic companies – in Alibaba’s case, primarily internet content provider licenses.
* Alibaba’s VIE structure comprises five local operating companies, each of which is 80 percent-held by co-founder and executive chairman Jack Ma, and 20 percent by long-term executive Simon Xie – except for Zhejiang Taobao Network Co, which is 90 percent-held by Ma.
* A series of technical services, loan, exclusive call option, proxy, and equity pledge agreements bind the domestic firms to the WFOEs and create the “variable interest” – allowing offshore Alibaba Group shareholders the appearance of control of the local companies.
* The contracts also are meant to provide a legal framework of checks and balances to guarantee that the ultimate stakeholders of the local operating companies act in accordance with the wishes of the offshore listed company’s shareholders. On occasion, such contracts have been broken. In 2010, for example, Ma unwound the contracts for Alibaba’s Alipay unit, triggering a dispute with major shareholders, including Yahoo Inc.
* The VIE structure has never been tested by courts in China.
* In its pre-IPO filings, Alibaba cautions investors that it can’t guarantee its VIE shareholders “will always act in the best interests of our company”, and that if the Alibaba VIE shareholders breach their contracts, “we may have to incur substantial costs and expend additional resources to enforce such arrangements.” (Compiled by Matthew Miller; Editing by Ian Geoghegan)
Thus the value of these contractual right to the revenue, earnings and dividend streams generated by these VIE’s is subject to significant uncertainty that is surely recognised in the prices of their shares listed outside of China. Thus any negative impact on the value to the beneficiaries of these VIE’s arrangements will however also apply to the rights enjoyed by all owners in Tencent Holdings listed in Hong Kong- including those held by NPN. Any VIE discount attached to the rights in Tencent traded in Hong Kong would already be reflected in the Tencent share price.
The value of the dividends paid by Tencent- valuing dividends to recognise value destruction- and the value add opportunity.
The direct benefits to NPN shareholders have come in the form of dividends received from Tencent. These as may be seen have grown spectacularly both in USD and even more so in ZAR. By year end 2016 the .3433 per cent of the dividends flowing to NPN would have been of the order of USD200m or R2700m at current exchange rates. These dividends have grown spectacularly- at an average annual compound rate of about 42% p.a. in USD and 51% p.a when measured in ZAR since 2017. (See below)
Fig 4. Tencent dividend and earnings flows to shareholders. (2007-2016)
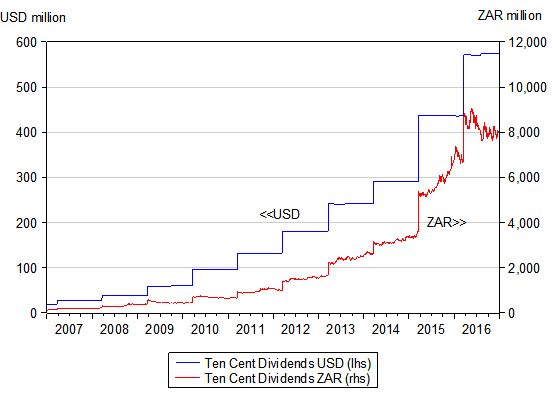
Source; Bloomberg, Investec Wealth and Investment
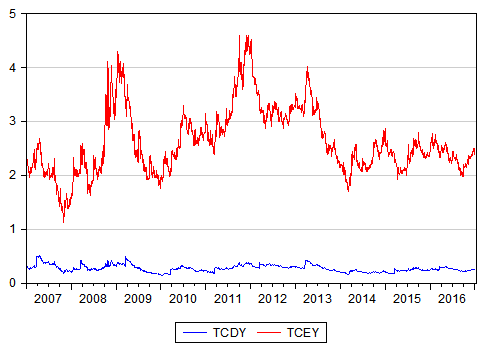
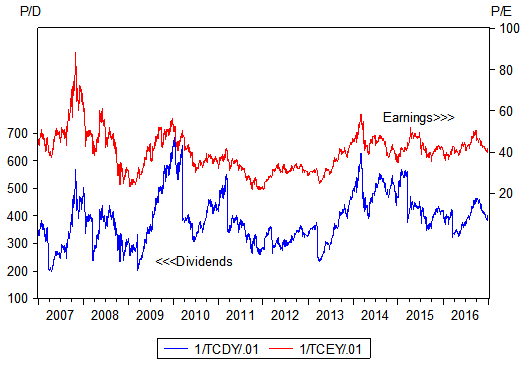
These growth rates and the expectation they would be sustained, have been reflected in the values attached to shares in Tencent Holdings. As we show below the Tencent shares as at December 31st 2016 traded at 42.1 times reported earnings and an even more spectacular 403.6 times reported dividends. (see figure 5 and 6 below where we show the trailing Tencent earnings and dividend yields and multiples.) The dividend yield (D/P) as at end December 2016 was 0.247 and the earnings yield (E/P) 2.37.
Fig 5; Tencent Holdings; Earnings and Dividend Yields Daily (Data 2007-2016)
Source; Bloomberg, Investec Wealth and Investment
Fig 6; Tencent Holdings; Price/Dividends and Price/Earnings Ratios (Daily data 2007-2016)
Source; Bloomberg, Investec Wealth and Investment
Were the dividends received from Tencent by NPN shareholders accorded the same price multiples as those accorded to Tencent shareholders themselves this .3433 share of the dividends paid by Tencent would command a value of about USD79b or ZAR1,085b, at prevailing exchange rates, that is well ahead of the ZAR850b of NPN market value recorded at year end 2016. Another way of putting this would be to say that the dividend stream paid by Tencent to its shareholders would now be worth R200b more if NPN shareholders could receive these dividends directly rather than via NPN. As indicated earlier unbundling these shares is not a choice NPN is likely to make- nor may it be a feasible option given Chinese sensitivities. What however might well be possible would be for NPN to create a Tracking Stock to track its Tencent Holding[2]. It could in other words further contract with its shareholders to pay out all the dividends it receives from Tencent directly to them and that these rights to the Tencent dividends could be traded separately in the market place. NPN would continue to own its Tencent rights so no change in control would have occurred and such ownership rights as before would be reflected on its balance sheet. The NPN, Tencent tracking stock would then presumably be a pure clone of Tencent itself and so command the same value- that is 400 times the dividends paid out. NPN shareholders would then be about ZAR200b better off.
Furthermore the shareholders and NPN managers would then know very precisely the value added or lost by the investment activity undertaken by NPN. The rump of NPN- net of the explicit value of its Tracking Stock – would very objectively measure how much the other assets of NPN – in which it has invested so heavily – are actually worth to shareholders. The case for adding to such assets- including raising debt to the purpose – would then presumably have to be a good one. In addition, with dividends flowing through the tracking stock, NPN could make the case for reducing its own dividend payments- and investing the cash. That is if NPN could realistically expect returns that would exceed its cost of capital, above required risk adjusted returns, and so add value for shareholders.
In line with much market commentary, is it unfair to suggest, that the complications inherent in valuing the Tencent stake in NPN has encouraged poor capital management by NPN? The large difference, approximately R200b between the value of the Tencent dividends received by NPN and the value of NPN itself strongly suggests that NPN is not expected to add value for its shareholders through its investment activity.
Recognising objectively the value of the Tencent stake through the market value of its tracking stock will help expose the significant other business of NPN to the essential disciplines that should govern the use of shareholder capital. This surely would be good for NPN shareholders.
Conclusion
For all its past success the management and directors of NPN have a very large problem with investors. The market reveals that NPN would be worth much more to its shareholders if it sold off all its assets and paid off its debts. The assets it has invested so heavily in (in addition to its investment in Tencent) would have significant positive value in other hands- surely many hundred of billions of rands. But such sales or unbundling of assets is regarded as a very unlikely event hence the lower sum of parts value attached to NPN.
What the market is telling NPN management is that its impressive investment programme is expected to destroy many billions of shareholder value. That is the cash to be invested, by NPN, is thought to be worth many billions more than the value of the extra assets the company will come to own and manage. This investment programme is a very ambitious one. In FY 2016 the company reported development expenditure of USD961m and M&A activity of USD1495m.
Clearly the NPN directors and management must believe differently, that the cash it intends to invest on such a large scale will add value for shareholders- that is return more than the cost of this capital- that is achieve an internal return of at least 8% p.a when measured in USD or 14% p.a in rands. If it achieves such returns it will add rather than destroy value for shareholders.
But there is room for an important compromise between sceptical investors and confident managers. And that is to separate the Tencent investment from the rest of the business. If NPN established a tracking stock that passed on the dividends directly to its shareholders this tracking stock would be valued at approximately 400*R2.7b, or approximately R1080b – about 200b rand more than the current market value of NPN itself. This tracking stock would be a pure clone of Tencent- perhaps also listed in Hong Kong and can be expected to trade on the same dividend generating basis as Tencent itself.
Shareholders would surely greatly appreciate an immediate R200b plus value add – and the growing dividend flows from Tencent- via NPN. And the quality of NPN management could then be measured much more clearly without the complications and comfort of its Tencent stake.
[1] The listing in HK on the Hang Seng exchange is abbreviated as 700HK
[2] For a full analysis of Tracking Stocks and their feasibility see
J Castle and B Kantor, Tracking stocks – an alternative to unbundling for the South African group, The Investment Analysts Journal, 2001 51(4), also to be found on the website www.zaeconomist.co, Research Archive.


