Of higher metals prices, inflation and (hopefully) better years to come

Higher metals prices in previous times have been good for the SA economy. There is little reason to believe this will not be the case again, even if global inflation rises.

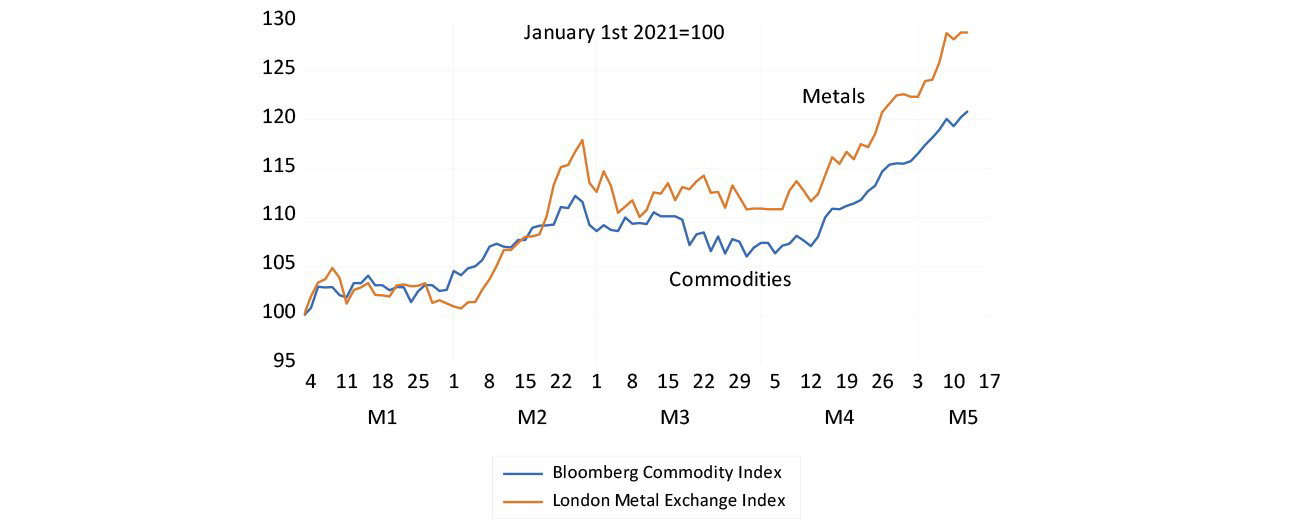
Inflation is busting out all over the world. The US dollar prices of industrial metals traded in London are up 30% and commodity prices are up 20% this year. These higher prices are not a cause of inflation. They are inflation. Larger amounts of money have stimulated demand and supply is struggling to catch up. Too much money chasing too few goods is the obvious explanation of higher prices.

Rising prices and interest rates absorb excess holdings of cash and, sooner or later, will slow down demand and the pace of growth. Governments might respond to this slowdown with yet more money and spending. If that happens, a temporary phase of rising prices will morph into a much longer phase of continuously rising prices. The US jury is out on this and when they return, South Africans should hope for a guilty verdict – guilty of causing more inflation and the rising metal prices that come with it.

Metal and commodity prices in 2021 graph

Converting the SA mining sector price index (the mining deflator) into US dollars helps identify these important global forces at work on our economy. In the 1970s, the dollar prices of the metals we produced (then mostly gold), increased by 10 times. Metal prices then fell away sharply after 1981 and remained depressed until the early 2000s. Thereafter they exploded by nearly five times, in what was a super cycle, until rudely interrupted by the Global Financial Crisis (GFC) in 2008.  Hard times for SA followed the consistent downward pressure on metal prices after 2011. The recent modest recovery of SA metal prices, off what became a low base, is thus especially welcome.
The South African mining deflator in US dollars graph
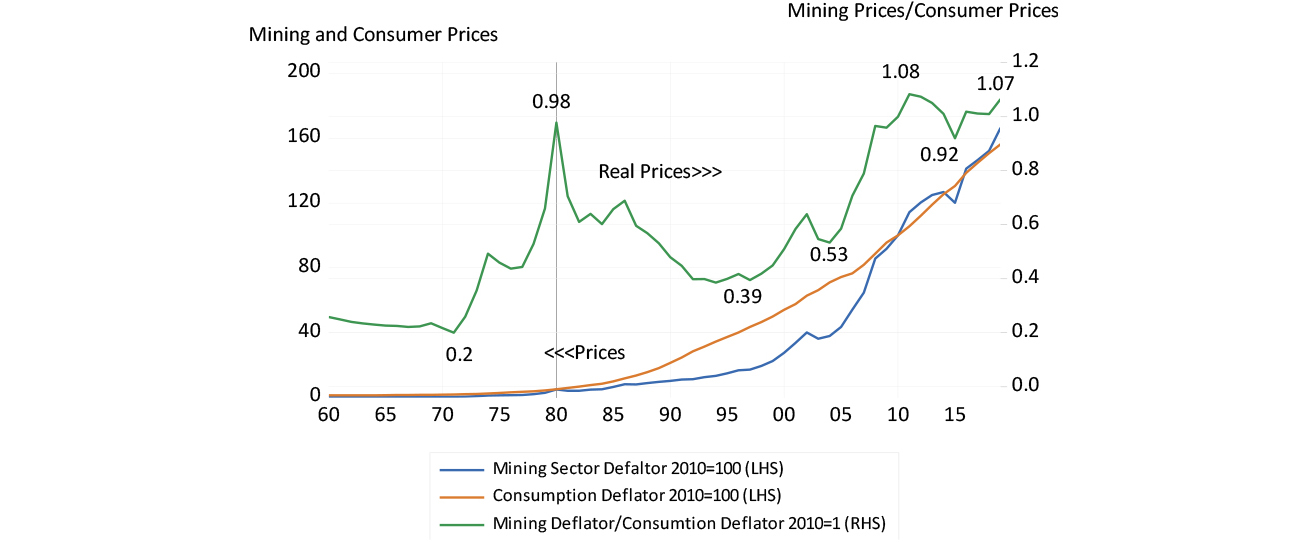
Good times for the SA economy follow when metal prices rise much faster than prices in general – as they are doing now. The extra income earned by mining in SA, the profits earned, the dividends, wages and royalties and taxes paid, rise faster and (conversely) fall further with this cycle. In the 1970s, the real price of SA metals, the ratio of the metal price index over consumer prices, increased by nearly five times. Between 1981 and 1996, it then more than halved, damaging the economy severely in the process.

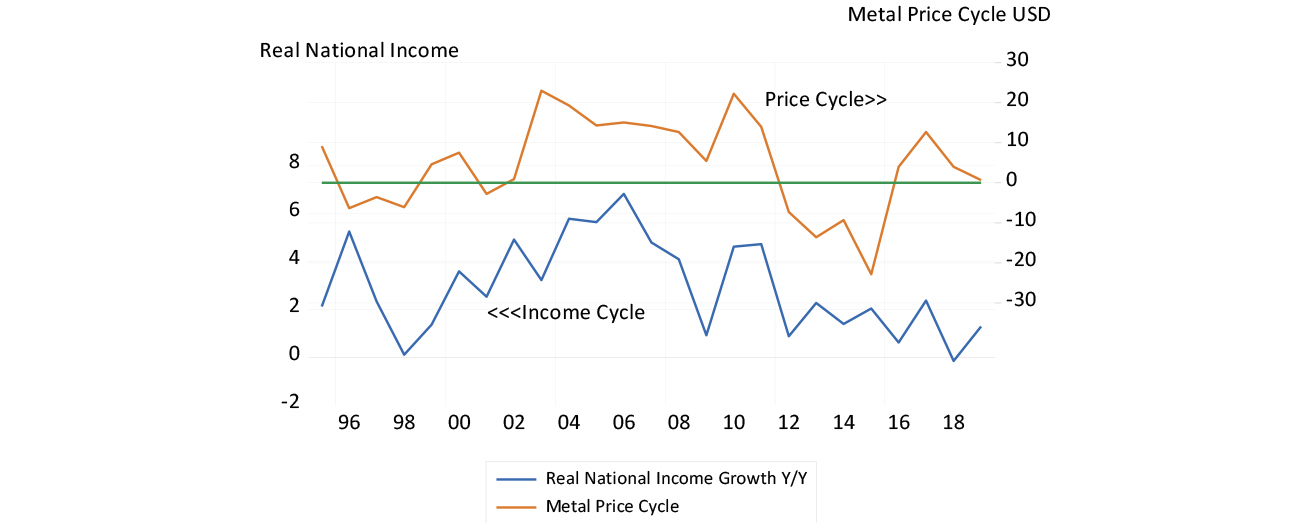
The one genuine recent SA boom between 2003 and 2008 followed a doubling of SA’s real metal prices.  Real national incomes grew on average by 5% a year over these six years, until interrupted by the GFC. Chinese stimulus helped hold up metal prices until 2011 but their decline until 2016 made for more difficult local economic conditions. A degree of relief came from a recovery in metal prices after 2016, a prospective recovery that was overtaken in turn by the lockdowns of 2020. The advances on the metal front make the outlook for the coming years promising for the SA economy.

Metals, consumer goods and services prices in SA and their relationship graph
Real growth in SA national income and the metal price cycle in US dollars graph
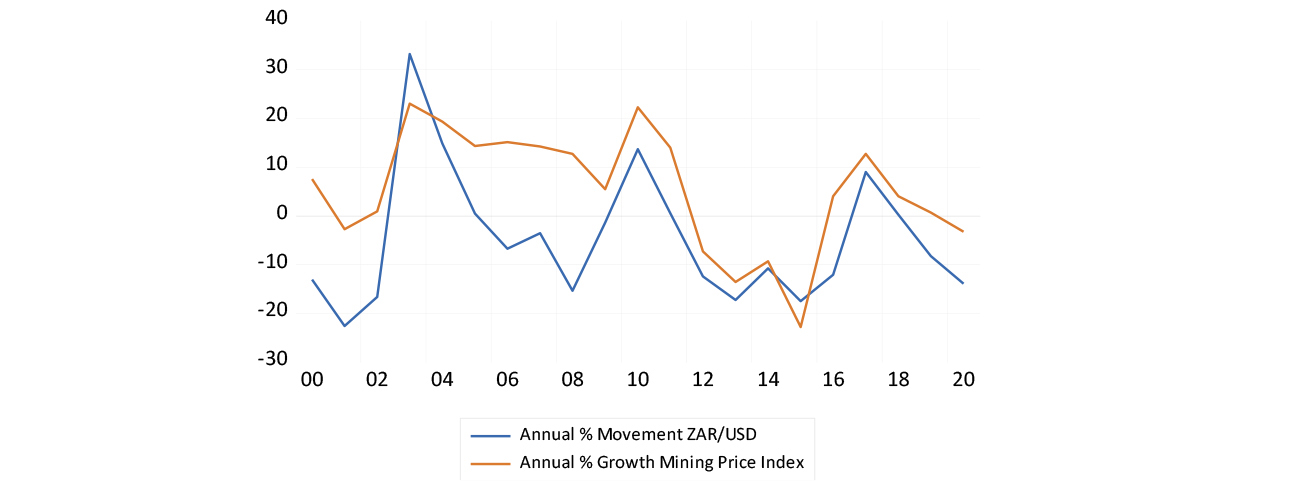
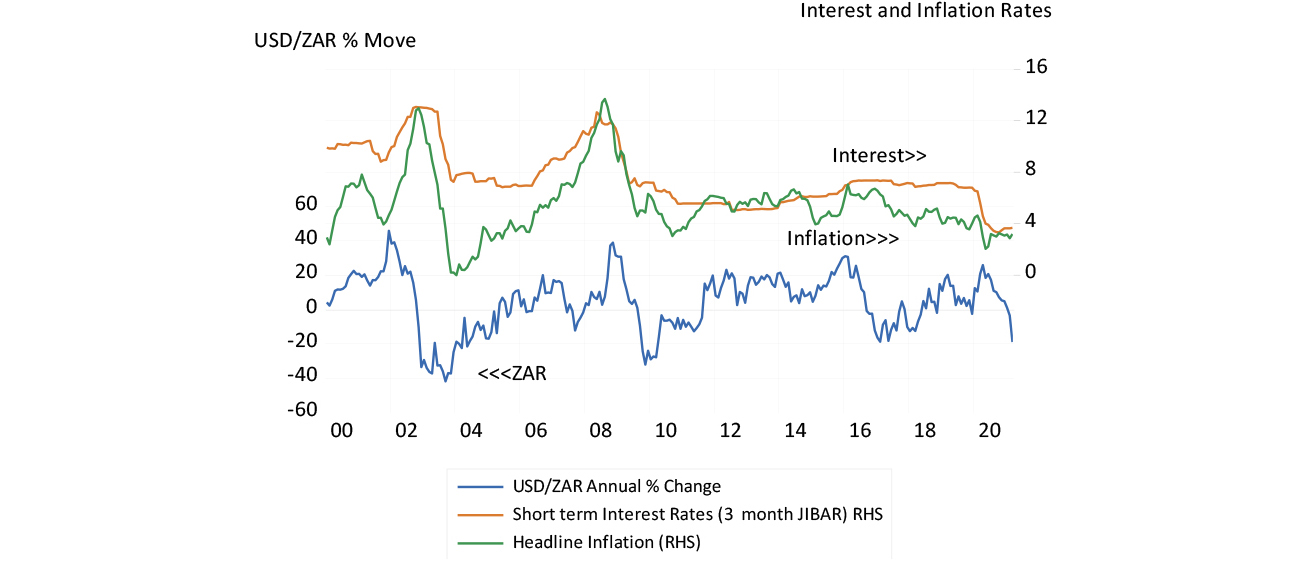
The exchange rate takes its cue from the global forces that drive metal prices. And the inflation rate in SA, with variable lags depending on global prices (especially the oil price), follows the exchange rate.  Interest rates follow inflation – in both directions. These forces strongly reinforce the metal price effects on the direction of the SA economy.
The SA mining price cycle (US dollars) and the rand cycle graph
The exchange rate cycle, interest rates and inflation in SA graph
Much of what drives the SA business cycle, metal prices, our international terms of foreign trade and the exchange rate is unpredictable and beyond our control. What matters is how we react to such circumstances. Our policies should be anti-cyclical and focus on moderating the direction of spending.

Exchange rate strength both stimulates domestic demand and dampens prices, led by the price of imports. Exchange rate weakness does the opposite. It weakens demand by pushing up prices.

Interest rates should not respond to exchange rate shocks on inflation in either direction: they work themselves out over a year or two. The stagnation of the economy post-2014, the depressing effect of lower metal prices and a weaker rand, was intensified by exchange rate weakness. This weaker rand led to higher prices and to higher interest rates, which in turn were kept consistently too high, given the weakness of demand.

The cause of higher prices was a weak rand and the effect was to depress spending and interest rates. This placed further pressure on demand. The economy paid a high price for countering an inflation rate that had nothing to do with the demand side of the price equation, in fighting so-called second round effects of inflation for which there is no evidence. Economic actors are more than capable of differentiating between temporary and permanent increases in inflation. The permanently higher rates of inflation come from too much demand, not too little supply. They are waiting to make that judgment about inflation in the US.

Hopefully the next phase will be one of faster growth with low inflation that will accompany a strong rand. The risk then may then be of interest rates being kept too low for too long. This was possibly a monetary policy error committed between 2005-2008, a case of too much rather than too little stimulus. It will however be a much higher-level problem to have to deal with in the years to come. Let us hope for such a challenge.

The rand is no tale of mystery

Movements in the exchange value of the dollar itself explains the direction of emerging market exchange rates.

South Africans are inclined to regard the highly variable foreign exchange value of the rand as a deep mystery. Yet there is nothing mysterious about the currency’s behaviour.

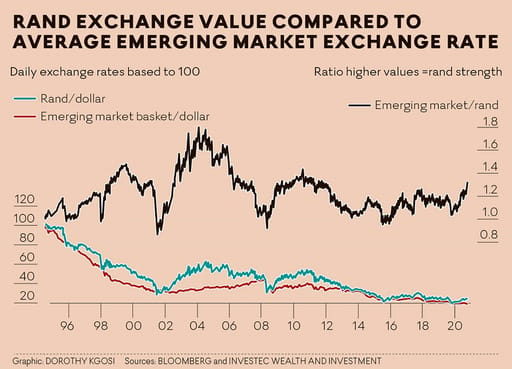
The daily dollar value of a rand has been closely tied to the value of other emerging market currencies ever since 1995, when SA opened up to global capital flows. When the ratio trends above or below the emerging market line the direction of the rand predictably reverts back to the average relationship of one to one. We have done no worse or better against the US dollar than the average emerging market economy.

Rand exchange value graph
The correlation between the daily rand-dollar exchange rate and a basket of other emerging market exchange rates — an equally weighted mix of the dollar exchange rates against the currencies of Brazil, Chile, Hungary, India, Malaysia, Mexico, Philippines, Russia and Turkey — has been close to one since 1995.

Changes in SA-specific risks can help explain temporary differences between the rand and the other emerging market exchange rates, but more important is the force that has moved all such currencies, including the rand, in the same direction. The movements in the exchange value of the dollar itself explain the direction of emerging market exchange rates.

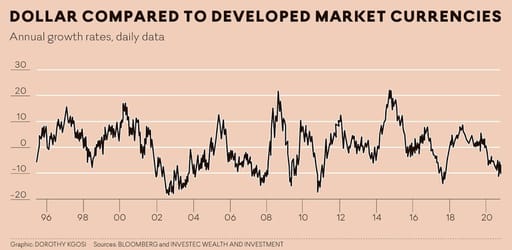
Dollar comparison graph
Relative dollar strength vs the euro and other developed market currencies has brought emerging market weakness, and vice versa. And exchange rate weakness brings more inflation. Exchange rates lead inflation. It is not the other way round.

The greater difficulty is explaining the exchange value of the dollar. The problem for all businesses that trade globally is that the exchange value of the dollar itself is highly variable. However, it too has had a strong tendency to revert to square one relative to other developed market exchange rates, though the time taken varies.

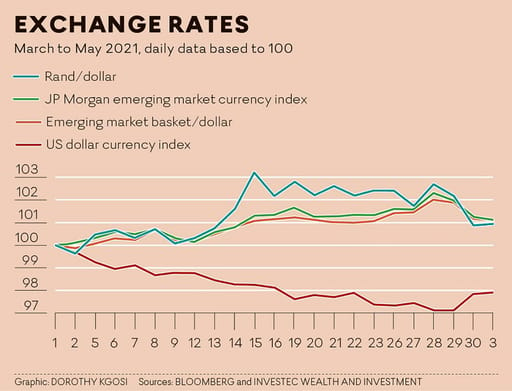
The behaviour of the rand since March conforms well to these forces. The dollar weakened until very recently, emerging market currencies gained ground, and the rand did a little better than the average emerging market until late April, after which  it has moved back into line.

Compared with a year ago these exchange rate movements are dramatic. The US dollar index (DXY), a measure of the value of the dollar relative to a basket of other currencies, is down 8%; the rand has gained 23% against the dollar; and the average emerging market currency is now worth about 6% more than the dollar.

The rand appears to be a high beta exchange rate. It does worse than the average in more difficult times, as it did during the global financial crisis, and does relatively well after the crisis appears to have been resolved, as has been the case since the global lockdowns.

Exchange rates graph
These exchange rate patterns are likely to persist, though SA can help itself by adopting a set of policies that are more sympathetic to suppliers of capital. A reduction in still exceptionally high long-term interest rates would also be helpful — they continue to reflect a persistently large risk premium and the expectation of rapid inflation.

The SA government pays more than 2% more per annum to borrow dollars for five years than does the US, because of doubts about our fiscal responsibility. The accordingly high cost of capital discourages the capital expenditure by private business that is so necessary for faster growth.

Yet something is stirring to improve the outlook. Much higher metal prices are boosting SA incomes and tax revenues. Higher growth rates in nominal GDP and tax revenues will improve the critical debt-to-GDP ratio. Sticking firmly to government expenditure targets will further improve our fiscal reputation and help reduce the risk premium. The future is in our own hands (partly at least), not only written in the stars.

Building a better tomorrow – the economics of preserving historic buildings

The destruction by fire of historic buildings on the campus of my alma mater, the University of Cape Town, has brought home for many the cultural and societal value that lives in so many historic buildings.

It’s not just runaway fires that destroy beautiful old buildings though. Humans willfully do so too. My wonderful wife Shirley and I frequently regret the demolition of those interesting older Cape Town inner-city buildings we fondly remember; buildings that have been replaced by non-descript office blocks. The ornate faux Granada, Alhambra, on lower Riebeeck Street that doubled as a cinema and was our largest concert venue (seating about 3,000), provides one set of memories of times past.

It was replaced by a very conventional and boring office block that now looks and will probably soon qualify for demolition or conversion into apartments. It has no redeeming architectural features and I would suggest not even decent rentals to justify its survival or maintenance.

The willing – and at the time quite uncontroversial – destruction of many an iconic Cape Town building was a reflection of a very limited cultural sensitivity. The redevelopment and widening of lower Adderley Street, a once charming, essentially narrow main shopping street for the city, to make way for a new railway terminus, was a particularly egregious example of insensitive narrow-minded urban planning.

Master plans that often go wrong are a danger to the natural evolution of the built environment, as it proved to be, for inner city Cape Town. The old Cape Town railway terminus was a Georgian masterpiece. It was demolished to make way for an expanse of uninteresting, and completely out of place, a bit of lawn, for looking at not sitting down upon.

Are preservation orders a fair process?

The cost of preserving an interesting building should be borne by the taxpayer not its owner. In other words, full market value should be offered when making a compulsory purchase of a building of historical interest, a market value that would include the value of the redevelopment opportunity. The loss of wealth that would come with freezing the development opportunity, so reducing the value of the house or commercial building, should not be imposed on the owner. Owners who will see the value of their home, perhaps representing a large part of their savings that they were depending on for retirement, decline significantly because redevelopment of the site has now become impossible.

Scarcity that comes with time and redevelopment can add value to an older structure

A particular building style that was once commonplace, for example Victorian, Georgian or Cape Dutch homes that were the fashion of their day, become less common over time with redevelopment and the introduction of newer, more favoured styles. Styles change understandably and naturally in response to newly available technologies and materials. This fading away of the past and the falling number of structures that reflect the past therefore should add to the rarity (and scarcity value) of traditional buildings and hence their resistance to redevelopment.

Scarcity and the higher rents the iconic building might attract can add to the business case for preserving at least the facades of such increasingly rare and admired buildings. The more valuable the building, the less likely it will be demolished.

I think of the attractive facades of the still many art deco apartment blocks in Vredehoek, an inner city suburb of Cape Town, that must make them more desirable to rent and therefore more valuable to their owner-occupiers (Incidentally, the particular walk-up block of flats in Vredehoek where I spent my first five years (1942- 47) is still intact).

I wonder how well these then unusual art deco blocks of flats were received in the 1930s and 1940s when they were constructed, on mostly vacant land. Perhaps they were welcomed as representing worldly progress, not resisted as a threat to established land and home owners.

The economics of redeveloping property and the case for demolition

The test of the quality of any building or architectural feature will be its ability to command interest and respect from later generations. Most new buildings are commissioned with an expected economic life of about 20 years, given current interest rates. A building would be given a much longer life to prove itself, if the interest rates and political and inflation risk premiums incorporated in high borrowing costs in SA were lower. If an investment in a new structure in SA cannot be justified with 20 years of expected rental income, enough net rental income to cover the costs of a new building, plus the costs of purchase of the land or the building to be demolished, it will not now be built. If it can last beyond 20 years, it will be evidence of the superiority of the original design that will have added value to the building.

A building might be demolished when it is worth less than the land it occupies. A building would be valued as the present value of the expected or implicit rental income it could generate when owner-occupied, and discounted by prevailing interest rates (or more generally discounted by the returns available from similarly risky investment opportunities, by so called capitilisation rates). Demolishing the building releases the land for alternative use. It makes new buildings possible, with the potential to create a greater stream of net rental income with a higher present value: a present value of net rental income value that would have to be expected by some risk-taking developer to be high enough to make a profit. In other words, a building whose subsequent market value would exceed the value of the lost income from the existing structure, after adding demolition costs and to recover the cost of the new building.

At any point in time, the vast majority of buildings do not qualify in this way for redevelopment and demolition. Hence, as can be observed, older buildings mostly remain standing for much longer than the 20 years of economic life that brought them into being. A burst of property redevelopment activity is always a good sign of economic progress under way. It informs us that the land is becoming more productive and capable of commanding higher rental incomes, or the equivalent, capable of bearing higher implicit rentals for their owner-occupiers. It is a trend that’s helpful to property owners but a threat to those hiring accommodation or intending to enter the ranks of owner-occupiers.

How to deal with the “nimby” crowd and facilitate value-adding property developments

Therefore politics, plus the expected higher costs of renting or owning, may frustrate the intending developer. The “nimby” crowd (“not in my back yard”), may not favour redevelopment because it threatens the value of their own real estate nearby. But frustrating the conversion of land from less to more productive uses, as with all such interventions that prevent value adding innovations, will mean wasted opportunity and slower economic growth.

I have long thought that the higher wealth tax receipts that come with more valuable real estate should be shared in part with the owners of property in the neighbourhood. Extra revenue generated by higher wealth taxes collected on more valuable property can be shared with the local owners as compensation for the extra noise or traffic that the redevelopments may bring. Tax revenue that could be used to improve local parks or provide better local security or better access roads, in an obviously earmarked way, would help reduce resistance to redevelopment of the back yard that then becomes more desirable. This will mean more valuable buildings and gains in wealth for the owners of surrounding property.

It is also my contention that every generation of architects and builders should have the opportunity to impress upon the world the strength and beauty of their designs. Not all changes in design will be for the worse. Many may turn out for the better – only time can tell. A city must live and evolve – it cannot be frozen in time and kept as a museum for tourists. And a lively, economically successful city that can sustain good services to its citizens, with a mixture of the new and not-so-new structures, that have been allowed to respond to essentially market forces, can surely attract visitors as well as migrants from other cities.

Property development is part of an evolutionary process that will add to the capabilities of the city to provide additional work and income earning opportunities. Developments can add to the value of real estate to be shared between its owners (paying higher wealth taxes) and the local authority, applying additional tax revenue in generally useful ways.