Higher metals prices in previous times have been good for the SA economy. There is little reason to believe this will not be the case again, even if global inflation rises.
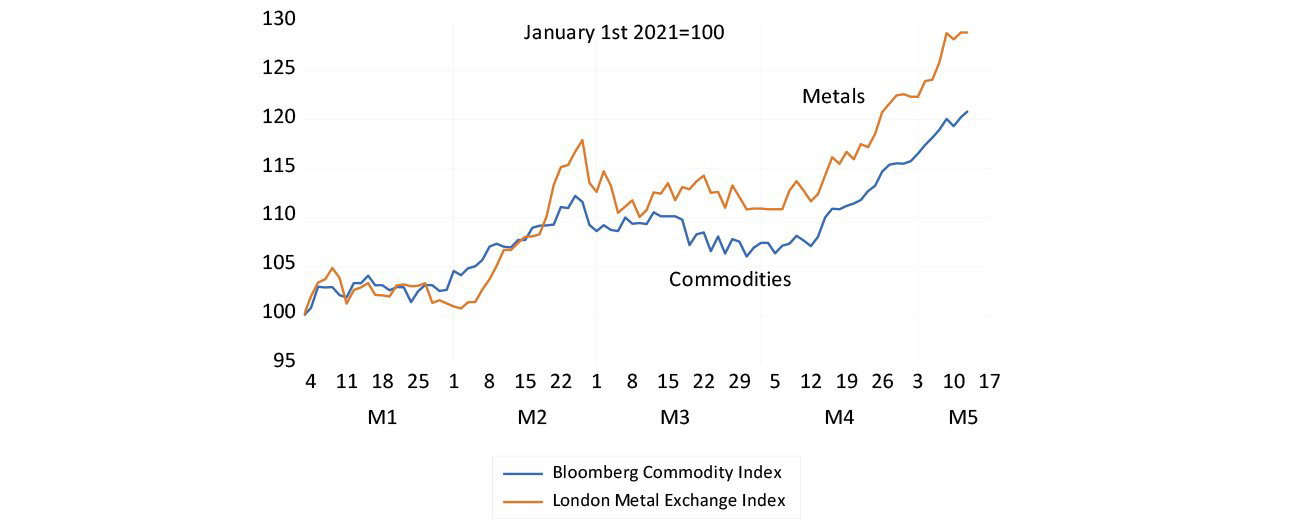
Inflation is busting out all over the world. The US dollar prices of industrial metals traded in London are up 30% and commodity prices are up 20% this year. These higher prices are not a cause of inflation. They are inflation. Larger amounts of money have stimulated demand and supply is struggling to catch up. Too much money chasing too few goods is the obvious explanation of higher prices.
Rising prices and interest rates absorb excess holdings of cash and, sooner or later, will slow down demand and the pace of growth. Governments might respond to this slowdown with yet more money and spending. If that happens, a temporary phase of rising prices will morph into a much longer phase of continuously rising prices. The US jury is out on this and when they return, South Africans should hope for a guilty verdict – guilty of causing more inflation and the rising metal prices that come with it.
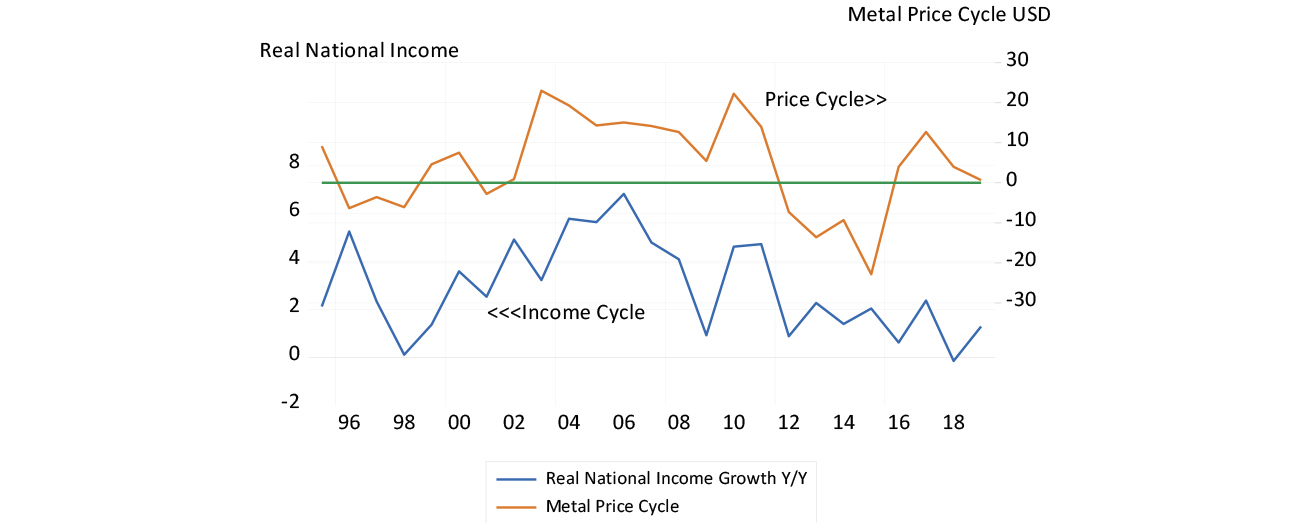
The one genuine recent SA boom between 2003 and 2008 followed a doubling of SA’s real metal prices. Real national incomes grew on average by 5% a year over these six years, until interrupted by the GFC. Chinese stimulus helped hold up metal prices until 2011 but their decline until 2016 made for more difficult local economic conditions. A degree of relief came from a recovery in metal prices after 2016, a prospective recovery that was overtaken in turn by the lockdowns of 2020. The advances on the metal front make the outlook for the coming years promising for the SA economy.
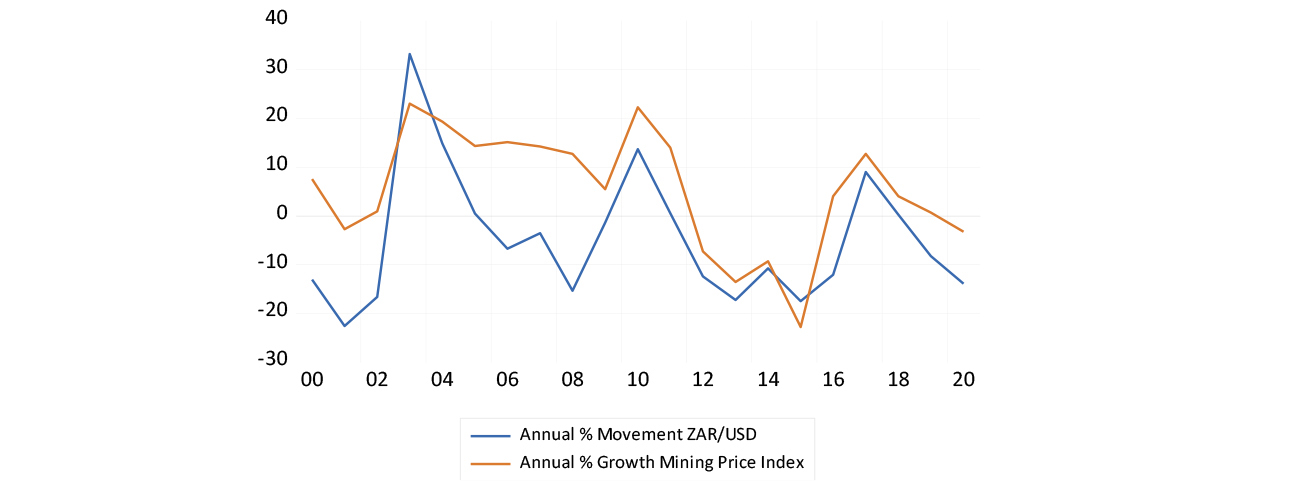
Exchange rate strength both stimulates domestic demand and dampens prices, led by the price of imports. Exchange rate weakness does the opposite. It weakens demand by pushing up prices.
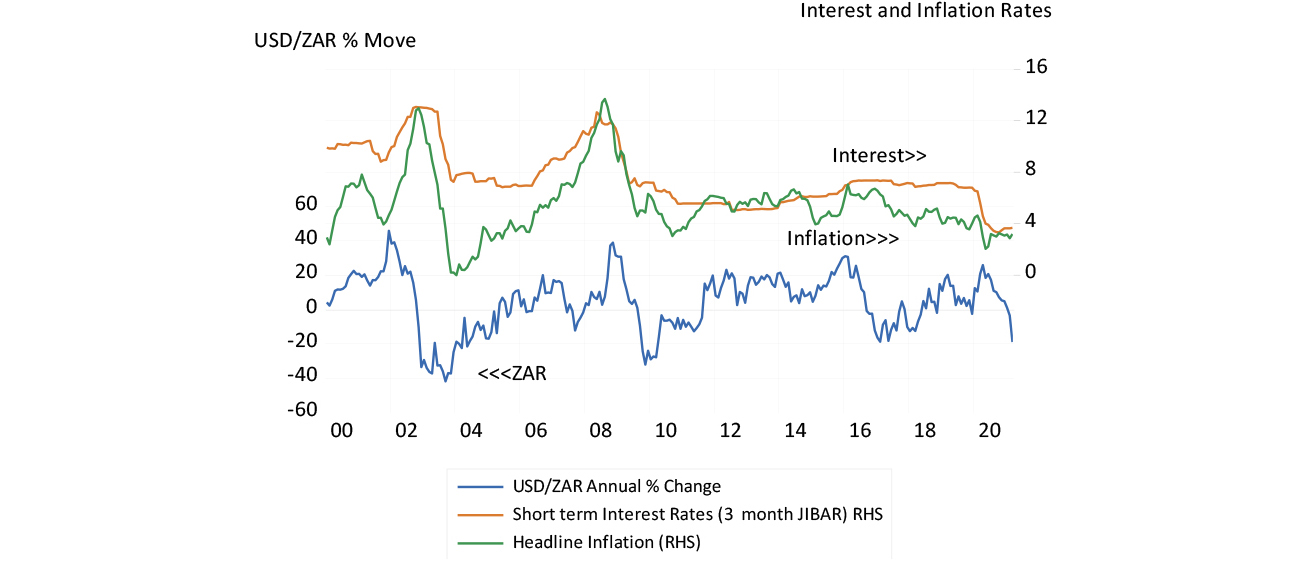
Interest rates should not respond to exchange rate shocks on inflation in either direction: they work themselves out over a year or two. The stagnation of the economy post-2014, the depressing effect of lower metal prices and a weaker rand, was intensified by exchange rate weakness. This weaker rand led to higher prices and to higher interest rates, which in turn were kept consistently too high, given the weakness of demand.
The cause of higher prices was a weak rand and the effect was to depress spending and interest rates. This placed further pressure on demand. The economy paid a high price for countering an inflation rate that had nothing to do with the demand side of the price equation, in fighting so-called second round effects of inflation for which there is no evidence. Economic actors are more than capable of differentiating between temporary and permanent increases in inflation. The permanently higher rates of inflation come from too much demand, not too little supply. They are waiting to make that judgment about inflation in the US.
Hopefully the next phase will be one of faster growth with low inflation that will accompany a strong rand. The risk then may then be of interest rates being kept too low for too long. This was possibly a monetary policy error committed between 2005-2008, a case of too much rather than too little stimulus. It will however be a much higher-level problem to have to deal with in the years to come. Let us hope for such a challenge.