Point of View: PPC and the debt vs equity debate

Is debt cheaper than equity? PPC shareholders will argue otherwise.

That debt is cheaper than equity is one of the conventional wisdoms of financial theory and perhaps practice. It appears to reduce the weighted average cost of capital (WACC). The more interest-bearing debt as an alternative to equity capital used to fund an enterprise, and the higher the company tax rate, the lower the WACC.

Yet while debt may save taxes it is also a much more risky form of capital. Even satisfactory operating profits may prove insufficient to pay a heavy interest bill or, perhaps more important, allow for the rescheduling of debts should they become due at an inconvenient moment. And so what is gained in taxes saved may be off-set (and more) by the risks of default incorporated in the cost of capital (the risk adjusted returns demanded and expected by shareholders) the firm may be required to satisfy.

Hence debt may raise rather than reduce the cost of capital for a firm when the cost of capital is defined correctly, not as the weighted by debt costs of finance, but as the returns required of any company to justify allocating equity and debt capital to it – capital that has many alternative applications. It is a required return understood as an opportunity rather than an interest cost of capital employed – equity capital included – the cost of which does not have a line on any profit and loss statement.

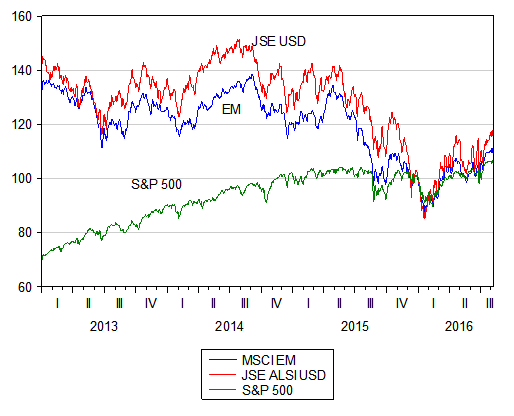
With hindsight the shareholders in PPC would surely have much preferred to have supplied the company with the extra R4bn of equity capital, before the company embarked on its expansion drive outside of SA in 2010, as they have now being called upon to do to pay back debts that unexpectedly came due. And had they, or rather their underwriters (for a 3% fee) not proved willing to add equity capital – the company would have in all likelihood gone under – and much of the R9 per share stake in the company they still owned on 23 August when the plans for a rights issue were concluded, might have been lost. Their losses as shareholders facing the prospect of defaulting on their debts to date have been very large ones, as we show in the figure below, but the R4bn rights issue promises to stop the rot of share value destruction.

The debt crisis for PPC was caused by a sharp credit ratings downgrade by S&P. This allowed the owners of R1.6bn of short term notes issued by PPC to demand immediate repayment of this capital and interest, which they did. Banks were called upon to rescue the company and the rights issue became an expensive condition of their assistance. That the company could make its self so vulnerable to a ratings downgrade, something not under its own control, speaks of very poor debt management, as well as what appears again with hindsight, as too much debt.

Having said that, on the face of it, the company has maintained a large enough gap between its earnings before interest and its interest expenses to sustain itself. In FY2016 these so-called “jaws” are expected to close sharply, on lower sales revenue, though they are expected to widen sharply again in 2017. According to Bloomberg, in FY2015, PPC earnings before interest were R1.660bn and its interest expense R490m, leaving R1.052bn of income after interest. In FY2016, earnings before interest are expected to decline sharply to R751m, the result of lower sales volumes, while interest expenses are expected to fall to R318m, leaving earnings after interest of R507m. Adding depreciation of R393m leaves the company with earnings before interest tax depreciation and amortisation (EBITDA) of R1.144bn in 2016 – just enough to fund about R1.068bn of additional capex. A marked improvement in sales, earnings and cash flows in the years to come has been predicted.

The rights at R4 per additional share were offered on Tuesday 23 August at a large discount of 55.5% to the then share price of R8.99. This discount is of little consequence to the existing shareholders. The cheaper the price of the shares they are issuing to themselves, the more shares they will have the presumed valuable rights to subscribe for or dispose of. Their share of the company is thus not being reduced even though many more PPC shares may be issued. They can choose to maintain their proportionate share of the company, or to be fully compensated for giving up a share by selling their rights to subscribe to others at their market value.

What is of significance to actual or potential shareholders is the amount of the capital being raised. The R4bn capital raised through the issue of 1 billion additional shares (previously 602m) should be compared with the share market value of the company that was but R5.477bn on 24 August 2016. The capital raising exercise is a large one and the success with which this extra capital is utilised will determine the future of the company.

The discount itself makes it very likely that shareholders, established or newly introduced, rather than the underwriters, will sell or take up their rights that will have some attractive positive value. The larger the discount for any given share price, the more valuable will be these rights (all other influences on the share price remaining unchanged – which they are unlikely to do.). These rights will sell for approximately the difference between the R4 subscription price and the value of the shares to which the rights are attached, between 2 September and until the rights vest on 16 September. The higher or lower the PPC share price between now and then, the more or less will be the value of the right to subscribe at R4, though such rights can only be traded after 2 September, when the share price will fall to reflect the larger number of shares to be issued.

The circular accompanying the Final Terms of the Rights Issue refers to a theoretical value of the shares once they begin trading after 16 September as R5.92 per share, that is given the share price on the day of the announcement, of R8.99. A better description of this theoretical value would be to describe it as the break-even price of the shares. This is the price that would enable shareholders or underwriters to recover the additional R4bn they will have invested in the company when the shares trade ex-rights. In other words it is the future price for the 1.6 billion shares in issue that would raise the market value of the company by an extra R4bn. equivalent to the extra capital raised – or from the R5.66bn it was worth on 23 August to R9.66bn.

Since the additional R4bn raised by the company is assured by the underwriters, the question the shareholders will have to ask themselves is whether or not the extra capital they subscribe to at R4 per share will come to be worth more than R4 per share plus an extra – say 15% p.a. – in the years to come. 15% is the sum of the risk free rate, the return on a RSA 10 year bond of about 9% plus an assumed equity risk premium of 6% p.a., being the returns they could expect from an alternatively risky investment. If the answer is a positive one, they should take up their rights, and if not they should sell their rights to others who think differently. Though any reluctance to take up the rights will reduce their value.

Until the rights offer closes on Friday 16 September and until shareholders have made up their minds to follow their rights or sell them, the target they will be aiming at (for their proportionate share of an extra R4bn of value) will be a moving one, as the PPC share price changes and as both the shares and the rights trade between 2 September and 19 September 2016. The higher (lower) the share price between now and then the higher (lower) will be this break even share price1. The PPC share price closed on Friday 26 August at R8.75, reducing the breakeven price from R6 marginally to R5.91 per share.

The value of a PPC share hereafter, initially with and later without rights, will depend on how well its managers are expected deploy the extra capital they will have at their disposal both now and in the future. Reducing the debt of the company by R3bn, as intended, appears necessary to secure the survival of the company. This reduction in debt will reduce its risks of failure and perhaps add value for shareholders by reducing for now the risk-adjusted returns required by shareholders. That is to reduce the discount rate applied to future expected cash flows.

What however will be the most decisive influence on the PPC share price over the next 10 years or more will not be its capital structure (more or less debt to equity) but the return on the capital it realises and is expected to realise. How the capital is raised, be it from lenders, new shareholders or from established shareholders in the form of cash retained, will be of very secondary importance. Unless, that is, the company again fails to manage its debt and equity competently – a surely much less complicated task than managing complex projects. 29 August 2016


1The breakeven price (P2) can be found by solving the following equation P2=(S1*P1)+k))/S2, where S1 is the number of shares in issue before the rights issue (602m) in the case of PPC and S2 the augmented number (1602m) while the additional capital to be raised, k, is R4bn. P1 is the share price before the rights can be exercised (R5.92 on 23 August) change or the share price plus the market value of the right – in the PPC case the right to subscribe to an extra 1.6 shares at R4 a share.

Competition policy in SA – in whose interest is it?

Mergers and acquisitions (M&A) are vital ingredients for a well performing economic system. Through M&A, the better-managed firms take care of the weaker performers leading to better use of the economy’s scarce resources. The success of M&A will be measured in the returns on the capital (debt and equity capital) so risked. The shareholders and the managers acting for the acquiring companies must hope for returns above the required risk-adjusted returns set for them in the market place. If they succeed, they will be improving the economy (improving the relationship between inputs and outputs) and adding wealth for their shareholders. There is a clear public interest in successful M&A activity.

But any such agreement reached between the buyer and seller of a whole company (or part of it) has a further hurdle to clear. The government may decide that the planned merger should be disallowed in a different public interest or, if permitted, that it should be made subject to conditions that can make the takeover more expensive and the larger business less successful. Increasingly, this has become the practice of competition policy in SA, especially when the intended acquirer is a large foreign-owned company.

What has been demanded of the foreign acquirer, even when the intended merger is judged to increase, rather than reduce potential competition in the market place, can only be described as a shakedown exercised by the competition authorities. For example, the demands made of Walmart in its takeover of Massmart and, more recently, in similar demands made of AB Inbev in its takeover of SABMiller. These are unpredictably expensive interventions in business relationships that add to the cost and risks of M&A. They will discourage such attempted activity and the ordinarily welcome flows of financial and intellectual capital accompanying M&A initiated offshore. It is perhaps good politics, but very poor business practice that is unhelpful to economic growth.

Perhaps more damaging to the economy and to the owners of businesses are the now usual conditions for approval, which stipulate that employment be guaranteed at pre-merger levels. Such demands must make it harder to realise the cost savings that a merger might otherwise make possible. A competitive economy, actively competing for labour and capital, so as to improve returns on capital and the productivity of labour through M&A, is inconsistent with guaranteed employment. There is a public interest in employing labour most productively and in labour mobility – not in guaranteed employment that benefits a few private interests.

In recent rulings, the Competition Commission has extended its reach further to the boardroom, in effect instructing merger intending managers and owners how to run their operations. To approve the merger of Southern Sun Hotels with listed hotel-owning company Hospitality, it demanded that the latter be managed independently by its own executive team “.. that would not include anyone who is involved in management in any capacity at Southern Sun”. Thus the rights and responsibilities that come with ownership were truncated. It came to a similar recent ruling, for similar reasons, the presumed sharing of presumed confidential information, on African Rainbow Capital’s deal to buy 30% of the shares in ooba — a mortgage originator controlled by SA’s biggest estate agencies.

What the Commission seems unable to recognise is that competition of the kind that most effectively challenges established firms will come from innovation and the application of technology, not from current participants and current practice. A good example of this is the large current and future threat to the pricing and other power of hotel owners and operators in Cape Town that comes from Airbnb, which has a large and growing presence in the Cape Town market.

The competition authorities in SA are in danger of overreach, if not hubris. It would benefit from a better understanding of and more respect for dynamic market forces and be much less inclined to interfere with them. And so would the economy and its growth prospects.

Tough Love

National Minimum Wage Panel – do your duty and offer tough love and resist the arguments for economic miracles.

The government has (thankfully) decided to kick the National Minimum Wage (NMW) into touch. The hope must be that the panel come to advise that any NMW high enough to make a meaningful difference to the circumstances of the working poor, is a very bad idea. It’s a bad idea because it cannot offer much poverty relief (to those who keep their jobs) without destroying the opportunity for many more in SA, particularly the young and inexperienced and those outside the cities, to find work.

The problem is that even many of those who find work (mostly in the cities), at the lower end of the wage scales, remain poor. The working poor in SA have been defined as those who earn less than R4000 per month. Yet the problem is that most of those with jobs in SA earn much less than this, while a large number of potential workers are unemployed and earn no wage income at all.

According to a comprehensive recent study of the labour market in SA by Arden Finn for the University of the Witwatersrand, 48% of all wage incomes, representing 5m workers, fell below R4000 per month in 2015 and 40% earned  less than R3000 per month, about 2.7m workers out of a total employed of about 13m. The proportion of those employed who fall below R4000 are much higher in the rural areas, higher in agriculture (nearly 90%) and domestic services (95%). In mining, 22% of the work force earned less than R4000 per month in 2015, while in the comparatively well paid and skilled manufacturing sector, about 48% of the work force were estimated to earn less than R4000 per month.

How many would lose their jobs? And how many would hold on to them to receive the promised benefits of higher minimum wages? These are the numbers that would have to be estimated by the panel. They would have to allow for all the other independent forces at work, other than wages, that could favourably or unfavourably influence numbers employed. For those on the panel who believe that SA can repeal the laws of supply and demand for labour and that wages have little to do with what workers are expected to add to business revenues, and so higher minimums can happen without very unhelpful employment effects – there is a question they will have to answer.

If a higher NMW can make such a helpful difference to poverty without serious consequences for the unemployed and their poverty, why not set the NMW ever higher?  If an NMW of R4000 a month is not enough to escape poverty, why not double or treble these minimums? They must surely agree that the number of job losses would increase as the distance between current wages and the intended minimums widened. Agree, that is, that the only way to avoid extra unemployment would be to set the minimums very close to actual minimum wages in the very different locales where they are earned, a symbolic rather than a practical gesture.

The panel could turn to the well-known relationship between employment, employment benefits and output (measured as value added or contribution to GDP) in the formal sector of the SA for evidence that improved employment benefits, for those who keep their jobs, leads to less employment for the rest. GDP has grown consistently while employment has stagnated and the numbers unemployed have risen as the potential work force has grown. Yet the real wage bills have grown more or less in line with real GDP. In other words, the percentage decline in the numbers employed has been less than the percentage increase in employment benefits paid out. Nice work if you can get it and too many South African have not got it. And wages and profits have maintained their share of value added. Firms have adapted well to more expensive labour; the unemployed have not been able to do so. Their interests should be paramount in policy action.

An NMW set well above market related rewards will reinforce such trends. It will not be fair to the non-working poor nor promote economic growth, the only known way to truly relieve poverty and raise wages over time. It is the duty of economists to practice tough love – to recognise the inevitable trade-offs should a NMW be introduced. We can but hope the panel will do its duty and resist politically tempting actions that have predictably disastrous effects. After all, if we knew how to eliminate poverty with a wave of a wand (the NMW is such a wand) we would have done so a long while ago.


Explaining the strength in emerging equity markets

This year is proving a very good one for emerging markets (EM) after years of lagging behind the S&P 500 (see figure 1 below).


Capital flows being good for EM equities (and bonds) have also been helpful for EM currencies, including the rand, and so the JSE, while it usually performs in line with the EM when measured in US dollars, has offered well above average EM returns to the offshore investor on the JSE this year (see Figure 2 below). As we have explained in earlier reports, strength in EM equities and bonds has a consistently favourable influence on the exchange value of the rand and most other EM currencies.

The question then arises of why are EM capital markets attracting revived interest from global investors? Is it simply the search for yield in a low yield, low expected return world? Or is there more substance to the switches to EM investors are making in the form of improved economic outcomes and better growth in EM economies and earnings from EM-listed companies to come. We provide some answers below that indicate the substance behind the strength in EM equities, including those listed on the JSE.

The underperformance of EM equities since 2011 has been accompanied- by weak earnings – earnings per share that have lagged well behind those generated by the S&P 500 Index. As may be seen in figure 3, S&P 500 earnings measured in US dollars compared to EM or JSE earnings in early 2010 , are more than 80% ahead, when measured in US dollars. The underperformance of EM equities has been highly consistent with this underperformance, as has the strength of the S&P been consistent with the impressive recovery in S&P earnings.


It should however be noted below in Figure 4 that EM and JSE earnings, having suffered a severe decline in 2015 led by lower commodity prices, appear to have reached a cyclical trough and are now increasing from their low base, while S&P earnings are also now pointing higher, after declining since early 2015. This revival in average earnings must be regarded as helpful for equity valuations generally, especially in a world of very low interest rates. That EM and S&P share prices moves have been highly correlated in 2016 is consistent with a similarly higher trajectory for earnings, especially should recent trends be sustained, as has been indicated.

The similar path of JSE earnings and that of the EM average – of which the JSE contributes only a small part, about 8% – should be recognised. It goes a long way to explain the similar direction of the EM Index and that of the JSE, when measured in US dollars. The JSE behaves as an average EM equity market because JSE earnings compare very well with the EM average. This is because JSE-listed companies, including industrial companies, are highly exposed to the global economy, even more than the SA economy.


In figure 5 below, we compare the average prices investors have been paying for average earnings. As may be seen, investors in the S&P Index have enjoyed a significant increase in the average P/E multiples and seen the Index re-rate when compared to the multiples attached to EM earnings. Such reactions are entirely consistent with impressive past performance, especially when accompanied by low interest rates that surely add to the present value of future earnings or cash flows expected. But the fact that S&P earnings have become expensive by the standards of the past and EM earnings can be acquired significantly cheaper than S&P earnings, will have attracted interest in EM compnaies, especially when the global economic and earnings prospects appear to be improving.


One sign of an improved economic state can be found in the Citibank surprise Index calculated for the 10 largest economies. As we show below in figure 6, the high frequency economic data has become much more encouraging. Expectations are being surprised on the upside. These more positive surprises are clearly helping to lift the equity markets. The economic news has been improving, surprisingly so, and global equity markets are responding accordingly. The strength in equities is well explained by economic fundamentals, especially so when the threat of higher interest rates seems so distant. 15 August 2016


The rand is mostly well explained by global forces. Yet SA specific risks have also declined to add further value to the ZAR. Long may these trends persist.


The rand has enjoyed a strong recovery in recent weeks. We say enjoyed advisedly. A strong rand is very helpful to households and their spending. It means less inflation (even deflation of the prices of goods or services with high import content or of those that compete with imports) and so less inflation expected in the prices firms set for their customers. If rand strength or even rand stability can be maintained, lower interest rates will follow to further encourage spending. Households directly account for over 60% of all spending, while spending by firms that supply households on capital equipment and their wage bills will take their cue from household demands. Any hope of a cyclical recovery of the SA economy depends crucially on the now more helpful direction of the rand.

Exporters may see their profit margins contract with a stronger rand. However, crucial for them will be the reasons for rand strength or weakness as the case may be. If the rand appreciates because the global economy is gathering momentum, or is expected to do so, then rand strength may well be accompanied by higher US dollar prices for the metals and minerals they sell on world markets, and vice versa, rand weakness might well be accompanied by or even caused by lower commodity prices. In which case revenues gained via a depreciated rand may well be offset by weaker US dollar prices. As has been the case for much of the past few years. Falling dollar prices for metals and minerals for much of the past few years – other than gold- have accompanied the weaker rand. And to some extent can be held responsible for the weaker rand.

Fig 1; Commodity Price Index (CRB) in USD and in ZAR

fig1

It is therefore important to identify the sources of rand weakness or strength. It is important to recognise the difference between global forces and SA-specific events that have driven or can drive the rand weaker or stronger, even though the implications for the state of the SA economy of rand strength or weakness, from whatever cause, global or SA specific, will be similar. The more risky (uncertain) the outlook for the global and SA economies, the weaker the rand and vice versa whatever the sources of more or less risk- be they Global or South African.

However if the cause of rand weakness is SA in origin – attributable to economic policies or expectations of them – those responsible for currency weakness and a consequently weaker economy can be held accountable by the democratic process. Policy makers may lose support, enough to change the direction of policy direction that could add rand strength. The rand strength that has accompanied the local government elections and a politically damaged Presidency are pointing in this direction and have made disruptive interference in SA’s fiscal policy settings less likely. Hence an extra degree of ZAR strength for SA specific reasons.

We offer an analysis that clearly can identify the causes of rand weakness or strength as either global or SA specific. The simple method is to compare the behaviour of the USD/ZAR exchange rate with that of nine other emerging market (EM) currencies that can be expected to be similarly influenced as is the ZAR by global forces. We compare an Index of these USD/EM exchange rates with that of the USD/ZAR exchange rate below (The exchange rates included in the Index are all given the same weight. The Index is made up of the Turkish Lira, Russian Ruble, Hungarian Forint, Brazilian Real, the Mexican, Chilean, Philippine Pesos, Indian Rupee and the Malaysian Ringgit). It may be seen that the weakness of the rand since 2013 has been accompanied by EM currency weakness generally. Much of the rand depreciation of recent years may therefore be attributed to global not SA specific influences on capital flows and exchange rates. It has been an extended period of dollar strength as much as EM weakness. The US dollar has also gathered strength vs the euro and the yen over this period.


Fig.2; The USD/ZAR and the USD/EM Average, 2013-2016 (Daily Data)

fig2

Source; Bloomberg and Investec Wealth and Investment


However it has not been only a matter of USD strength. As may be seen below when we compare the performance of the ZAR to the EM basket there have been periods of rand weakness – from January 2013 to September 2014- followed by a period of relative rand strength that turned into significant weakness in late 2015 when president Zuma frightened the market for the rand and RSA’s with his surprise sacking of the then Minister of Finance Nene. As may also be seen the recovery of the rand dates from late May 2016 and has gained significant momentum recently with the outcomes, expected and realized in the Local Government elections of August 3rd 2016. Since the close of trade on Friday 5th August the ZAR has gained 2.6% vs the USD while the nine currency EM average exchange rate is about 0.90% stronger vs the USD.

Fig.3; Performance of the USD/ZAR Vs the USD EM average. (Daily Data; January 2013=1)

fig3

Source; Bloomberg and Investec Wealth and Investment

A similar picture emerges when we trace the Credit Default Swaps for RSA dollar denominated debt and high yield EM debt in Fig 4. The CDS spread is equivalent to the difference in the USD yield on an RSA or EM 5 year bond and that of a five year US Treasury Bond. The credit rating of RSA debt in a relative sense can be expressed as the difference between the cost of insuring RSA debt against default Vs the cost of insuring high yield EM debt. The larger the negative spread in favour of RSA’s, the more favourable SA’s credit rating compared to other EM borrowers. As may be seen the RSA rating deteriorated in 2015 and is now enjoying something of an improved rating. Though the credit spreads indicate that there is some way to go before RSA credit attained the relative and absolute standing it had in 2012.

Fig.4; SA and Emerging Market Credit Spreads.

 fig4

Source; Bloomberg and Investec Wealth and Investment


To take the analysis further we have run a regression equation that explains the USD/ZAR exchange using the USD/EM exchange rate as the single explanatory variable. The fit is a statistically good one as may be seen in figures 5 and 6.  The EM currency basket explains over 90% of the USD/ZAR daily rate on average over the three and a half years. But as may be seen in figure 4, the ZAR was significantly undervalued in late 2015. The predicted value of the USD/ZAR at 2015 year end, given the exchange value of the other EM currencies might have been R14.86 compared to actual exchange rate at that fraught time of R16.62. Or in other words SA specific risks had made the USD almost R2 more expensive than it might have been at the end of 2015.

Fig.5; Value of ZAR compared to EM Basket on 1/1/2016.

fig5

Source; Bloomberg and Investec Wealth and Investment

As we show in figure 5 this valuation gap had disappeared by August 5th 2016.  The USD/ZAR exchange rate is now almost exactly where it could have been predicted to be by global forces alone. That is to say the current exchange value of the ZAR is precisely in line with other EM exchange rates.


Fig.6; Value of ZAR compared to EM Basket on 8/8/2016 Daily Data (2013-2016 August)

fig6

Source; Bloomberg and Investec Wealth and Investment

The future of the ZAR will, as always, be determined by the mix of global and SA specific forces. At current exchange rates it may be concluded that there is no margin of safety in the exchange value accorded the ZAR. It will gain or lose value from this level with changes in SA risk or with the direction of global capital flows that determine the value of EM currencies, bonds and equities.

The global capital flows acting on the ZAR are well represented by the direction of the EM equity markets. The ZAR and other EM exchange rates will continue to take their cue from flows into and out of EM equity and bond markets. In figures 7 and 8 below we show how sensitive has been the relationship between daily moves in the ZAR and by implication other EM exchange rates, to daily moves in the value of EM equities – represented by the benchmark MSCI EM Index. We show a scatter plot of these daily percentage changes below. This relationship has been particularly close recently as may be seen in the figures below.

Fig 7. Daily % Moves in the MSCI EM Equity Index and the USD/ZAR,  June 1st 2016- August 8th 2016

fig7

R=0.75;   R squared =0.56[1]

Source; Bloomberg and Investec Wealth and Investment

Fig 8: Daily % Moves in the EM Currency Index and the USD/ZAR; January 1st 2013 – August 8th,2016

fig8

R= 0.72; R squared = 0.52

Source; Bloomberg and Investec Wealth and Investment

A further feature of global equity markets this year has been the highly correlated movements in the S&P Index and EM Indexes including the JSE- when valued in USD. (See figure 9 below) Also notable is the extent to which the JSE, when valued in USD has outperformed other EM equities as well as the S&P tis. This has come after years of EM and JSE underperformance of a similar scale- especially when measured in strong USD.

Fig.9;  Equity Market Trends; USD. Daily Data 2016 (January 2016=100)

fig9

Source; Bloomberg and Investec Wealth and Investment

Fig.10; Equity Market Trends. USD.  Daily Data 2013-2016 (January 2016=100)

fig10

Source; Bloomberg and Investec Wealth and Investment

These recent trends are a reflection of less rather than more global risk aversion- and so a search for value in equities rather than in the defensive qualities of global consumer facing companies paying predictable and growing dividends. For the sake of the SA economy we can only hope that such trends persist. If they do the opportunity may soon present itself to the Reserve Bank to lower interest rates. It should do so and immediately stop predicting higher interest rates to come. The Treasury moreover should resist the opportunity a rand aided lower petrol and diesel price will give it to raise fuel taxes. A much needed cyclical recovery will take less inflation and lower interest rates. The opportunity a stronger rand may give to lower interest rates and to avoid higher tax rates should not be wasted.

[1] R is the correlation co-efficient. The R squared is for a least squares equation  dLog(ZAR) = c+ dLog(EM) + e

Features of the SA monetary system

We continue from our discussion of “helicopter money” (see Point of View: Helicopters in a different form, 1 August 2016) with a description and analysis of the SA monetary system. The Reserve Bank of SA has not practiced quantitative easing. By contrast, SA banks rather than being inundated with cash and excess reserves, have been kept consistently short of cash in support of the interest rate settings of the Reserve Bank. SA banks borrow cash from their central banks rather than hold excess cash reserves with it.

The SA Reserve Bank has not practised quantitative easing (QE). SA banks have not been inundated with cash derived from asset purchases in the securities market as had been the case in the developed world. Rather, SA monetary policy in recent years has practised a pro-cyclical policy with interest rates rising and subdued base money supply growth.

SA banks do not therefore hold reserves in the form of deposits at the central bank in excess of the reserves they were required to hold. As may be seen in the figures below, by contrast with their developed world counterparts, the SA banks are kept short of cash through liquidity absorbing operations by the Reserve Bank and, more importantly, by the SA Treasury.

Also to be noted is the liquidity provided consistently to the banking system by the Reserve Bank in the form of repurchases of assets from them as well as loans against reserve deposits. Rather than holding excess reserves over required cash reserves, the SA banks consistently borrow cash from the Reserve Bank to satisfy their regulated liquidity requirements.

It is these loans to the banking system that give the Reserve Bank full authority over short-term interest rates. The repo rate at which it makes cash available to the banks is the lowest rate in the money market from which all other short term interest rates take their cue. Keeping the banks short of cash ensures that changes in the policy-determined repo rate is made effective in the money market – that is, all other rates will automatically follow the repo rate because the banks are kept short of cash and borrow reserves rather than hold excess cash reserves.

In the US, the Fed pays interest on the deposit reserves banks hold with the Fed. The ECB, by contrast, applies a negative rate to the reserves banks hold with it. In other words, European banks have to pay rather than receive interest on the balances they keep with the ECB.

The cash reserves the banks acquire originate mostly through the balance of payments flows. Notice that the assets of the Reserve Bank are almost entirely foreign assets. Direct holdings of government securities are minimal, as reflected on the Reserve Bank balance sheet. When the balance of payments (BOP) flows are positive, the Reserve Bank adds to its foreign assets and when negative runs them down. The Reserve Bank buys foreign exchange in the currency market from the banks (and credits their deposit accounts with the Reserve Bank accordingly) or sells foreign exchange to them and then draws on their deposit accounts with the Reserve Bank as payment.

And so when the BOP flows are favourable, the Reserve Bank will be adding to its foreign assets and so to the foreign exchange reserves of SA via generally anonymous operations in the foreign exchange market. In so doing it is acting as a residual buyer or seller of foreign exchange and as such will be preventing exchange rate changes from balancing the supply and demand for foreign exchange. In a fully flexible exchange rate no changes in foreign exchange reserves would be observed, only equilibrating movements in exchange rates. The exchange rate will strengthen or weaken to equalise supply and demand for US dollars or other currencies on any one trading day. The Foreign Assets on the Reserve Bank balance sheet have increased consistently over the years. Hence the balance of payments influence on the money base- on the cash reserves of the banks- has been a strongly positive one.

Without intervention in the money market, these purchases of foreign exchange by the Reserve Bank would automatically lead to an equal increase in the cash reserves of the banking system. Their deposits at the Reserve Bank would automatically reflect larger deposit balances as foreign exchange is acquired from them and their clients. This source of cash however has been offset by SA Treasury operations in the money and securities markets.

To sterilise the potential increase in the money base of the system (defined as notes plus Bank Deposits at the central banks less required reserves) the Treasury issues more debt to the capital market. The debt is sold to the banks and their customers – they draw on their deposits to pay for the extra issues of debt – and the Treasury keeps the extra proceeds on its own government deposit account with the Reserve Bank. Provided these extra government deposits are held and not spent by the Treasury – as is the policy intention – the BOP effects on the money base (on bank deposits or reserves) will have been neutralised by increases in government deposits. (The money base only includes bank deposits with the Reserve Bank. Government deposits are not part of the money base.)
It is to be noted in the figure representing Reserve Bank Liabilities, how the Government Deposits with the Reserve Bank have grown as the Foreign Assets of the Reserve Bank have increased – extra liabilities for the Reserve Bank offsetting extra foreign assets held by the Reserve Bank. It is of interest to note that about half of the Treasury deposits at the Reserve Bank are denominated in foreign currencies.


The net effects of recent activity in the money market has meant much slower growth in the money base and the money and bank credit supplies over recent years. This slow growth has been entirely consistent with weak growth in aggregate spending and GDP. Note below how rapidly money and credit grew in the boom years of 2004-2008.


One test of monetary policy is its ability to moderate the amplitude of the business cycle. The strength of the boom between 2005 and 2008 and the subsequent collapse – and the persistently slow growth in money credit and spending after 2011 – indicates that monetary policy in SA has not been notably counter-cyclical. Nor can it claim much success in limiting inflation.

The problem for monetary policy in SA is the independent (of monetary policy settings) role played by the exchange rate in determining prices. Inflation has followed the exchange rate rather than money supply and interest rates. And the exchange rate movements have been dominated by global events- flows into and out of emerging market currencies (of which the rand is one) in response to global risk.

Economic activity picked up when inflation subsided between 2003- 2005, because the exchange value of the rand recovered strongly and because interest rates declined with less inflation. Inflation accelerated in 2008-9 as the exchange rate weakened and remained high with persistent exchange rate weakness. Interest rates were moved higher after 2014 as inflation picked up and the economy slowed down, further weakening demand without appearing to do anything to slow down inflation. These dilemmas for monetary policy will persist if exchange changes remain largely driven by global forces rather than SA interest rates.

An influence on this money multiplier in SA has been changes in the banks’ demands to hold notes in their tills and ATMs. The ratio of notes held by the banks to all notes in circulation fell away sharply after 2000, thus adding to the money multiplier. This ratio has increased more recently, so reducing the money multiplier. The Reserve Bank influenced this demand for notes by the banks by deciding in the early 2000s not to include notes held by the banks qualifying as required cash reserves.

Helicopters in a different form

It is not helicopters but old fashioned government spending – funded by debt or cash – that will be called into action to get developed market economies going again.

The notion (metaphor) of helicopter money was first invoked by the foremost monetarist Milton Friedman and revived by Ben Bernanke, later Governor of the US Fed, to indicate how central banks might overcome a theoretical possibility that has in reality become a very real problem for central bankers today. The problem for the central banks of the US, Europe and especially Japan is that the vast quantities of extra money they have created in recent years, quantities of money that would have been unimaginable before the Global Financial Crisis of 2008, have been bottled up in the banks who have held on to the extra cash received rather than used it to make loans that would have helped their economies along.

The cash was received by the banks or their customers from the central banks in exchange for the government and other securities bought from them in the credit markets and directly from the banks themselves. The cash shows up as extra deposits held by the private deposit taking banks with their central banks – the bankers to the banks. It has been a process of money creation described as quantitative easing (QE) that has led to trillions of dollars, euros or other currencies of extra assets held by central banks – matched by an equal growth in their liabilities, mostly to the banking system in the form of extra deposits held with the central bank (see below).

But why did these central banks create the extra cash in such extraordinary magnitude? In the first place in the US it was to rescue the banking and insurance systems from collapse in the face of their losses incurred in the debt markets that led to the failure of a leading bank Lehman that might have brought down the financial system with it. In Europe it was to prevent a meltdown in the market for most European government debt that could have brought down all lenders to government – not only banks but pension funds and insurance companies and their dependents. In Switzerland the cash came from purchases by the central bank of dollars and euros that flooded into the Swiss banking system and would otherwise have driven the Swiss Franc even stronger than it has become. In Japan the extra cash was always designed to offset the recessionary and deflationary forces long plaguing the economy.The original purpose of QE in the US and Europe was to prevent a financial collapse. The second related reason was to fight recession and deflation. Extra money and the lower interest rates accompanying it are meant to encourage extra spending and extra lending to the same purpose. Extra money and lower interest rates usually do this to an economy – stimulate demand. Usually with extra demand comes higher prices and inflation.

The banks receive the extra cash directly from the central bank in exchange for the securities previously held on their own balance sheets or who may receive the extra central bank cash firstly with the deposits made by their clients when banking the proceeds of their own asset sales. Their clients deposit the cheques or, more likely, EFTs issued by the central bank in their private banking accounts and the banks then receive an equivalent credit on their own deposit accounts with the central bank as the cheques on the central bank are cleared or the EFTs’ given electronic effect. And so in this way, through asset purchases by the central bank acting on its own initiative, extra central bank money enters the financial system, a permanent increase that can only be reversed when the central bank sells down the securities it has bought.

The banks have an option to hold the extra cash rather than lend it out to firms or households, who would ordinarily spend the cash so made available. And banks in the US, Japan, England and Europe and Switzerland have done just this in an extreme way. They are holding the extra cash supplied to them by their central banks as additional cash reserves way in excess of the requirement to hold reserves.

The US Money Base shown below is the sum of currency and bank deposits (adjusted for reserve requirements) held with the central bank (see below the US Money Base that has grown in line with excess reserves held by the Fed and the extraordinary growth in the deposits held by Swiss banks with the Swiss National Bank).


And so the call for the imaginary helicopters to bypass the banking system and jettison bundles of cash that people would pick up gratefully and spend on goods and services so reviving a stagnant economy (stagnant for want of enough demand, not for want of potential output and employment that is the usual economic problem).

The helicopters however will have to take a different form. They will have to be ordered by governments and budgeted for in Congresses or Parliaments. Central banks can buy assets in the financial markets and directly from banks. They cannot order up government spending that they can help fund. That is the job of governments who decide how much to spend and how to fund their spending. Governments can fund spending by taxing their citizenry, which means they will have less to spend. This is never very popular with voters. They can fund government spending by genuine borrowing in the market place – competing with other potential borrowers – crowding them out by offering market-related interest rates and other terms to lenders. Or they can fund their expenditure by calling on the central bank for loans that, as a government agency, they cannot easily refuse to do.

In taking up the securities offered to them by the government the central bank credits the deposit accounts of the governments to the same (nominal) value as the debt offered in exchange. Both the assets and deposit liabilities of the central bank then increase by the same sum as the extra debt is bought by the central banks and the government deposit credited. As the government agencies write cheques on their deposit account – or do the EFTs on them – the government deposit runs down and the deposits of the private banks with the central bank run up. In this way, the supply of cash held by the private sector increases, just as it does in the case of QE.

And the private banks and their customers will have the same choice about what to do with the extra cash held on their own balance sheets. Spend more, lend more or pay back debts or hold the extra cash, as they have largely been doing.

But there is an important difference when the money is created to fund extra government spending. Spending by government on goods services or labour or perhaps welfare grants will have increased, so directly adding to aggregate spending. By spending more, the revenues of business suppliers and the incomes of households will have risen with their extra money balances received for their services or benefits. This is why spending by government – funded with extra money is usually highly inflationary – can be highly inflationary as it was in the Weimar Republic of Germany after World War 1 or as it was in Zimbabwe not so long ago or as it is now driving prices higher in Venezuela.

But the current danger in the West is deflation, the result of too little rather than too much spending. Inflation seems very far away, as revealed by the very low or even negative interest rates offered by a number of governments to willing lenders for extended periods of time. For some government issuing debt – at negative interest rates that produces an income for the government – is cheaper than issuing cash that gives only a zero rate of interest.

The continued weakness of developed economies suffering from a lack of demand, despite low interest rates, calls for money and debt and or money creation by governments. The call for less austerity or more government spending relative to taxes collected is being heard in Japan. It is a voice being sounded loud and clear in post Brexit Britain. The Italians are very anxious to use government money to revive their own failed banking system. The Germans with their own particular inflation demons will however resist the idea of central banks directly funding governments, but for how long? Hillary Clinton promises spending on infrastructure. Donald Trump worries about government debt – for now as far as we can tell.

How long can weak economies and very low interest rates and abundant supplies of cash co-exist? It will not take helicopters but unhappy voters to stimulate more government spending, funded with cheap debt or cash. And the voters appear particularly restless on both sides of the Atlantic and, for that matter, the Mediterranean. 1 August 2016

A fuller account of the above discussion can be found here: Money supply and economic activity in South Africa – The relationship updated to 2011