Politicians propose spending and revenue plans – but the bond market disposes and not always kindly. In the UK plans to combine tax reforms that only work gradually with an immediate massive increase in subsidizing the consumption of energy with borrowed money was apparently a step too far for lenders to HMG and the governing party.
Yet long term interest rates in the US and Europe were also rising rapidly. In Germany Ten-year money yielding negative rates in January had increased to 2% p.a. by October. US US Treasury Bonds that offered 1% p.a. in early January 2022 now yield over 4% p.a. and indeed offer more interest in US dollars than the much battered 10 year gilts.
Long Term (10 Year) Interest Rates in the US, UK and Germany. Daily Data to October 25th
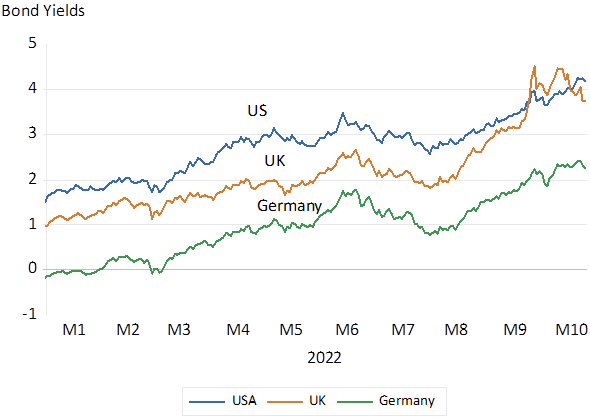
Source; Bloomberg and Investec Wealth and Investment
Blaming all this wealth destruction on a potentially profligate UK government is further complicated by the fact that not only were nominal interest rates on the rise – more so were real rates. Real ten-year yields in the US now deliver a yield of close to 2% p.a. – they offered a negative 1% in January 2022. They now exceed the returns on a UK ten year inflation linker that has increased from a negative -3% in early 2022 to the current much higher 0% p.a. Equivalent Inflation protected German Bunds also now offer about 0% p.a. – compared to -2% early in 2022.
Real Inflation Protected 10 year Bond Yields
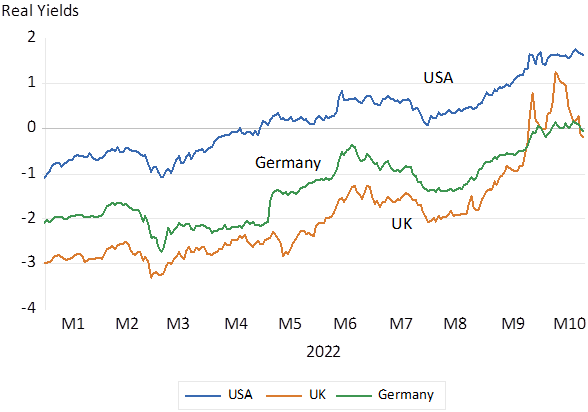
Source; Bloomberg and Investec Wealth and Investment
It is the real cost of funding developed government debt that have been driven much higher this year -not more inflation expected. Expectations of more inflation to come would have found expression in higher interest rates for inflation exposed lenders and not necessarily in higher real yields. Expected inflation measured as the difference in nominal and real yields for equivalent bonds has not increased this year in the US,UK or Europe. Inflation expected in the in the UK over the next ten years has remained about 4% p.a. this year, higher than inflation expected in Germany and the US that have varied about the 2.5% p.a. rate.
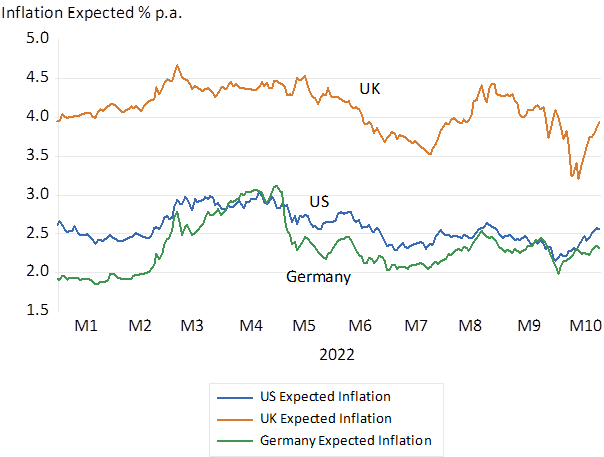
Source; Bloomberg and Investec Wealth and Investment
It is not easy to explain why real interest rates in the developed world have risen so significantly this year. Additional competing demands for capital to fund capital expenditure that might ordinarily help explain higher costs of capital and rewards for savers have been notably absent. An alternative explanation is that greater risks to lenders has forced yields higher and bond prices lower to compensate lenders for assuming extra risks – that more risk demands higher returns and forces bond values lower. The risks posed by central banks struggling to cope with inflation have made bond markets far more volatile. The negative correlation between the increases in US bond market volatility Index and the Global Bond Index is strikingly large this year. The link between increased volatility and lower bond and equity valuations seems highly relevant. If it is the risk of central bank policy errors that have driven up required returns it may be hoped that a more predictable Fed will be accompanied by lower government bond yields.
US Bond market volatility and the Global Bond Market Index
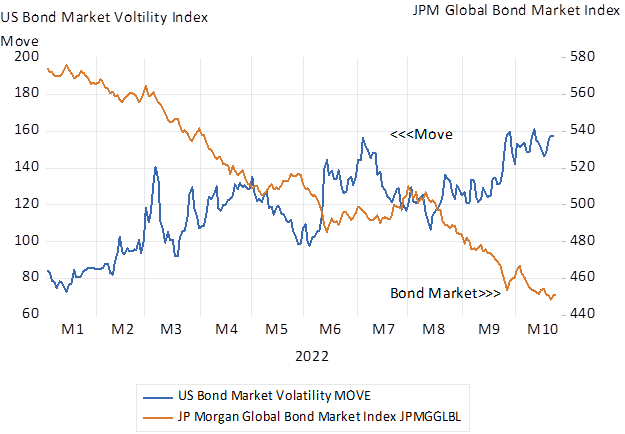
Source; Bloomberg and Investec Wealth and Investment
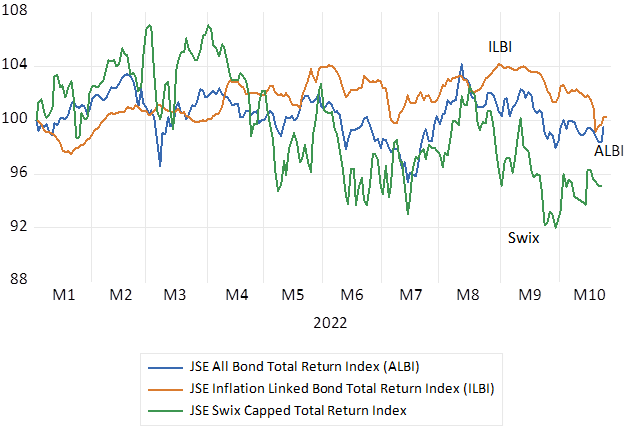
Thanks to the inflation panicking Fed, government bonds have proved anything but a safe haven for pension and retirement funds in the developed world. But in high bond yield, high risk South Africa, RSA bonds have performed much better than equities for pension and retirement funds. The increase in long bond yields have been offset by much higher initial yields, leaving the bond market total return indexes in rands unchanged year to date while the JSE Swix Index has cost investors about 4% this year. RSA 10 year nominal yields started 2022 at 9.73% and have risen to 11.5% while the real yield on the inflation protected bonds are up from 3.63% to an elevated 4.6% p.a.
JSE Bond and Equity, Total Return Indexes January 2022=100. Daily Data
Source; Bloomberg and Investec Wealth and Investment
These high yields mean very expensive debt for SA taxpayers and offer high risk premiums to compensate for what has been a seriously deteriorating fiscal stance since 2010. The MTBS just presented represents a serious attempt to regain fiscal sustainability. If the plans are realized the debt to GDP ratios will decline to levels well below that of the US or UK. A primary budget surplus – revenues exceeding all but interest expenses – has come surprisingly in sight. Achieved this would surely represent fiscal sustainability and help bring down RSA yields closer to those of the developed market borrowers.