The Investment Holding Company. How to evaluate its performance and how to align the interest of its managers and shareholders

The importance of recognising economic profit or EVA

Owners of businesses could set their managers a straight-forward task. That is to earn a return on their capital they will deploy to exceed the returns shareholders could realistically expect from another firm in the same (risky) line of business. If the managers succeed in this way, that is realise an internal rate of return on the projects they undertake that exceed these required or break even returns, they will be generating an economic profit for their owners. They will have created what is now widely known as Economic Value Added (EVA) in proportion to the amount of capital they put to work. EVA=I*(r-c) where r is the measure of the internal rate of return, c is the required return or as it is sometimes described as the cost of capital and I is the quantum of capital invested.

Continue reading the full paper here: Applying EVA to the holding company

The restructuring of Naspers has been very well received by the market- place. What does the future hold for its shareholders?

The Naspers value gap (net asset value less market value) has narrowed significantly since the restructuring – which will see a Newco being listed in Amsterdam – was announced to the market. What does this mean for shareholders?

The proposed restructuring of Naspers, first mooted in March and now confirmed in a circular to shareholders on 29 May, has been favourably received by the market. The intention is to restructure Naspers into two linked companies: a Newco (to be named), with a primary listing in Amsterdam and a secondary listing on the JSE, and a new Naspers with its primary listing still in South Africa.

The Newco will hold the international assets of Naspers, including its 31% of Tencent, and will focus on global opportunities. The South African Naspers will have a 73% share of the Newco, will hold the local assets of Naspers and will also pursue investment opportunities – presumably mostly in South Africa.

Naspers shareholders in absolute terms were, at the start of June, about R120bn better off than they were three weeks previously, according to calculations by my colleague Thane Duff of Investec Wealth & Investment. The Naspers share price has outperformed that of Tencent recently.

To explain, the large gap between the net asset value (NAV) of Naspers  (the sum of its parts of which the holding in Tencent dwarfs all the others) and the market value of Naspers (now R1.462 trillion rand) has narrowed by as much as R120bn in recent weeks.

This value gap (NAV less market value – which we can describe as the difference in the value of Naspers were all its assets unbundled to shareholders and its value as an ongoing business) however, remains a considerable R386bn. The value of the Naspers holding in Tencent is currently worth 127% of the market value of Naspers – or as much as R1.85 trillion.

This value gap emerged only in 2015, with the appointment (coincidentally?) of Bob van Dijk as CEO. The value gap has been as much as R800 billion since then and is now close to its post-2015 low. Its further direction will be of crucial importance to shareholders and, one hopes, also the senior managers of Naspers who control its destiny through the high voting shares they own.

Figure 1: Naspers – NAV minus market value (R billion)

1

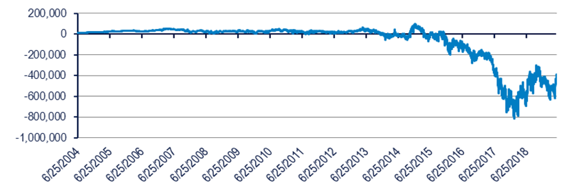
The NAV and market value of Naspers have much in common. Common to both is the market value of the listed assets it owns (Tencent and MailRu being the most important). Also common is the value accorded to the unlisted assets of Naspers, though the value ascribed to these unlisted assets by the directors and included in the balance sheet may well be greater than the value accorded them by the market.

This could be one reason why NAV exceeds market value. What will not be recorded in the Naspers balance sheet or in NAV, but will affect the market value, is the expected cost of running the Naspers head office, as assumed by investors and potential investors. The more shareholders are expected to pay management for their services in the future – including the extra shares to be issued to managers that will dilute their share of the company – the less Naspers shares will be worth today.

A further force that can add to or subtract from the value of a company is the expected value to its shareholders of the business that the company is expected to undertake in the future. The more profitable the investment programme of a company is expected to be, the more value a company will offer its shareholders. Profit in the true economic senses means the difference between the internal rate of return on shareholder capital invested by the firm and its opportunity cost, that is, the returns its shareholders could expect from similarly risky investments made with its capital when invested outside the company. It is the economic, not the accounting profit earned after allowing for the cost of utilising equity as well as debt capital, that matters for the market value.

This cost of their capital for SA shareholders – or the required return on the capital they have entrusted to Naspers – is of the order of 14% a year. This 14% is equivalent to the returns currently available to wealth owners in the RSA bond market (about 9% a year for a 10-year bond) plus a premium, to compensate for the risks that these returns may not be met from the averagely risky SA company.

If Naspers were expected to achieve consistent returns of more than 14% on the large capital investments it makes every year, this programme could be expected to add to its market value. If the market expected otherwise, where the returns on the investments would fall short of their costs, then the investment programme would be expected to destroy the wealth of shareholders. And the more Naspers was expected to invest, the more value destruction would be reflected in its share price: that is, the larger the difference between NAV and market value would become.

We draw on the Credit-Suisse-Holt database for estimates of the recent investment activity of Naspers. The sums invested are large in absolute terms as may be seen in figure 2 below: they’re estimated as of the order of R200bn per annum in recent years. Holt also estimates a currently negative return on capital invested by Naspers – that is, a negative cash flow return on investment (CFROI). If the estimate of the scale of the Naspers is correct, then the investment programme is large enough to account for a large reduction in its market value accorded by a sceptical share market.

The recent sale by Naspers of 2% of its Tencent holding realised nearly US$10 billion. A large additional war chest it must be agreed, but not perhaps enough to result in as much value destruction of the order recently observed.

It suggests that shareholders also attach significant costs to them of the rewards expected to be awarded to managers – perhaps particularly in the form of share issues and options – that over time can consistently dilute their share of the company. If the number of shares issued as remuneration amounts every year to as much as 1% of the shares in issue, this becomes an expensive exercise for shareholders.

Figure 2: Naspers – gross investment

2

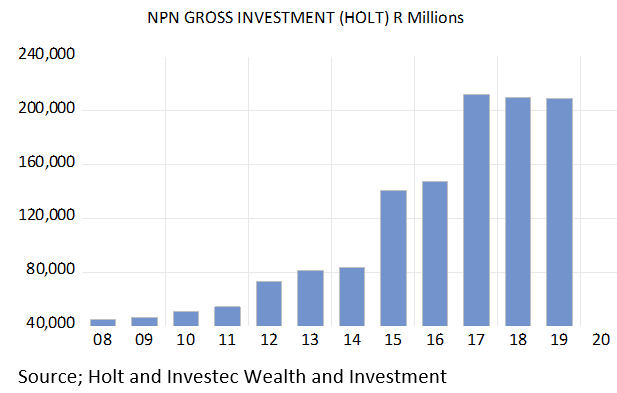
Source: Holt and Investec Wealth & Investment

Will the future be much different for Naspers shareholders?

The critical issue for shareholders in the restructured Naspers remains as before. How successful – how economic value adding or destroying – will its investment programme become, and how generous will the company be to its managers?

There seems little likelihood of much change in behaviour of either kind that would cause investors to change their assumptions about Naspers. The managers are unlikely to become less ambitious in their search for game-changing investments of the kind it made in Tencent. But it will soon be doing so out of two highly interlocked companies.

The international investment activities will presumably be conducted out of Amsterdam. The South African company will also have an investment programme of its own, presumably in South African and African opportunities. One imagines, however, that the larger investments bets will be made internationally by the Amsterdam-listed company, given the much larger opportunity set. Dividends (largely from Tencent) that flow out of Amsterdam back to South Africa will presumably be influenced by the scale of this investment programme.

One anticipates that both companies will not easily convince investors that they are capable of undertaking enough value-adding investments to compensate for the cost of management. Therefore, the Naspers shares will be priced lower (to compensate for value destruction and head office costs) for an expected return in line with market averages. Given a lower than otherwise share price for both companies, both are likely to stand at a discount to NAV and should continue to offer a value gap of significance.

Yet the Amsterdam company will also be priced to offer a market-related return for a company listed in Amsterdam and, under the jurisdiction of the Netherlands, a developed economy. The owners of the 27% free float in the new Amsterdam company will accordingly attach a lower real discount rate to the expected benefits of their share of the company. They will be satisfied with lower expected nominal and real returns, because they will attach less risk to doing business with the government of the Netherlands than with the SA government.

The lower returns required of a company in the Netherlands will be equivalent to the yield on a Netherlands government bond (close to zero, even negative) plus the same 5% risk premium. This makes for a required nominal return of 5% rather than the 14% required of a South African-listed company, where inflation is expected to be much higher and the sovereign risk premium is higher.

The important difference in real expected returns (returns adjusted for expected inflation) is an expected average real 5% in the Netherlands (given no expected inflation, only a risk premium) and a real return in South Africa of about 3% higher (8% real return expected from the average South African company). This 8% real is the equivalent of the 14% nominal required return, less the 6% inflation rate expected in South Africa.

This lower real discount rate makes Naspers shares worth more in Amsterdam than they would be worth in South Africa (all else remaining unchanged) and also worth more for shareholders in Naspers South Africa with their Amsterdam investment.

But all else will not remain the same, including the market value of Tencent shares. This will still be the main force driving the value of the Naspers companies. What could change the game for shareholders – and help further lower the gap between NAV and market value – would be for the company to reward its managers on their ability to close this value gap. That surely would align the interest of managers and shareholders and therefore add value.

An interesting week- unfortunately- but will it lead to the right outcomes?

10th June 2019

It was one of those interesting weeks that optimistic South Africans could have done without. Early in the week we were informed that the economy did even worse than we had expected – going backwards at a 3.2% annual rate in Q1. The news immediately weakened the rand -not only against the USD –  the ZAR also lost about 5% to a peer group of other EM exchange rates. EM currencies generally ended the week stronger against a weaker USD that fell back against the Euro and other developed economy currencies as Fed interest rate cuts loomed.

The spread between declining US bond yields and rising RSA yields widened, indicating that the rand was now expected to weaken further at a 7% p.a average annual rate over the next ten years. Consistently with this rand weakness and all that it implies for the higher prices of imported goods in weaker rands, still more inflation to come was priced into the RSA bond market. Inflationary expectations, as measured by the spread between long dated vanilla RSA bonds and their inflation protected alternatives, widened to about 6.5% p.a for 10 year money. The debt trap that might follow slow growth, less tax revenue, wider deficits and printing money to get out of it – seemed a little closer than it was (See charts below)


Fig.1; The ZAR and the EM Basket (2019=100) Daily Data

1

Source; Bloomberg and Investec Wealth and Investment


Fig.2; The USD/ZAR compared to the USD/EM currency basket. Daily Data (2019=1)

2

Source; Bloomberg and Investec Wealth and Investment


Fig.3: Long dated RSA and USA Government Bond Yield and Risk Spread (RSA-USA 10 year yield) Daily Data 2019

3

Source; Bloomberg and Investec Wealth and Investment


And then to compound the weakness in the ZAR and RSA’s markets the surviving Zuma factions in the ANC later in the week mounted a further diversionary attack on the independence of the Reserve Bank and its anti-inflationary zeal. Further rand weakness and higher interest rates followed.

There was however some consolation for investors on the JSE- including everyone with a SA pension plan. The global plays on the JSE – those companies with  major interests outside SA – acted as they could be expected to do given rand weakness absent emerging market weakness as was the case. They helped meaningfully to diversify SA specific risks (up over 5% in the week as did Resource companies that were up 6.5% – enough to lift the All Share Index by 3.3% by the week-end. (see below)


Fig. 4; Weekly Performance on the JSE (2nd– 7th June)

4

Source; Bloomberg and Investec Wealth and Investment


One hopes the Reserve Bank was watching these developments very closely. That is slower growth is associated with more not less inflation expected. Not perhaps what you might find in the macro texts. And more important that the reverse is also likely to be true. That is faster growth will be associated with a stronger rand and so less inflation expected and lower bond yields and less spent paying interest. Even our good friends at Moody’s now expect and would appear to welcome a cut in the repo rate to boost growth. As does the money market that now expects short rates in SA to decline by 50 b.p. over the next twelve months.

The Reserve Bank would be well advised to do what is now expected of them and do what they can to stimulate faster growth in SA. Faster growth leading to less inflation expected and as likely, no more actual inflation, should be very welcome. And also help resist those with ulterior  motives when they attack the Bank.

The Reserve Bank attempts to control inflation and inflationary expectations that, in large measure, are beyond its influence. As recent events in the currency and bond markets surely confirm. Supply side shocks (the rand, the weather, the oil price, Eskom and expenditure taxes) dominate the direction of prices and all serve to inhibit disposable incomes and consumption spending. And inflation expected has a political course of its own that can add to upward pressure on prices.

Interest rates set by the Bank do influence the demand for goods and services. Demand has been consistently weak in South Africa for a number of years. Weak enough to counter to some degree the supply side pressures on the price level. But weak enough to inhibit any cyclical recovery. The trade off – less growth for marginally less inflation – has been much too severe for the economy. A more nuanced approach to interest rate settings and a more nuanced narrative to support it would better have served the economy and the Reserve Bank’s independence.


Bringing down interest rates – a task for the cabinet and for the SA Reserve Bank


The immediate challenge for the newly appointed SA cabinet is to do what it takes to stimulate faster growth in output incomes and employment over the next few years. And to instill a strongly held belief that they will succeed in doing so.

The benefits of any more optimistic belief that growth will accelerate would be immediate. The interest rate on longer dated RSA bonds would come down as the danger of a debt trap for SA receded. As it does with faster growth in tax and other revenues for the Republic.

Governments cannot formally default on the loans they issue in the local currency. But they may be tempted to pay down such debt by issuing more currency – should the interest burden on the debt become politically intolerable. Printing more money than economic actors are willing to hold, leads inevitably to more inflation as they get rid of their excess money holdings. Investors are very well aware of the process of inflation- led as it always is by governments unwilling to accept harsh economic realities.

Such inflationary dangers call for compensation for lenders in the form of higher interest rates. There is a lot of inflation priced into long term interest rates in SA that makes borrowing particularly burdensome for SA taxpayers. Very low interest rates of the kind now demanded of European and the Japanese governments, practically eliminates any possibility of a debt trap, even when the Debt to GDP ratios are more than double the ratio in SA, as they are. South Africa would look so much healthier were interest rates a lot lower.

The running yields provided to match supply and demand for RSA bonds provides a very clear and continuous measure of how well the government is rated by investors for its ability to avoid inflation- and stimulate growth. The difference between the yield on a vanilla RSA bond and an inflation protected bond of the same period to maturity indicates how much inflation is expected by investors. It is a risk that the owner of an inflation linked bond largely avoids. Hence the difference between the yield on a five year vanilla RSA bond (currently around 8% p.a) and the lower yield on an inflation protected bond  (currently 2.4% p.a) reveals that inflation in SA is expected to average 5.6% p.a. over the next five years and about 6.5% p.a. over the next ten years. Headline inflation is now significantly lower at 4.4% p.a.

Fig.1: RSA Bond yields and compensation for expected inflation (5 year bonds)

1

Source; Thompson Reuters, Bloomberg and Investec Wealth and Investment.

Another important signal comes from the difference between RSA rand bond yields and those on US Treasury Bonds of the same maturity. This spread indicates how much the rand is expected to depreciate over the years. The difference between 10 year RSA yields and US 10 year Treasury bonds is of the order of 6.6% p.a. That is the rand is expected to depreciate against the US dollar at an average over 6% p.a. over the next ten years. This clearly implies much more inflation in SA compared to the US- hence a further reason for much higher interest rates.


Fig. 2; RSA and USA Treasury Bond Yields (10 Year) Daily Data 2019

2

Source; Thompson Reuters, Bloomberg and Investec Wealth and Investment.


The very latest news from the RSA bond market has not been encouraging about the prospects for growth enhancing reforms. If anything these  interest rates spreads have widened rather than narrowed  – indicating more not less inflation expected and no more growth expected. Hopefully the selection of the cabinet members and better knowledge of their good intentions will raise expected growth and lower long-term interest rates.  Unfortunately SA has not benefitted from the global decline in government bond yields as have other emerging market borrowers.


Fig.3 Global Bond Yields. Movement in May 2019.

3

The level of short-term interest rates will be set by the Reserve Bank. We can hope that the Bank will recognize that inflationary expectations are largely beyond their influence. More inflation expected can add upward pressure to prices as firms with price setting powers attempt to recover the higher costs of production they may expect. But such attempts to raise prices can be thwarted by an absence of demand for their goods and services.

Very weak demand for goods and services over which Reserve Bank’s interest rates have had a direct influence has contributed to very slow growth -and lower inflation. But without reducing inflation expected.

The Reserve Bank should recognize that lower inflation- achieved by deeply depressing spending and growth rates to counter more inflation expected- will not bring less inflation expected over the longer run. That is a task for the cabinet. The role for the Reserve Bank is to do what it can to stimulate more growth by lowering short term interest rates.


A post-script on debt management in SA

The SA Treasury has long adopted a policy to lengthen the maturity of RSA debt. The policy appears to have been reversed somewhat recently in response to the pressure on the budget placed by more debt funded at higher interest rates. We show the maturity structure of RSA debt issues in recent years below. We also show how debt service costs have risen as a share of tax revenues. [1]By international standards the duration of RSA debt is exceptionally high.

5 4

Borrowing long has been more expensive for the RSA than borrowing short. The term structure of rand denominated bond yields has been consistently upward sloping since 2008. The average monthly difference in these yields has been 2% p.a. between 2010 and 2019. See the figure below that charts the difference between 10 year and 1 year RSA yields.


Fig.4: The slope of the RSA yield curve RSA 10 year – RSA 1 year bond yields

6

The case the Treasury makes for extending maturities is to avoid the danger of so described roll over risk. The longer the maturity structure of the debt incurred, the less often has debt to be refinanced. Though surely the breadth and depth of the market for RSA bonds is surely enough protection against not being able to refinance debt when it comes due, or before it comes due.  As are the large cash reserves the Treasury keeps with the Reserve Bank. Paying so much more to borrow long rather than short seems a very expensive way to avoid the unknown danger that it may be difficult to place debt at some unknown point in time.

But there is more than roll over risk to be considered. The Treasury preference for borrowing long- when inflationary expectations are elevated (over six per cent per annum as they have been for much of the period since 2010) – indicates little confidence in the ability of monetary policy to meet its inflation target of between 3 and 6 per cent p.a.

Borrowing long – extending the maturity structure of national debt -adds to the temptation to inflate away the real value of debt incurred. Investors are surely aware of their vulnerability to the consequences of a debt trap- the danger that a country will print money to retire expensive debt that will then lead to inflation and much reduce the real value of their loans.

Such reliance on borrowing long that brings with it inflationary temptation must show up in higher long term interest rates – relative to shorter rates- to compensate for the extra risks incurred in lending long. Having to roll over short term debt at market related interest rates that will rise with inflation makes lenders less hostage to the danger of unexpectedly high inflation. It may even act to discipline government spending and borrowing because inflating away the debt burden is not an option. Accordingly it reduces the danger of inflation and by doing so may improve a credit rating. Borrowing long is an opportunity that a government treasury should best resist- as proof of its anti-inflationary credentials.