The resilience of the US economy in the face of higher interest rates has surprised many. Members of the Fed Open Market Committee, having pencilled several cuts to interest rates to come this year, have seemingly reversed course. Their pivot was precipitate. The still highly satisfactory state of the US economy must take the credit- or the blame -depending on whether you a borrower or lender be including in SA. US GDP, that is total output, has grown by 3% year on year and by a below expected 1.6% annualised in Q1 2024. Retail sales, an all-important measure of the state of demand in the US, had a lively February and March. Yet sales had declined steadily for many months before and retail sales deflated by the CPI are still two percent below that of January 2023. This revived willingness of US households to spend more has occurred despite minimal growth in real personal disposable incomes. In February incomes were only 2% higher than they were in early 2023, despite very full employment. Tell that to the White House.
US Retail Sales and Real Disposable Incomes (January 2023=100) Monthly Data to March 2024
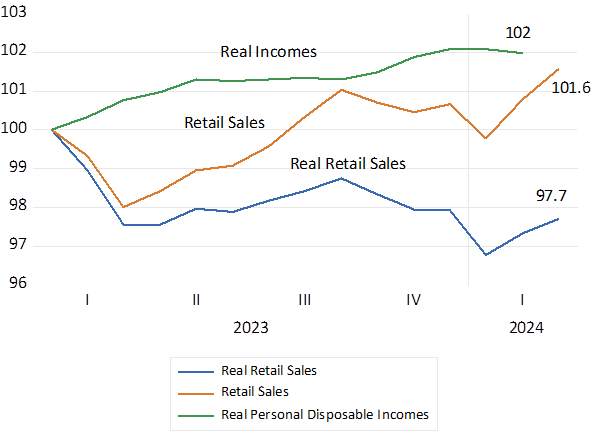
Source; Federal Reserve Bank of St.Louis, Investec Wealth & Investment.
The good news about spending propensities with its implications for high interest rates for longer had a mixed reception in the financial markets. Given the new uncertainty about Fed action to come, stocks and bonds have fallen back this month.
This minor pull back has come after investors had enjoyed a full recovery from the significant declines in the valuations of stocks and bonds in 2022 when interest rates rose dramatically to deal with the inflation that had taken central banks and the markets by surprise. Yet it has all worked out rather well in the financial and housing markets. History tells us that it takes a financial crisis, to cause a recession, and the global financial system avoided one this time round.
The place to look for an explanation of US economic resilience is the behaviour of the US financial markets themselves. US wealth, consisting mostly of financial assets, stocks bonds and equity in homes, net of household debt, has been increasing dramatically since the Global Financial Crisis of 2010. And received a huge injection from the Covid relief payments and the strength of the financial markets in 2023. US household wealth, net of debts, is now of the order of 156 trillion dollars. That is about seven times Personal Disposable Incomes. It was but 110 trillion dollars in early 2020, and now worth 156 trillion. Up by approximately 40 trillion dollars since the Covid lockdowns. Personal Incomes after taxation have grown by a mere 45 billion dollars since then. (see charts below)
Changes in wealth are as much a source of additional spending and borrowing power as any other source of income. In aggregate unrealised wealth gains dominate changes in other sources of income. Changes in wealth, even if capital gains can reverse, can significantly influence current spending. .Though predicting the wealth effect on aggregate spending requires predicting wealth itself. Which is even more difficult than predicting the disposable income effect on spending. Success in predicting financial markets would be modern alchemy. Yet essential if economic forecasting is to have any scientific validity.
s
US Wealth, Personal Disposable Incomes and Wealth to Income Ratio
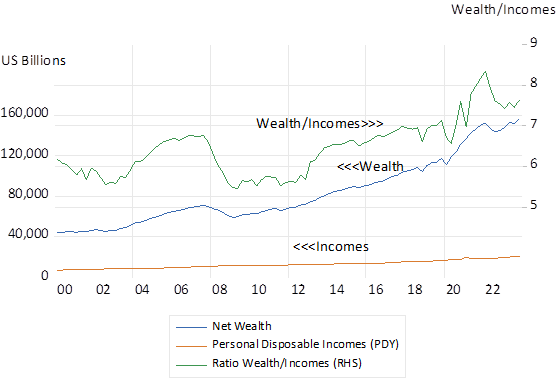
Source; Federal Reserve Bank of St.Louis, Investec Wealth & Investment.
US Households. Annual Change in Net Wealth, Value of Financial Assets and Personal Disposable Incomes (USD Billions)
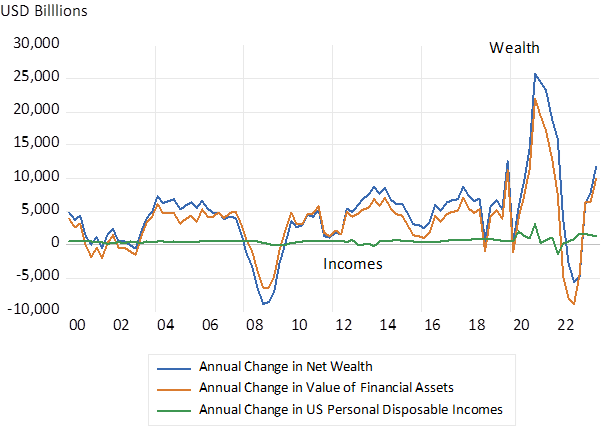
Source; Federal Reserve Bank of St.Louis, Investec Wealth & Investment.
Household Wealth in South Africa is about 4.5 times larger than household incomes after taxation. This ratio increased markedly during the growth boom pf 2002-2008 and has largely stabilised since. (see charts below) The wealth of SA households is about to be challenged by a new dispensation. That is the right to easily draw down a third of their accumulated wealth held in pension funds and retirement annuities, the impending two pot system. The impact on spending, interest rates and on the financial and real estate markets in SA will be significant. The forecasters in and out of the Reserve Bank will be fully engaged in predicting the outcomes. Waiting to see what happens may be the only sensible option.
SA Households. Net Wealth and the Wealth to Disposable Income Ratio
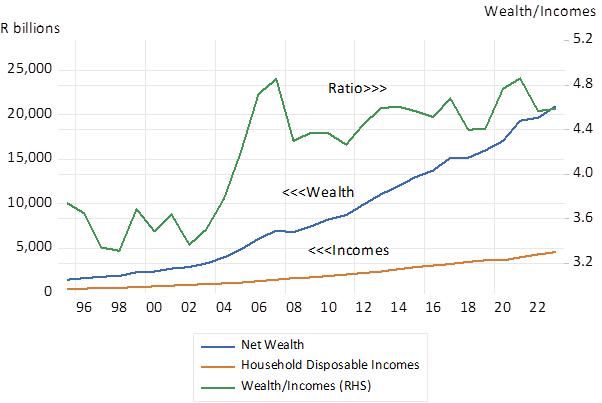
Source; SA Reserve Bank Investec Wealth & Investment.
South African Households Annual Changes (R billion) in Net Wealth, Financial Assets and Debt.
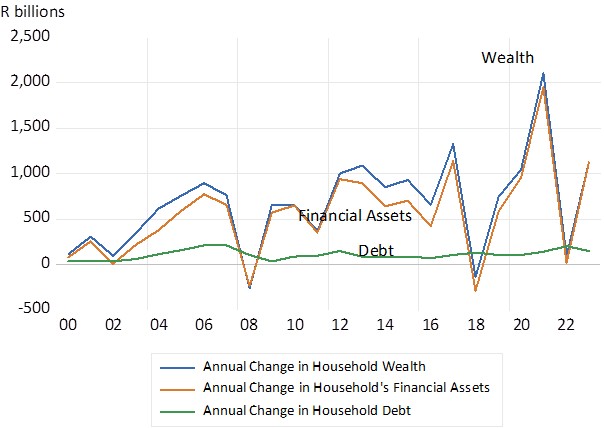
Source; SA Reserve Bank Investec Wealth & Investment.