South Africans enjoyed full access to the World Football Cup – as they do to the Springboks and most important global sporting events. Who paid for such valuable access? Thanks are due to the punters betting on the outcomes. The competing Sports Betting Bookmakers and their advertising budgets cover much of costs the television programmers incur for the rights to broadcast the events. Without the punters, their telephones, internet connections and the bookmakers taking and advertising their bets, watching the games at a distance would be far more expensive- perhaps unavailable.
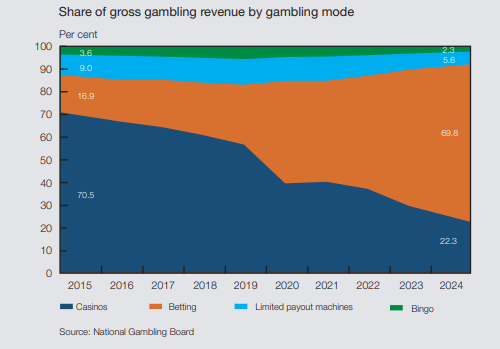
Sports betting has become the dominant form of gambling in South Africa. Before Covid, licensed Casinos in South Africa accounted for approximately 56% of all gambling activity and Sports betting 22%. By 24-25 the sports betting houses claimed 70% of all legal gambling and the share of Casinos had fallen to 26.5% – with the Casino operators adding on-line sports betting to their portfolios to compete better for the gambling rand.
Source; SA Reserve Bank Quarterly Bulletin. March 2026.
How much then do the punters pay to back their teams? The answer is perhaps less obvious than it may appear on the surface as the transactions with their bookmakers heat up. It depends on not how much the punters bet, rather on how much they lose collectively to the gambling houses, the bookmakers. An amount known as Gross Gambling Revenue. (GGR) That is the money with held by the book makers and Casinos after paying out the winners. The amounts returned to punters in SA are about 94% when playing games of chance in Casinos. (a 6% average loss ratio) Sports betting appears to offer less generous odds paying out less than 92% of what they took in 2025.
The notion that all gamblers must lose is therefore not accurate. A significant number of the bets laid will be winning ones – on a day, month year or lifetime of gambling – depending on the distribution of the outcomes around the average loss ratio. If the distribution around this average loss ratio of 6% were a normal one, around 27.0% of all punters would break even and 11.5 % of the punters would more than break even or better. The number of successful gamblers- those who broke even or better and who presumably had some fun along the way -would fall or rise with the GGR.
Since 2015 the Turnover (Revenue) of all licensed gambling houses in SA has risen from R358 million in 2015 to R1501m in 2024. An increase of 4.2 times. Over these 10 years GGR or what may also be described as the Gross Operating Surpluses increased from R26.3m to R74.5m, a lesser increase of 2.8 times. Perhaps a sign of a more competitive market.
The share of GGR in Gross Household Consumption Expenditures grew from 0.9% in 2015 to 1.6 per cent in 2024. The biggest loser from this shift in spending patterns was spending on other forms defined as Recreation and Culture that fell from 7% of estimated household spending in 2015 to 5.8% in 2024. That is minor shifts in consumption patterns towards gambling have occurred – inspired by changes in technology – but hopefully not enough to inspire panic – or successful attempts to interfere with essential freedoms of adults to spend as they wish.
Of the R74 billion GGR in 2024 a significant proportion was paid in taxes – that is not returned to punters. Specific taxes on the GGR, amounted to R5.8 billion (7.8% of GGR) in 2024, of which the Sports Betting houses contributed 59% or R3.4 b. It was R240 m in 2018/19. The betting houses will also be liable for income taxes on their earnings which will be less than their GGR after taxes.
The temptation to raise the specific taxes to discourage gambling will always be a force. As it is with excise taxes on alcohol or tobacco the consumption of which is much disliked. Raising such excise taxes, as we have noticed in our lawless society, may however not even lead to increased tax revenues. It most obviously adds encouragement to illegal production and smuggling. Even to the point where the prices on the streets decline as the producers of contraband compete away some of the extra margin higher tax rates wittingly or perhaps unwittingly provide them.
The price of an opportunity to gamble is the pay out ratio- that part of the bet paid back in winnings. Forcing the bookmakers to pay over more to the receiver of revenue is very likely to reduce their pay-out ratios. And therefore to encourage the illegal operators to improve their odds to encourage more flows and GGR their way. And so less for punters and the tax man and sports lovers.
But there is another new force in the gambling market that may be an even bigger threat to the bookmakers and Casinos than higher taxes on GGR. It is the increasingly important role now being played by the Prediction Markets. Polymarket or Kalshi do not make money by “being the house” and taking the opposite side of your bet. They operate more like exchanges where users trade contracts with one another betting on a huge variety of possible outcomes, sporting or financial or political. Their profits come primarily from facilitating trading activity rather than from gamblers losing. And they charge fees to do so, as would a stock or commodity exchange. Indeed Kalshi is licenced and regulated in the US as such an exchange.
One source, my helpful BOT, analysing Kalshi’s 2025 activity reported as follows. Trading volume: $22.88 billionFee income: $263.5 million- That is 263m/2288m =1.15%Which is a formidably high payout ratio – over 98% – and one very likely to encourage the odds conscious and well informed large punters- or perhaps better described as hedgers rather than gamblers. The sooner SA licences such an exchange to reduce illegal gambling the better.
Trade with foreign partners plays a very important role in the SA economy. Exports add about 30% to the demand side of the economy and imports add about the same 30% to the total supply of goods and services. Such trade is almost all conducted in a foreign currency – mostly with the USD – at a rate of exchange that is highly variable and thus very hard to predict. For exporter or importers and those competing with imports knowing what their rand revenues or rand costs will be- that is how profitable their operations will be – is subject to much uncertainty. Such risks to business plans are a clear discouragement to foreign trade. The volatile exchange rate is a burden SA business has had to cope with as best they can- by partly hedging, expensively, their short term exposures to exchange rate movements .
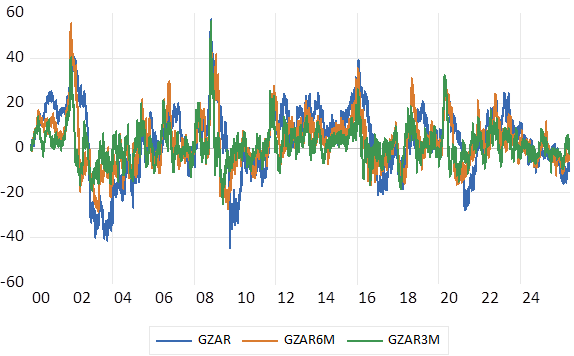
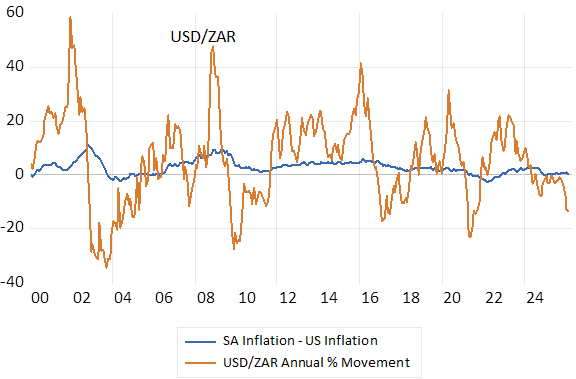
In the chart below we show just how variable that USD/ZAR exchange rate has been- indicating that the volatility of the rate of exchange has not declined much, even as the ZAR has performed much better and inflation has receded since 2023. The oil price shock, as do all globally important events, adds to ZAR volatility. The annual increase in the rand cost of a dollar change (USD/ZAR exchange rate) since 2000 has average by about 3.7% p.a. – with wide spreads about the average- the Standard Deviation about this average has been over 15% p.a. Measured on a six month or three-month basis volatility has also been highly pronounced as we show
The movement of the USD/ZAR exchange. % Move over 12, six and three months. Daily Data 2000-2026
Source; Bloomberg and Investec Wealth & Investment
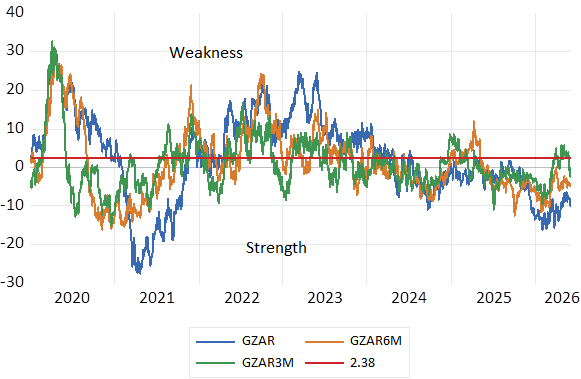
The movement of the USD/ZAR exchange. % Move over 12, six and three months. Daily Data 2020-2026 and average annual move 2.38% p.a
Source; Bloomberg and Investec Wealth & Investment
The openness of the economy moreover makes the exchange rate a very important influence on the prices of goods and services in general as reflected in the CPI or PPI. Where the exchange rate goes prices follow in the same direction. Moreover, the exchange rate movements, wide as they are, have led rather than followed the direction of the inflation rate to help level the foreign trading field. What is gained for exporters with a weaker USD/ZAR exchange rate is taken away with more inflation of their local costs of production. And vice versa for importers who are hurt by a weaker exchange rate but assisted by the faster rate at which the costs of local competitors will be rising following rand weakness.
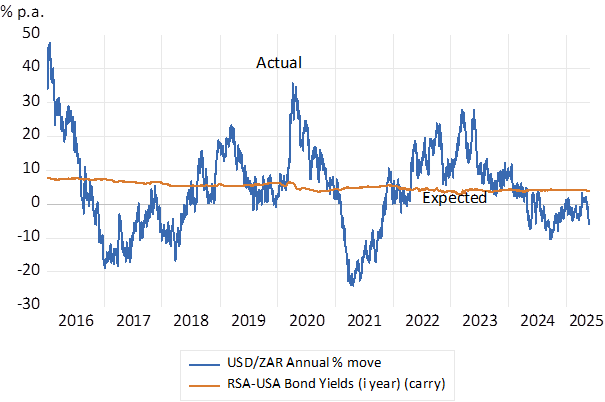
Though as we will show the foreign trading field has not been a consistently level one. The ZAR on average has weakened by more than the difference between SA and US Inflation. SA inflation between 1995 has averaged 5.7% p.a. while US inflation has averaged 2.6% pa, an average 3.16% p.a. slower while the annual move in the USD/ZAR has averaged 6.3% p.a. over the 30 years.
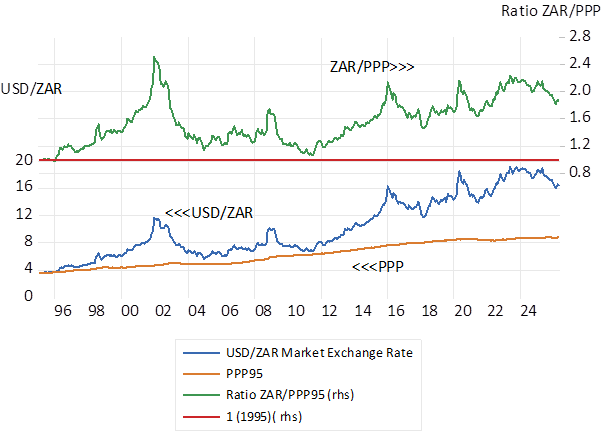
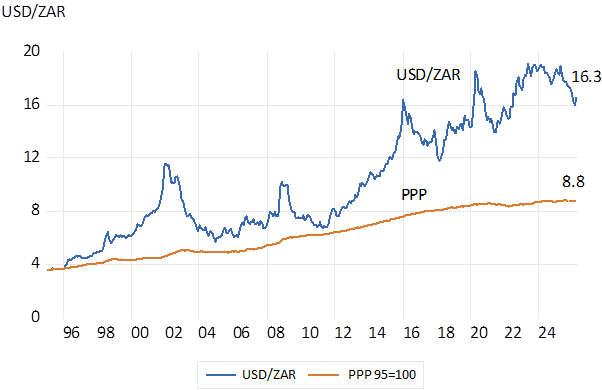
It has made the USD/ZAR a consistently competitive rate of exchange – encouraging presumably more profitable exports and discouraging more expensive imports of goods and services. That is the exchange rate Vs the US dollar has weakened by more than the difference in inflation rates between SA and the USA. In the chart below we show that had the exchange rate largely followed the difference in inflation rates since 1995 ( purchasing power equivalent (PPP) exchange rate) a USD would now cost less than nine dollars. We show also that the ZAR came close to PPP in 2010. The ratio of the USD/ZAR exchange rate to its PPP equivalent has nevertheless averaged well over one to one.
USD/ZAR exchange rate trends. The ZAR/USD exchange rate compared to its Purchasing Power (PPP) equivalent
Source; SA Reserve Bank and Investec Wealth & Investment
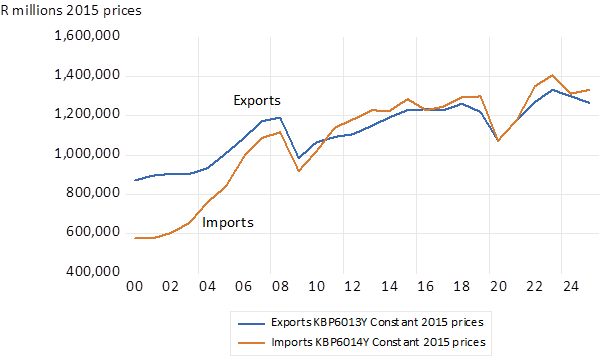
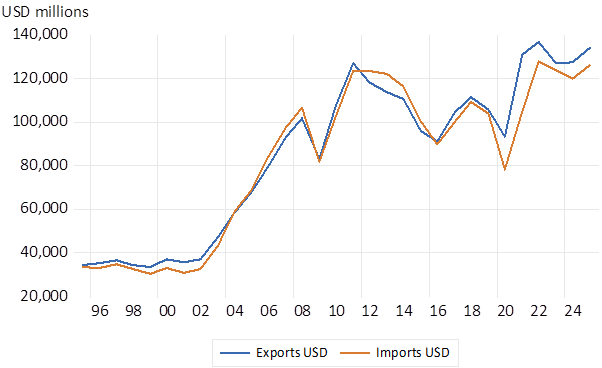
Though unfortunately faster export led growth has not followed a very competitive exchange rate. Volumes of Exports and Imports have largely stagnated as we show. Largely for the same reasons that SA growth generally has remained highly subdued. The rising cost of electricity and the failures of Transnet have been headwinds slowing growth and exports. The failure to offer competitive returns for investing in SA mining is another reason why exports have not grown faster despite highly favourable metal prices in USD and more so in ZAR. But this is not the place to catalogue the reasons for the failure of the SA economy to grow faster. But export led growth remains a route out of stagnation if SA could get its act together.
The volatility of the ZAR is explained largely by forces that are beyond South African control. The forces that drive highly variable flows of mobile capital to and from the US and into emerging markets generally of which SA is an actively traded part have moved the ZAR. Global forces much more than SA specific risks explain much of what happens to the USD/ZAR and other exchange rates. And will continue to do so. We should continue to expect exchange rate volatility. Capital flows are far more important flows than trade on the forex markets. Yet the Reserve Bank could do a much better job of not reacting with higher interest rates to exchange rate volatility over which they have little influence.
The volume of SA exports and imports (constant 2015 prices)
Source; SA Reserve Bank and Investec Wealth & Investment
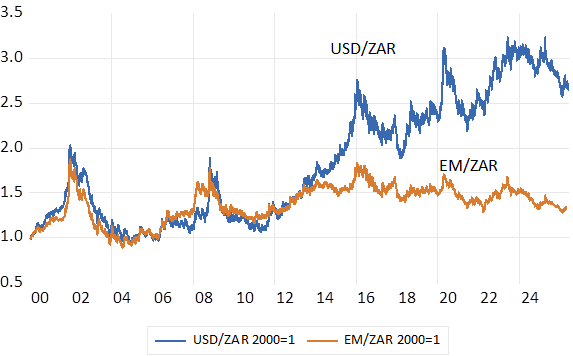
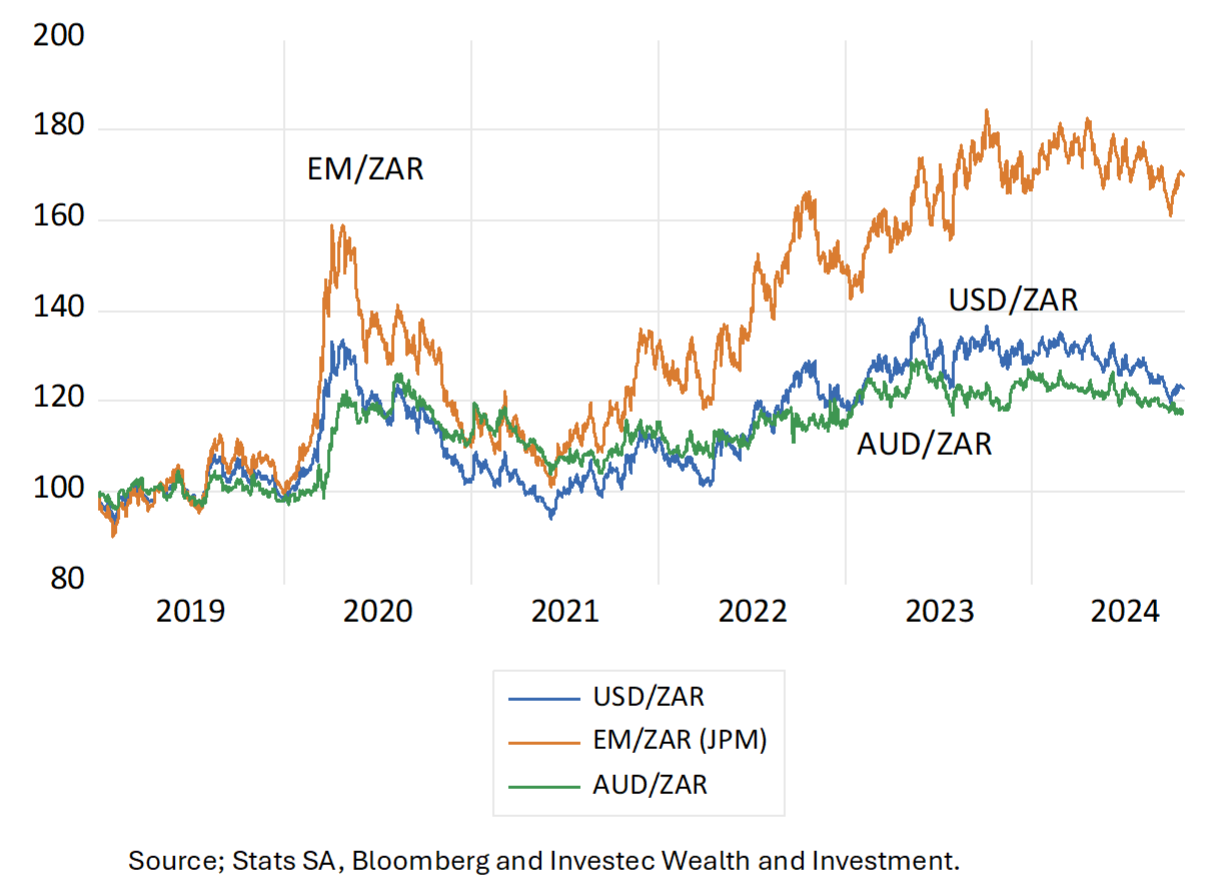
The major force driving the ZAR has been the rates of exchange at which Emerging Market (EM) Currencies as a group have exchanged for the USD. If we could predict the direction of a representative sample of EM currencies we would be able to predict the USD/ZAR exchange rate with a high degree of accuracy. But unfortunately, such a forecast, essentially a forecast of where the USD will be going VS the other major currencies, is a very difficult task.
Nevertheless, the ratio of the USD/ZAR exchange to the basket of EM currencies can help explain much of the behaviour of the USD/ZAR exchange rate over the years as we show below. When the ZAR moves away from its EM foundations a movement back to equilibrium can be predicted with some confidence. There has been very little change in the EM/ZAR exchange rates over the past ten years as we show below. It is striking that in recent years with a degree of USD/ZAR strength the ratio ZAR/EM exchange rates is now close to one to one even as the USD now cost about 2.5 times its rand cost of 2000. SA specific risks have not been harmful as they have been in the past. Hopefully these risks will continue to be contained.
The USD and the basket of EM currencies – exchange rates with the ZAR. 2000=1
Source; SA Reserve Bank and Investec Wealth & Investment
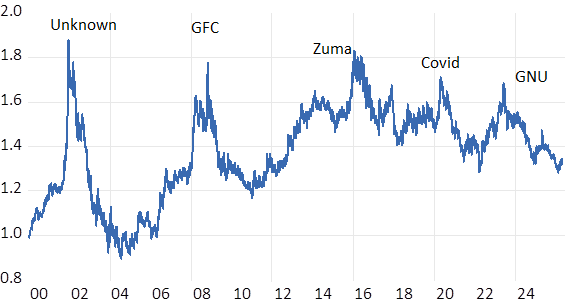
The EM/ZAR exchange rate. 2000=1 (ZAR weakness indicated by higher numbers > 1)
Source; SA Reserve Bank and Investec Wealth & Investment
A path to faster growth in SA could be export led. There is no lack of global demands for valuable goods and services that could be delivered from SA with the right incentives to do so. The most obvious incentive would be a consistently favourable relationship between the revenues, realised producing goods and services at home for foreign customers and their costs of production. From an exporters perspective and from the perspective of a local producer competing with imports, the wider the gap between exchange rate movements and inflation rates, the better for growth in output and incomes with more exported less imported.
To encourage the demand for exports and discourage the supply of exports the exchange rate should weaken predictably by more than the difference between inflation in SA and its trading partners. The weaker the exchange rate movements compared to the differences in inflation rates, the better for competitive local production. But ideally the exchange would weaken at a modest rate, but also one that consistently exceeds a hopefully still modest rate of inflation. Indeed, a slow rate of currency depreciation is an essential ingredient for sustaining low rates of inflation. Yet still allowing enough of a predictable gap between exchange rate weakness and local inflation to make exports and replacing imports a consistent driver of faster growth.
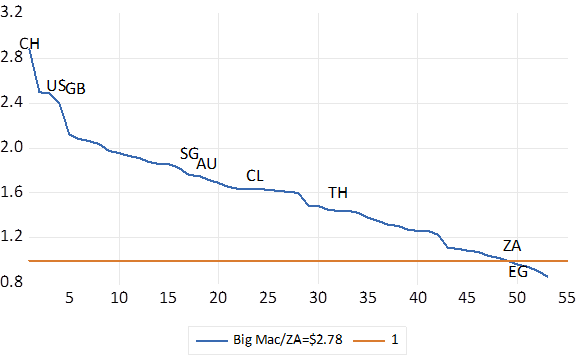
The South African rand ever since the economy opened to significant inflows and outflows of capital in 1995 has consistently had much more purchasing power at home than abroad. As any tourist local or foreign would attest. SA is among the very cheapest destinations. The 50th cheapest Big Mac cheeseburgers are to be found in SA. We pay about USD 2.78 for the privilege. Compared to an average $5.79 paid in the US (tip 20% – strongly recommended, excluded)
You would only pay marginally fewer dollars and cents for your Big Mac in Egypt, India Indonesia and Taiwan than in SA. Surely a boost to incoming tourism. The most expensive Big Macs are to be found in Switzerland, priced at over 2.8 times their USD cost in SA. Switzerland struggles to maintain the competitiveness of its jewellery and watch manufactures and Alpine holidays in the face of safety seeking capital flows that raise the cost of a Swiss franc and everything else in Switzerland. Perhaps a high-level problem to have when you can convince the wealthy of the world that their money is safe with you. According to the WSJ the average price of a margin enhancing and buzz inducing cocktail in the US is now $13.61. Equivalent to R225 rand. Which with luck and judgment your local speakeasy will charge you half as much- maybe R110.
Fig.1; The Price of a Big Mac around the world. A multiple of its dollar price (2.78) in South Africa
Source; Google and Investec Wealth and Investment
But this ratio between the foreign exchange value of a rand and its purchasing power equivalent has been a highly variable one. Since 2000 the rate of inflation in SA has averaged about 2.4% a year faster than in the US, with minimal volatility. The USD/ZAR exchange rate has weakened by an average 5.8% p.a. providing for a generally competitive exchange rate with the USD but a margin with very high volatility. Making the budget calculations of exporters and importers highly uncertain A highly variable real exchange rate is not good for sustainable business. We should hope for less volatility.
Fig.2; SA Vs US Inflation Differences, and USD/ZAR Exchange Rate Movements % p.a. Calculated monthly.
Source; Bloomberg, Fred, Investec wealth and Investment
A purchasing power equivalent (PPP) exchange rate would fully compensate for differences in inflation rates between SA and the US. If the exchange rate (R3.6 in 1995) had simply compensated for difference in SA and US inflation since then, the USD would now trade for less than 9 rand – about 54% of its current market. Roughly equivalent to the double we pay in rands for the goods and services we consume abroad
Fig.3; The market and PPP equivalent USD/ZAR exchange rates
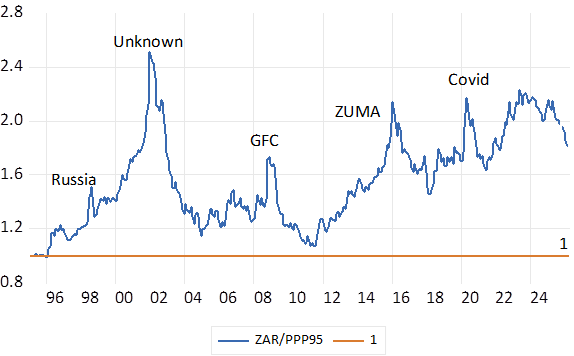
This ratio of the market value of the USD/ZAR to its PPP equivalent has however varied from a peak of 2.4 times in 2002, to a brief one-to-one relationship in 2010. A very good time to have travelled Whereafter under Zuma inspired threats to capital took the ration back over 2 in early 2016, a ratio that has remained similarly elevated and internationally competitive since.
Fig 4; The Real USD/ZAR exchange rate Market/PPP Ratios. (1995=1) Higher numbers indicate improved foreign competitiveness.
Source; Bloomberg, SA Reserve Bank and Investec Wealth & Investment
Yet despite the stimulus of a competitive exchange rate, export volumes and revenues in USD and have been largely stagnant since 2010. There was very strong growth in the years before. And imports have kept pace with exports. Clearly other well recognised forces have restrained economic growth generally as well as limiting the capacity to export and compete with imports.
Fig 5; Exports and Imports; USD values.
Source; SA Reserve Bank and Investec Wealth & Investment
But the case for export led growth remains compelling. It needs the right supply side encouragement. A more predictable exchange rate – both nominal and a competitive real exchange rate would be very helpful to the purpose. But very recent global events and its impact on the ZAR- a high beta emerging market exchange rate – have reminded us how unlikely is this prospect. And low inflation itself can be a mixed blessing for exporters if it means a stronger real exchange rate. South Africa should seriously consider the actions that would convince investors to support the economy with capital. And to learn to manage exchange rate instability and inflation without destabilising the real economy.
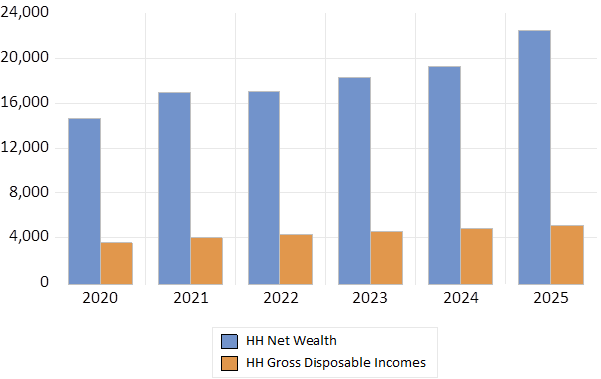
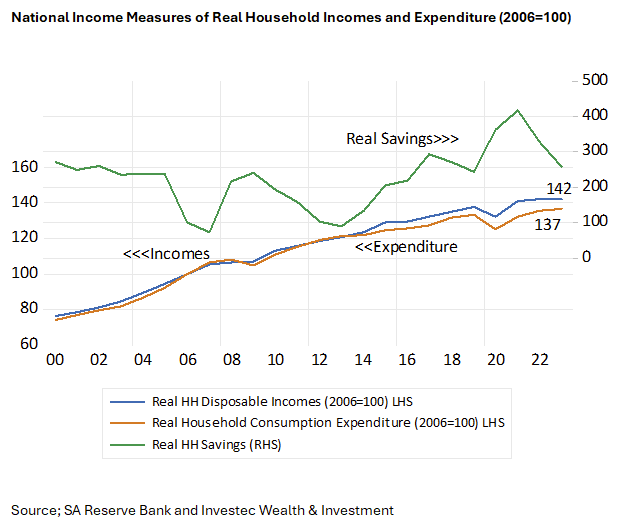
South Africans grew their wealth at a much faster rate than their incomes in 2025. Household assets, less household debt, was 15% larger than the year before. Up by a very tidy R3,200b. The disposable incomes of households grew at a much more pedestrian rate of 4.7% or by R230 billion in 2025. Household spending on consumption goods was 5.7% up on a year before. A respectable real increase given consumer goods inflation of only 2.2% in 2025, so helping the economy along. Nominal GDP grew by 3.9% in 2025 that lost only 2.8% of its purchasing power delivering real growth of only 1% in 2025
Household Net Wealth and Disposable Incomes (R billion)
Source; SA Reserve Bank. Quarterly Bulletin and Tables December 2025. Investec Wealth and Investment
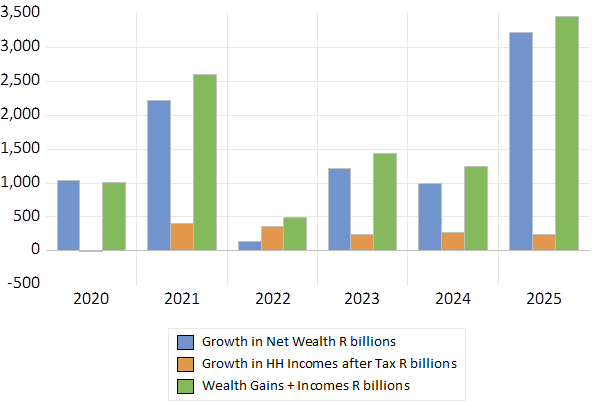
If we regarded the increase in net wealth as income and added it to the disposable incomes of households, the increase in household income, including unrealised capital gains, was close to an imposing 3.5 trillion rand and more than 10 times the increase in disposable incomes last year. The household wealth to disposable income ratio in 2025 was nearly five times- close to the long term ratio.
Growth in SA Household Incomes- including capital gains
Source; SA Reserve Bank. Quarterly Bulletin and Tables December 2025. Investec Wealth and Investment
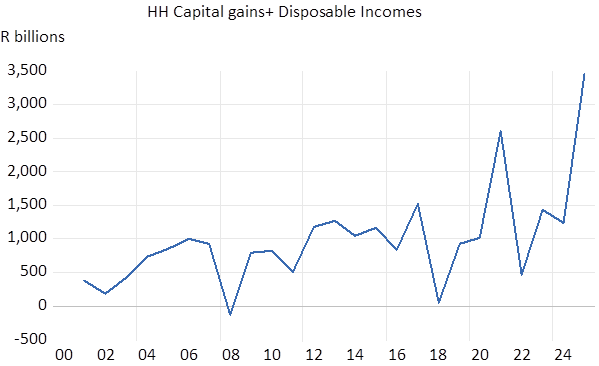
Source; SA Reserve Bank. Quarterly Bulletin and Tables December 2025. Investec Wealth and Investment
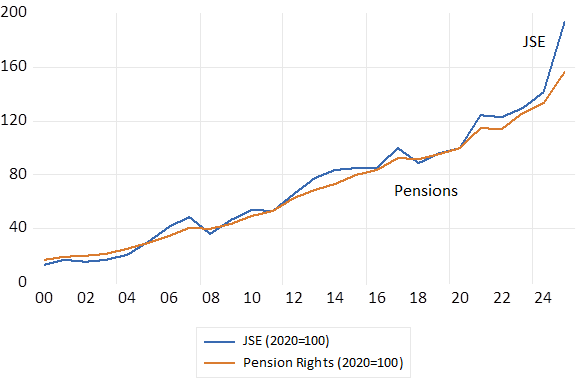
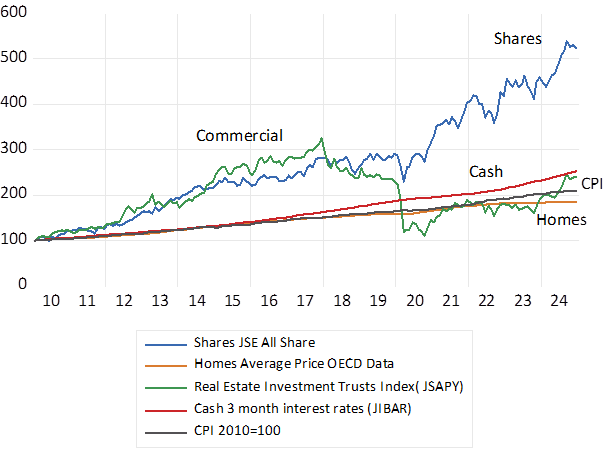
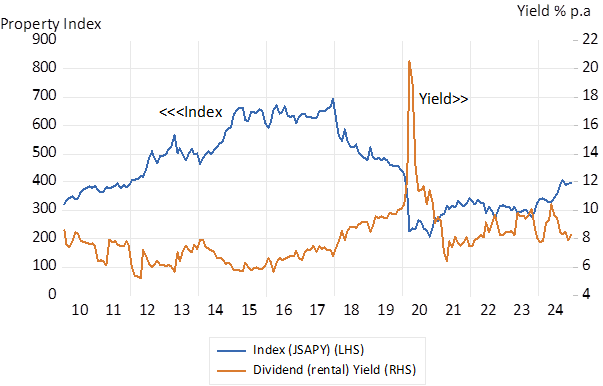
The largest contribution to this impressive increase in the wealth of SA households was the increase in the value of the assets held for retirement. The claims of Households on the pension and retirement funds managed for them amounted to over 9 trillion rand in 2025, having added as much as 1.36 trillion rand to net HH wealth in 2025. Pension fund rights account for about 40% of the net wealth of SA of households and homes about 35% worth about 7.7 trillion in 2025. The value of pension rights closely follows the JSE All Share Index and 2025 was a banner year for the JSE, buoyed as it was by dramatic increases in the prices of precious metals that play a significant role in SA exports and income tax. The JSE returned about 30% in 2025.
Pension and Retirement Fund Assets of Households compared to the JSE (2020=100)
Source; SA Reserve Bank. Quarterly Bulletin and Tables December 2025. Investec Wealth and Investment
The formally employed in SA are mostly required to contribute a proportion of their incomes to retirement and medical aid funds to which their employers often add a contribution which should be understood as a salary sacrifice, not as charity. The share market has served the many employees, who are the owners of SA companies, very well over many years. The shareholders of SA companies, through their pension rights are many and a highly diverse, representative of the work force. They incorrectly do not register as BEE qualifying.
Clearly changes in household incomes that include capital gains are not only much larger than disposable incomes. They are also much more variable, given exposure to financial market forces. Retirement funds moreover are less immediately accessible than income from work or from dividends or interest income that compounds most usefully when reinvested in retirement funds, rather than when paid out and consumed. Banks will lend when secured by incomes. They are apparently much more reluctant to regard pension fund assets as security for their credit. Is this appropriate, to encourage saving up rather than down? By households many of whom live from paycheck to paycheck and incur expensive debt doing so. Cheaper credit would be very valuable to them.
Though households are drawing increasingly, in as far as they are allowed to by the two-pot system, to cash in their pension fund gains. The number of such drawdowns, repeated drawdowns, have been increasing. Though the amounts drawn down to fund current expenditure given the growth in the market value of pension fund assets has not had a significant negative influence on the funds managed. Favourable wealth effects will have helped to stimulate household spending in SA in 2025 and compensated for a general reluctance or inability to commit funds to capex. For want of business confidence to do so and for want of capacity of SOE’s to do so.
Despite the ubiquity of pension funds for the formally employed the distribution of SA’s wealth has surely been less equal than the distribution of incomes. Especially given that so many South Africans, earn or report no incomes at all and rely on the taxpayers to fund their consumption of private and public goods. So reducing significantly differences in actual consumption if not in earned incomes.
But an inevitably unequal distribution of wealth and of the savings of net income, including capital gains, undertaken mostly by the better off has a major upside. It means more capital for the economy to fund productive real capital, plant equipment, infrastructure and also R&D. The higher the ratio of capital- that is wealth to the labour force – the higher will be incomes from work. The rich make their contribution not only by producing and earning more (when earned in the old-fashioned honest way not corruptly) But also by saving more to help fund capex.
Expenditure on consuming goods and services by rich and poor has an opportunity cost. It means fewer goods and services left over to be consumed by others, in the wider community. But saving, accumulating wealth and not spending it all, postponing spending, provides a public benefit. It enables and funds the growth in the real stock of capital. It should be encouraged. As should the incentives to allocate capital domestically rather than abroad.
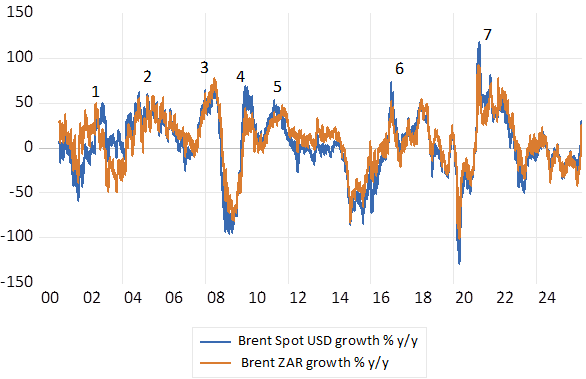
Mike Tyson famously remarked that a plan was all very useful until you were smacked in the mouth. The SA economy has taken a snot-klap in the form of an oil price shock accompanied by a further shock in the form of a weaker ZAR. An unexpectedly disappointing development but by no means unprecedented. Oil price and currency shocks have been a regular feature of recent global and economic history. Any helpfully realistic plan for the SA economy should include a credible plan to deal with an oil price or currency shock. Do we have one?
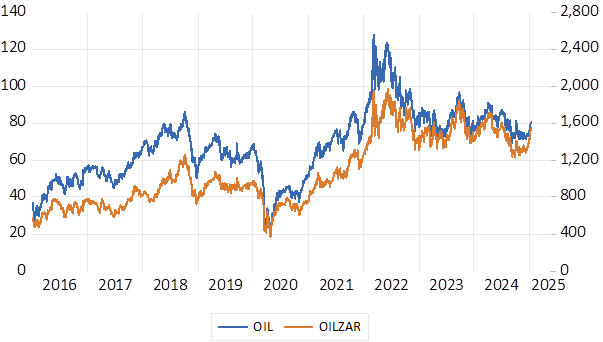
We have often been here before as the oil price cycle in ZAR and USD reveals- though it also reveals that the oil price cycle when measured in USD or ZAR looks very much the same. One can identify at least seven such shocks – in both directions – since 2000. And the stock market reacts in the same direction- share price volatility rises and falls with the oil price. An oil price shock is bad news for SA facing businesses -understandably so – and for their shareholders in pension and retirement funds – because of its negative implications for generating sales and earnings.
Recognising the Oil Price Cycle. USD and ZAR. Daily Data to March 2026
Source; Bloomberg Investec Wealth & Investment
What is our economic plan and how has it been disrupted? The plan is to realise consistently lower inflation ( for all the benefits lower inflation delivers for the long-term growth outlook- easily exaggerated I would add) Yet To achieve lower inflation a helpfully stronger ZAR and stable oil price is essential to the purpose. But both are not at all influenced by SA interest rate settings. The supply side of our economy (the cost of imports) as we painfully observe, is not under our control. Yet the demand side of the economy and its impact on prices can be managed to a degree with interest rate settings.
Policy determined interest rates and the cost of credit for an extended period have therefore been set high enough for an extended period to effectively restrain the strength of the demand side of the economy (to a fault –I would argue). A mixture of demand repression and very welcome supply side support- stable oil prices and a stronger rand with support from much higher precious metal prices and a weaker USD – has helped bring down inflation in 2025. And led us to an inflation target of 3% p.a.
Though despite the severe monetary policy setting there were some encouraging preliminary signs of a cyclical pick up in credit and money supplies and in household consumption spending. By year end 2025 household spending was ticking higher – by about 1.2% more than the quarter before as were the growth rates in money and credit supplies. And perhaps even more important for a sustained upswing, precious metal prices provided good support for the ZAR, the Treasury and the value of pension and retirement funds of the working and retired South Africans in 2025
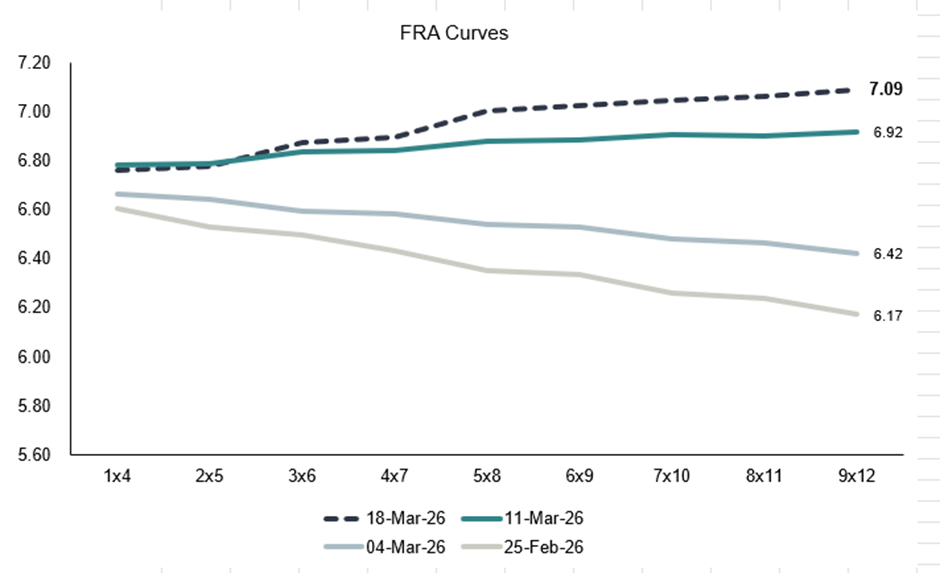
The chance of a cyclical recovery have now receded sharply- on the assumption that inflation will rise and the Reserve Bank will increase rather than cut interest rates over the next twelve months- as was the market expectation until two weeks ago. The money market is now pricing in about 50 bp higher short-term rates in twelve months. The broader bond market view is also anything but sanguine with interest rates rising similarly- though still below levels of a year ago.
Perhaps realistic expectations but, if they are imposed on a stagnant economy, would surely mean a serious and avoidable policy error. The ZAR, while helpfully little changed over a twelve-month period, has unhelpfully also weakened marginally against the major currencies and other emerging markets.
Forward Rate Agreements in the Money Market
Source; Bloomberg Investec Wealth & Investment
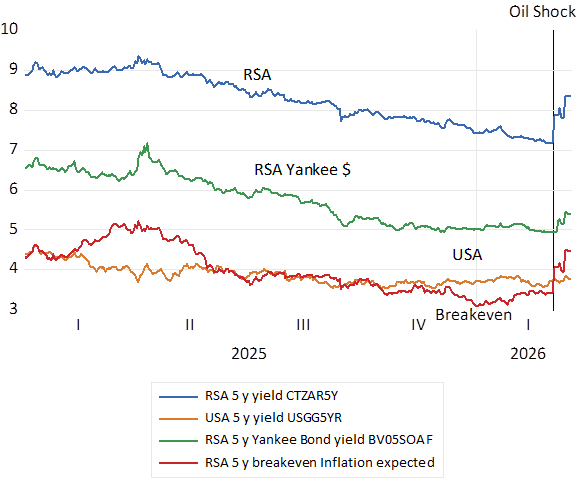
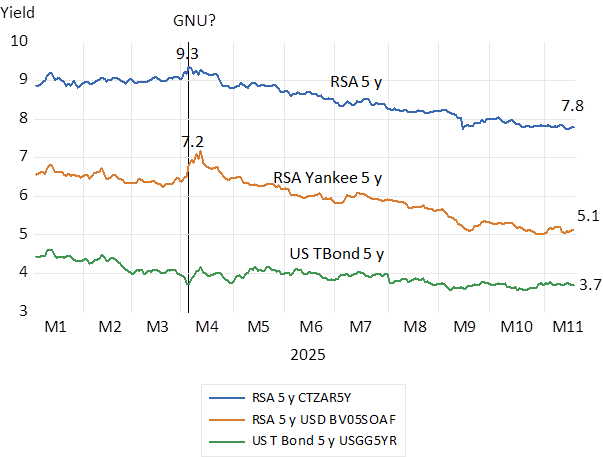
Long dated bonds – five-year RSA and USA Bond Yields and Inflation Expected; Daily Data 2025-March 17th, 2026
Source; Bloomberg Investec Wealth & Investment
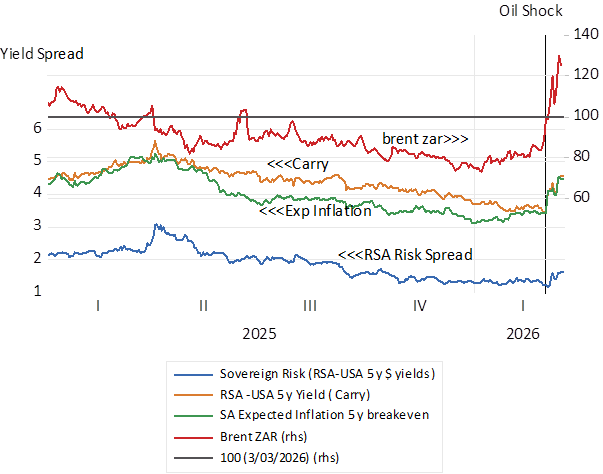
Interest rate trends and the rand oil price (March 2026=100) daily data
Source; Bloomberg Investec Wealth & Investment
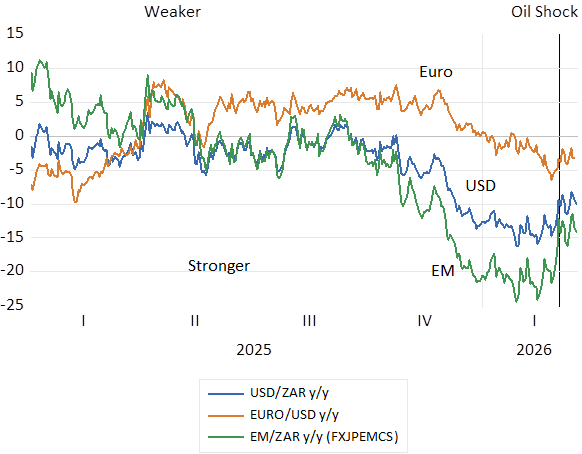
The Exchange Rate Cycle. The annual per cent movement in the ZAR vs the USD, the Euro and the EM basket. Daily Data to March 17th, 2026.
Source; Bloomberg Investec Wealth & Investment
It is not good sense to raise interest rates when a price shock is already damaging disposable incomes and undermining the willingness and ability of households or firms to spend. Adding higher interest rates to the debilitating impact of higher prices- an oil price tax- on spending – adds to the misery. And can have no impact on inflation expected. Inflation and inflation expected will take its cue from the oil price and the ZAR. And judged by past performance- neither the oil price nor the ZAR can be expected to continue in the same direction into an indefinite future. The rational expectation is that these trends must reverse and inflation trends will reverse in the same direction. Wisdom is for monetary policy to stand aside and let it all work out. The broader plan should include a plan to deal with a supply side shock to prices. A plan that ignores supply side shocks to help the economy ride through impact of a temporary increase in prices. By not raising interest rates and expected to do so.
There is some consolation for dependents on the SA economy in current circumstances. We are not dependent on imported oil or gas to generate electricity, as is Europe for example. Domestic coal is the feed stuff for our energy that also provides a domestic source of chemicals and refined petroleum. And renewables will play a more important role in the future. As will electric vehicles. We should have planned for a reserve of refining capacity but appear not to have done so. Should we now optimistically plan for a more stable oil market, one much less disrupted by choke points in the Middle East?
The update on the RSA Budget released on November 12th was well received in the Bond, Currency and Share markets. The yield on the benchmark 10 year RSA Bond gained 12 bp on the day to continue an extended bull run in RSA Bonds that began in April 2025. When doubts about the endurance of the government of national unity (GNU) were most pronounced. The yields on conventional RSA bonds of five year’s duration have fallen consistently from over 9% p.a. to 7.8%. since April. The republics cost of borrowing dollars has fallen even more significantly from 7.2% p.a. in April to the current 5.1% p.a. Representing a sovereign risk spread of 1.4% p.a. and less than half the risk spread of early April.
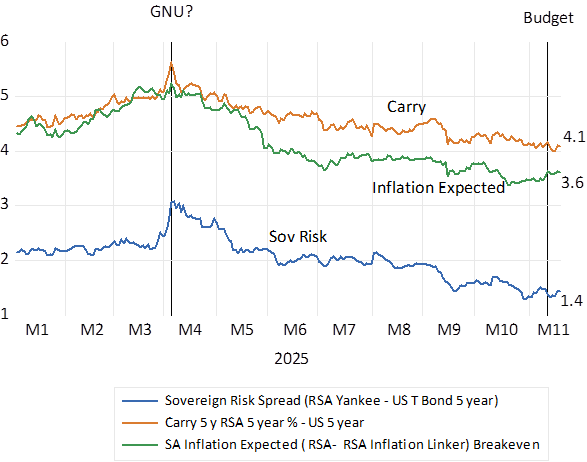
The difference between RSA and USA five-year yields – the carry or the cost of hedging dollars over the next five years, or equivalently the compound rate at which the ZAR is expected to weaken against the USD over the next five years, has fallen in line, from over 5% p.a. to the current 4.1%. The bond market is now factoring in an average rate of inflation of 3.6% p.a. over the next five years. Down impressively from over 5% p.a. inflation expected in April 2025. And the mighty ZAR since April has gained about 10% against an equally weighted Index of the USD, Euro, Aussie, and the Chinese Yuan since April 2025. The GNU has surely produced a kind of very welcome economic magic.
Long term interest rates in 2025. Daily Data.
Source; Bloomberg and Investec Wealth & Investment
Interest rate spreads in 2025 (Daily Data
Source; Bloomberg and Investec Wealth & Investment
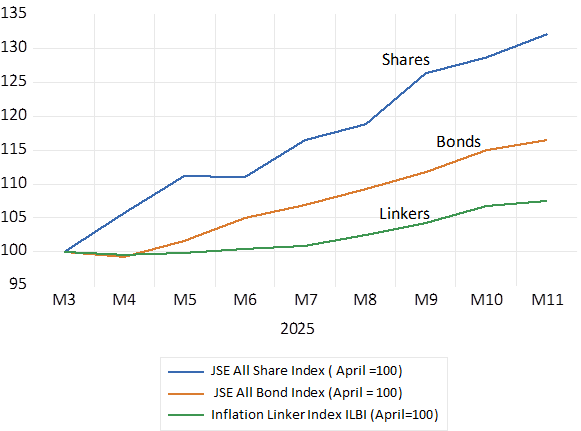
JSE Stocks and Bonds (April 2025=100)
Source; Bloomberg and Investec Wealth & Investment
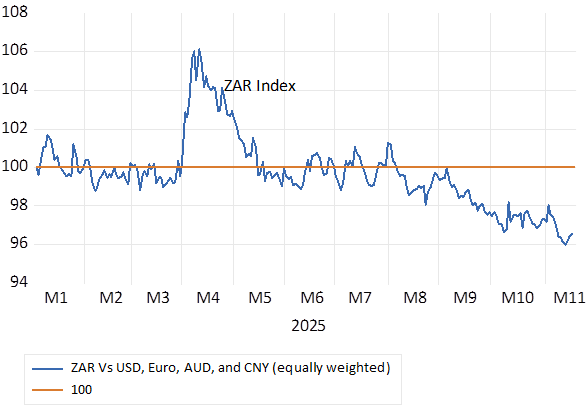
The mighty rand in 2025 Vs USD, Euro, AUD and CNY. Equally weighted (2025=100) Daily Data
Source; Bloomberg and Investec Wealth & Investment
The Budget update confirmed that South Africa could reverse unfavourable fiscal trends and contain the growth in government spending and so avoid monetising the considerable national debt. And a further favourable force was that the target for inflation of 3% p.a. while accepted by the Treasury, was helpfully qualified by a one per cent band around 3% p.a. and accompanied by a phasing in period. Thereby improving the outlook for lower short-term interest rates and growth. The GNU cannot claim all the credit. The rise in precious metal prices plus the stability in industrial metal prices has helped to add to government revenues and improve the balance of trade – to improve further the fiscal and growth forecasts this year and the case for SA bonds the rand and the JSE.
Faster SA growth would be boosted by lower short- and long-term interest rates. There is growth enhancing scope for declines at both ends of the yield curve should the expected rate of inflation decline further. Which it could but only were the ZAR to continue to hold its own with its low inflation trading partners.
The supply side of the SA economy has been boosted by the strength of the ZAR in a low inflation world. The demand side of the economy has remained depressed by the high cost of bank and other credit. Lower inflation means more expensive credit and less demand for and supply of it from the banking system. Lower short-term interest rates would predictably stimulate spending by SA households and firms and raise growth rates.
Would such welcome trends mean more inflation? Not necessarily – inflation in the future would as in the past depend on the ongoing behaviour of the ZAR. Faster growth would mean increased demands for imported goods and foreign currency. But it would also simultaneously encourage inflows of foreign capital including to the bond market and discourage outflows of SA savings. The larger deficits on the current account of the balance of payments (extra demands for USD) would be matched by larger net inflows of foreign capital willing and to participate in faster SA growth (extra supplies of USD). If so, the rand could be well supported and the inflation rate contained. Faster growth with no more inflation is a virtuous cycle that we can only hope will be put to the test over the next few years. Reserve Bank permitting.
The immediate task for the Treasury is to fulfil its plans for containing government debt. But it should help taxpayers in two further essential ways. Firstly, to show belief in its own inflation targets and to borrow for shorter rather than longer periods and roll over short term debt for longer term debt as inflation and interest rates recede. The Treasury concern with so called roll over risk (a possible inability to borrow short to retire longer term debt) has been a very expensive fear not in fact shared by the rating agencies.
And another task for the Treasury, that it has long been aware of, and has egregiously failed to deal with, are the huge and unaffordable national liabilities of the disgraced Road Accident Fund. Claims on it must become realistic given taxpayers ability to pay and the responsibility for insuring against road accidents devolved, as is all other insurance, to the private sector.
The slope of the RSA yield curve. Ten-year less one year RSA yields 2020-2025 (Daily Data)
Source; Bloomberg and Investec Wealth & Investment
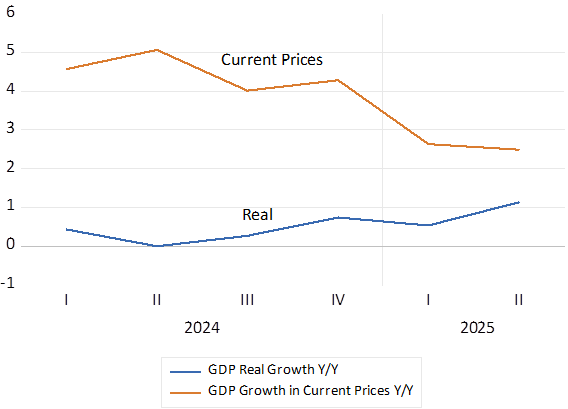
There is a welcome spring in the step of the SA economy. As revealed modestly by the latest National Income accounts released this week. The GDP in Q2 2025 was estimated as 0.8 per cent higher than in Q1. Slightly ahead of consensus and about one per cent up on the same quarter a year before. On a seasonally adjusted annualised basis equivalent to 3.5% p.a. growth, Which, if sustained would be most surprising, and politically consequential, given next year’s municipal elections.
Growth in SA GDP- (Y/Y) in Real and Current Prices. Quarterly Data.
Source; Stats SA and Investec Wealth and Investment
Is faster growth anything like this order sustainable? Supply side reforms work gradually. But to immediately improve the performance of the economy incomes there is a simple remedy easily implemented. That would be to significantly lower the cost and availability of credit for households and firms. The impact of small declines in these costs may in fact already be helping to advance household spending. The stronger growth in household spending to date was one of the GDP positives in Q2 and perhaps beyond.
The seemingly obvious case for lower interest rates, given their current levels relative to sharply declining inflation rates and given the very slow growth in the demand for and supply of bank credit by the private sector, is being strongly resisted by the Reserve Bank, in its efforts to permanently lower inflation to no more than 3% p.a.
Will lowering interest rates be more inflationary should spending and so growth rates improve, that is causing not only increases the demand for but also increases in the supply of goods and services? I would suggest that prices in SA including the CPI it will depend in the future, as inflation always does in South Africa, on the behaviour of the rand. And so on the cost of imports and the prices of exports that together play such an important role in our economy that is so open to trade. In Q2 2025 exports and imports together were equal to 60% of GDP – with exports 6% larger than imports in Q2. Clearly the exchange rate must matter a great deal for the path of prices in general, as it has so conspicuously influenced the direction of prices in SA recently.
The impact on prices facing consumers and firms along the supply chain encouraged by stronger demands would depend on the dollar and rand prices attached to these imports and exports, that is significantly on the exchange rate. Given a stable exchange rate, more growth with more goods and services imported and less exported becomes distinctly possible – without more inflation. And the feed back of faster growth to improved tax flows would also help improve the outlook for fiscal sustainability. The possibility of more growth with no more inflation, given rand stability, is surely a risk well worth taking. It is this vote gaining possibility the Minister of Finance is presumably pursuing with the Reserve Bank.
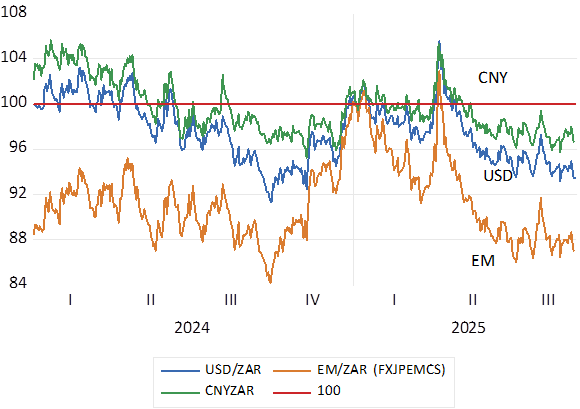
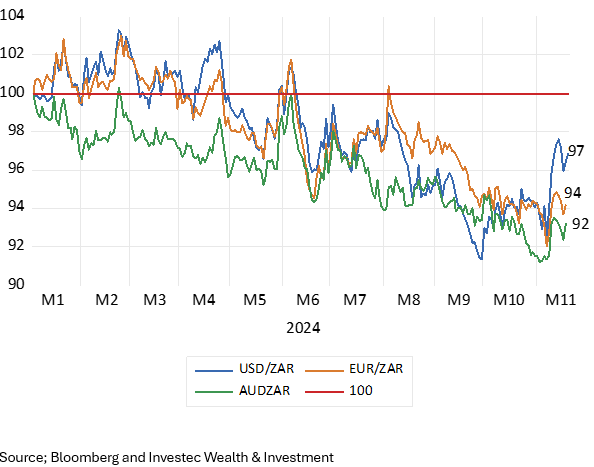
The surprising and most helpful of recent economic developments has been the strength of the ZAR. Strength against the weaker dollar but also against most of our important trading partners, including China.
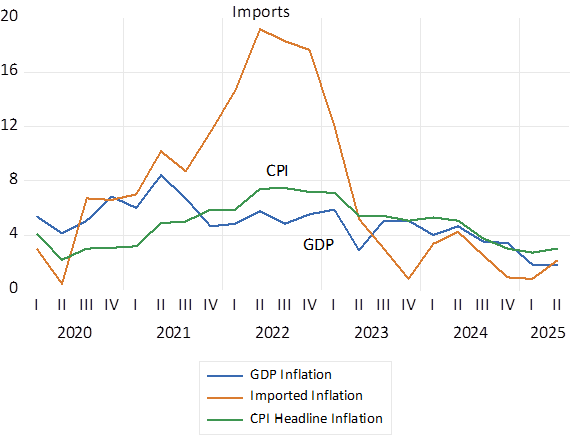
The post covid rand weakness forced import prices much higher to a peak year on year inflation rate of close to 20% in early 2022. The increases in prices charged have rapidly fallen away since with the recovery of the ZAR and have stabilised CPI inflation and the inflation of the prices of goods and services included in GDP- in the GDP deflator. So much so that GDP – measured in current prices rose by only 2.5% in Q2 – a mixed blessing because the much-watched ratio of Debt to GDP has accordingly risen. We are not inflating away our debt problem- rather the opposite – to the apparent approval of the bond market.
Inflation; Year on Year Changes in the Price Index for Imports, GDP and the CPI. Quarter End Data
Source; Stats SA and Investec Wealth and Investment
The ZAR Vs the USD, the EM Basket and the Chinese Yuan (January 2025=100) Daily Data 2025.
Source; Bloomberg and Investec Wealth and Investment
Yet the lower realised rates of inflation have helped to reduce inflation expected and the level of long-term interest rates. The yields on long dated RSA bonds – both rand and dollar dominated – have moved smoothly lower – as they have for other EM borrowers – despite the volatility in the US Treasury Bond market. This has made for highly satisfactory returns on investors in long dated EM, including RSA debt. Yet the SA economy plays on the JSE have had to struggle on, given the interest rate repressed, weakness of demand for their goods and services. A little TLC from the Reserve Bank would make a large difference to their valuations and all dependent on the SA economy. And to SA politics.
Bond Yields; RSA and USA. 5 year % p.a. Daily Data 2025
Source; Bloomberg and Investec Wealth and Investment
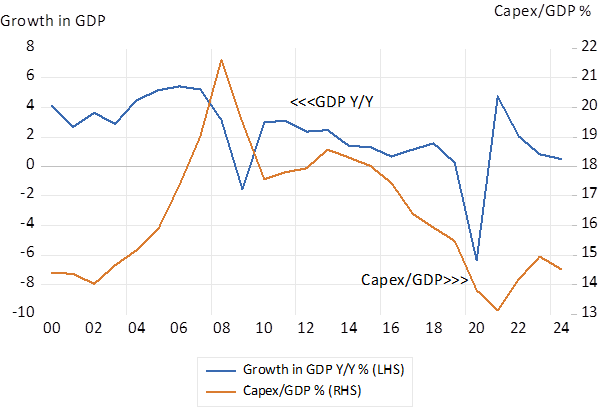
It is common cause that expenditure on capital goods in South Africa is not nearly high enough to sustain faster economic growth. Capex now runs at about 15% of GDP. It was 21% in 2008 after the economy had enjoyed a period of strong growth- averaging close to 5% p.a.
These broad trends – growth and capex rates rising and falling in the same direction – indicate that growth in household spending and incomes, especially in corporate incomes, leads and capex follows. We need faster growth to gain more capex and vice versa.
SA; Growth in GDP and the Capex to GDP Ratio 2000-2024. Annual Data
Source; SA Reserve Bank and Investec Wealth and Investment
Moreover, the most important source of domestic savings with which to fund capex (over 100% of all gross savings given government dissaving on a large scale and household saving largely offset by household borrowing) are made in SA by profitable businesses themselves. Savings in the form of cash retained by them rather than paid out in dividends or shares bought back. For society more capex more growth to come, rather than cash paid out is the preferred outcome.
Raise demand, raise incomes and profits and so business savings and increased capex will follow to sustain faster growth in spending. And should domestic savings be insufficient to fund the capex foreign savings attracted by the same growth in profits and improved returns can fill the gap. And fund the increase in imports that will accompany faster growth and add supplies of goods to help match increased demands for them.
The current account of the balance of payments goes into deficit that net capital inflows automatically match. And help to stabilise the exchange value of the ZAR. This is the virtuous cycle of growth that sustained the economy in the first decade of this century. Faster growth without more inflation.
The Current and Capital accounts of the Balance of Payments
Source; SA Reserve Bank and Investec Wealth and Investment
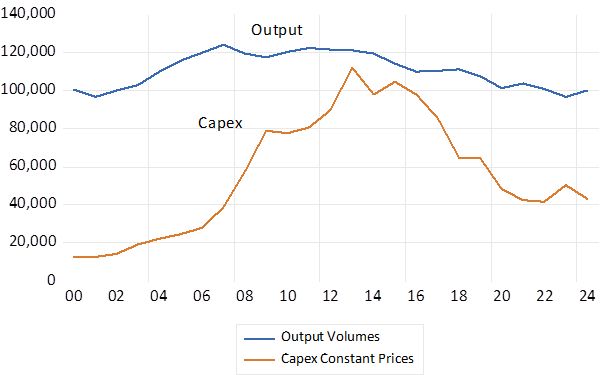
Alas much of the extra capital raised and invested in South Africa over the past 20 years was wasted on a large scale. Returns on capital invested by Eskom and Transnet have returned less than one per cent per annum on average. (See Business Day April 4th 2025) The huge capex programmes undertaken by Eskom in the early 2000’s have been accompanied by declines in the output of electricity –insufficient rather than excess capacity – with demand forced lower by growth destructive increases in the price of electricity.
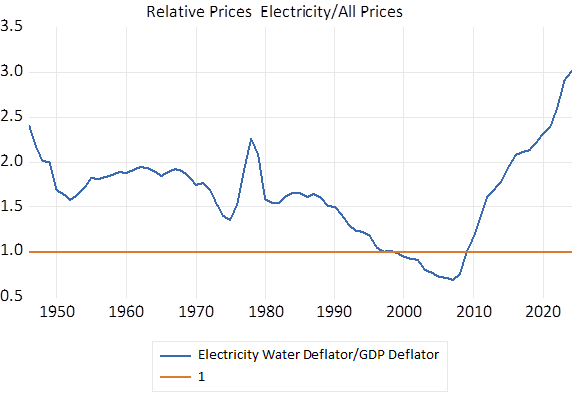
Capex on electricity and water- mostly electricity- Kusile and Medupi- in constant prices- grew by more than five times in real terms while the output of electricity and water in the same constant prices, peaked in 2008 and has been in decline ever since. As has capex. The price of electricity has increased three times faster than prices in general since 2000- to cover the inflated costs of construction and operations – up by over 14% p.a. on average. A growth destroying combination of wasted capital, bloated operating costs and much higher prices, that was a high additional tax on disposable incomes.
Electricity and Water; Output Volumes and Real Capex; 2015 Prices Annual Data. R millions
Source; SA Reserve Bank and Investec Wealth and Investment
The Price of Electricity and Water- Ratio to GDP Price Index (Deflators)
Source; SA Reserve Bank & Investec Wealth and Investment
The Electricity and Water Price Index.
Source; SA Reserve Bank & Investec Wealth and Investment
The growth rates achieved between 2003 and 2007 now seem like an impossible dream. Dreams or nightmares to come will depend not on the volume of capex to come but more so on the quality of the capex undertaken. Quality as measured by realised returns on capital.
The waste of capital to date and the outcomes in the public sector more generally has not been accidental. Just follow the money to understand why it is what it is. The actions of the managers of South Africa’s public sector and their governing boards have not been driven by return on capital. As we learn they have seen their income earning potential derived from generous salaries and bonuses and other benefits of employment, armed guards perhaps, and including expensive travel allowances and payments for attending unnecessary meetings. Added to the huge temptation, often exercised, of perverting the very valuable contracts signed with service providers.
KPI’s that emphasise bottom lines or better still on returns on capital realised are essential to the purpose of improving the quality of the capital employed. It is indispensable for any business hoping to survive the threat of competition. Raising additional capital to be employed in SA, absent the discipline of required cost of capital beating returns, is very likely to be wasted.
It may be possible to introduce private sector style incentives to the public sector. But absent the forces of competition constraining the price setting power of public sector monopolies, it remains something of a dream. The alternative to economic stagnation is the firm recognition that only private ownership of capital and private production, imbued with the right incentives, can help improve the performance of the SA economy. Surely the evidence points overwhelmingly to this wake-up call.
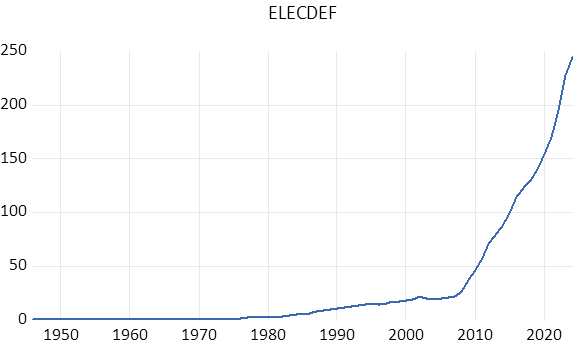
The Road Accident Fund (RAF) has been much in the news, for the usual dispiriting reasons. The RAF is a very important, tax funded spender. It manages great complexity with over R50 billion of revenue and expenditure a year. A formidable amount that the Treasury expects to increase at an annual average rate of 19% p.a. over the next three years, from R53.1 billion in 24-5 to 89.7 billion in 2027/28.
The RAF, as a social service, and its 50 plus billion bill can be compared favourably, or is it unfavourably, with other kinds of tax funded expenditure. The old age grant now runs at 117bn, and the child support grant at R90.4b in a Social Development Budget of R422b. The RAF is estimated by the Treasury to have a negative asset value (liabilities over assets of R370b – rising to R423b by 27/28) Can South Africa afford such largesse? Could not other spending make a better claim? Or lower taxes be a better idea and win more votes than the RAF?
Fall off your bike or the mountainside, get bitten by a shark or a snake, drown in the sea river or lake and society commiserates and hopes your damages are covered by some insurance. Society cannot hope to do much more for the victim given a lack of resources. But, get unlucky on the road, have a car push you off your bicycle, or the pavement, and SA society comes to the rescue- very expensively.
The payments by the RAF are funded by a levy on the price for petrol and diesel, set at R2.18 rands per litre of unleaded petrol. That is now about ten per cent of the price paid at the pump. A stealth tax paid for benefits the wider public surely does not recognise very well. How many drivers/taxpayers are aware of how much they are paying for the RAF when they fill up. And who, other than the successful claimants on the fund, are aware of the scale of the benefits provided? Bad luck is not expected. It sadly just happens
Compulsory third party insurance elsewhere is typically covered by private insurance companies and the premiums they raise from vehicle owners. As it was once long ago in South Africa until superseded by the RAF – mistakenly surely.
According to the report of the RAF for 2023- 04, there were 79,377 new claims registered that financial year, and 63,015 claims settled. The average claim on the Fund had grown by 9.5% to R287,000. 159,122 such claims were made in 23-24, a sharp decline from the 374,000 claims made in 2019.
Total outlays of the RAF were R45 600 million in 2023-04, of which payments made to compensate for incomes lost were R21.6b, or a chunky 47% of all payouts. The average claim for earnings lost was R1.2m, So called general damages paid amounted to R12.7b or 28% of total payments made.
The Fund, out of financial necessity, has succeeded recently in reducing the number of personal claims made and improving the rate at which claims are paid out. And in reducing legal fees incurred. The sums paid out have increased at a slower rate from R42b in 2019 to R45.6b in 2024.
Further slowing down the growth in payouts is essential. A first step would be to ensure that the loss of future income, inflation adjusted, was appropriately discounted by the high after realised inflation yields available from the RSA available to any beneficiary with a lump sum pay out. Somewhere close to a real and certain 5% p.a. for ten years.
On a claim for the allowed maximum R350,000 of annual income lost, for say an agreed ten years, to which an agreed inflation rate of say 5% p.a. were added each year, the payout, equal to the present value of the future agreed income losses would be R3.4m when applying an 8% discount rate (5% inflation + 3% real) or close to R3m, R400,000 less when using a higher discount rate of 5 % p.a. above inflation.
Still much less would have to be paid out were the years of lost income more strictly limited, and the income inflation rate were assumed to be much lower. The accident victim could moreover be forced to buy a monthly annuity in exchange for the larger lump sums agreed. A regular source of income would be more socially desirable than a lump sum easily squandered. Insurance companies could compete for the lump sum provided by the RAF offering an annuity to be administered by them on behalf of the client. And collect the income tax due, as they do with any administered pension. A further way to reduce the net cost of the RAF.
The liability for the annuity offered would likely be matched by the insurer purchasing a government bond of similar duration. Hence helping to fund government debt, perhaps less expensively. Most important, vehicle owners could be encouraged to substitute private accident insurance for the RAF. It would need tax incentives to have them convert. The savings for the taxpayer of private third-party insurance could be immense. The RAF law would have to be amended to allow some of these changes essential for fiscal sustainability.
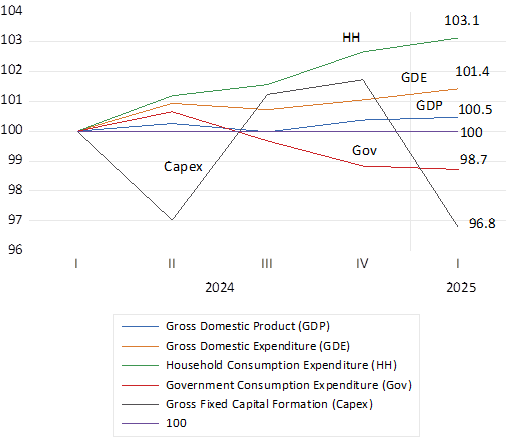
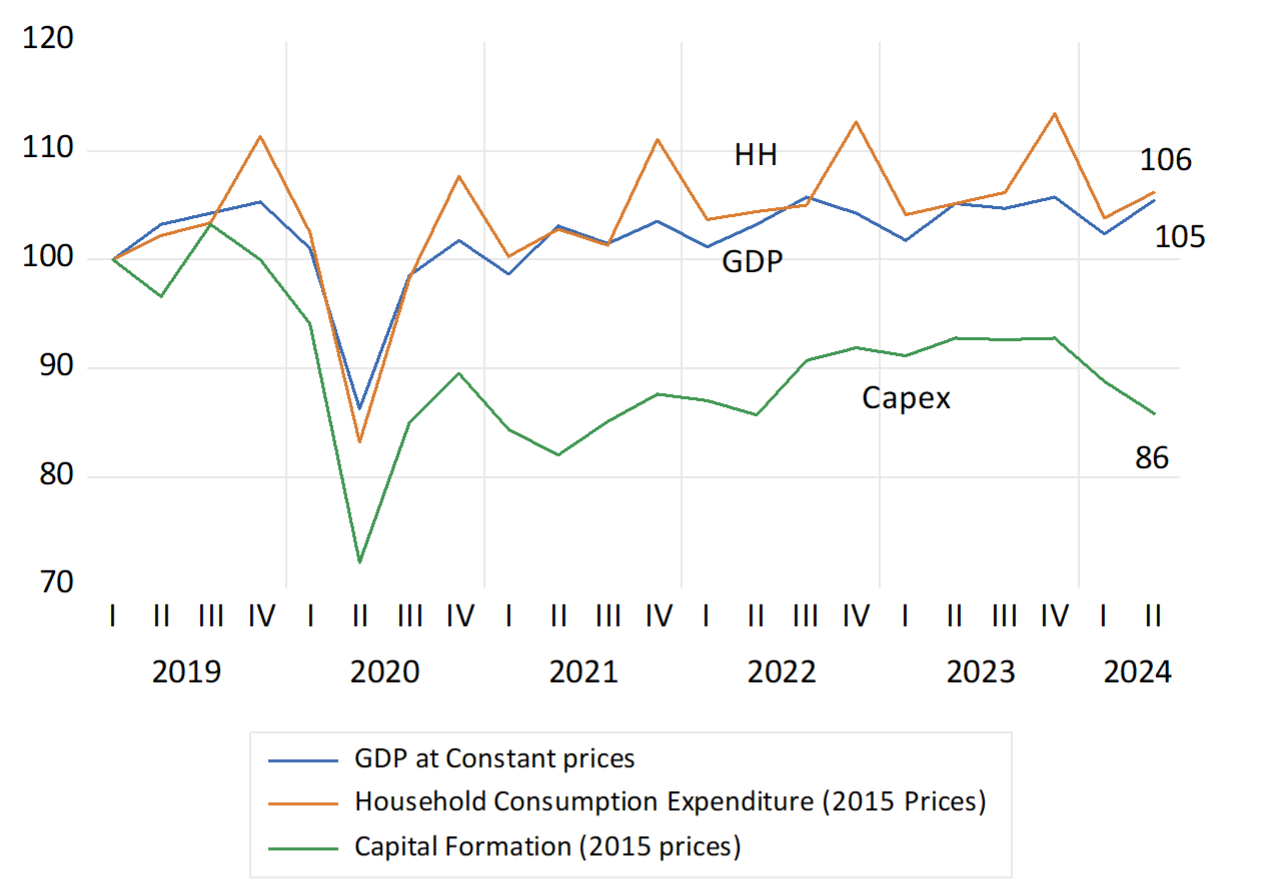
The real economy continues to make little progress, according to the latest National Income estimates for Q1 2025. Output (GDP) has stagnated, higher by a mere half of one per cent since Q1 2024. The expenditure side of the economy (GDE) has consistently fared as poorly, up by 1.5% since then helped to a small degree by a 3.1 per cent increase in household consumption. Government consumption expenditure, that excludes the welfare grants in cash that find their way into household spending, has also been a drag on the economy. Down by 1.3%, while a bigger drag on growth has been capital expenditure by firms and the government that is now 3.2% lower than it was in early 2024. A baleful reality that seems to resonate everywhere except at the Reserve Bank.
South Africa; National Income Flows Quarterly Data 2024-2025 (2024=100)
Source; SA Reserve Bank, Investec Wealth & Investment. (Quarterly seasonally adjusted data at constant prices)
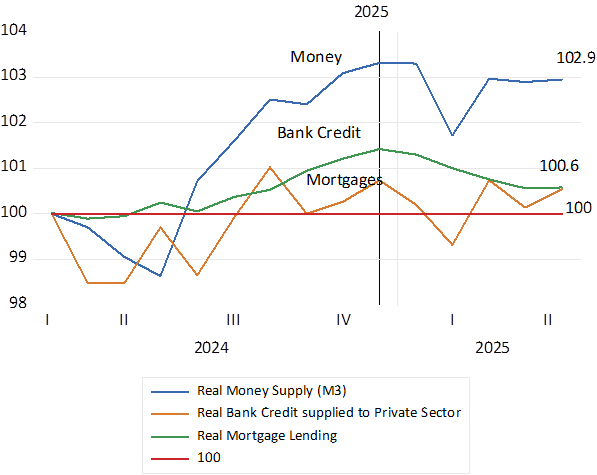
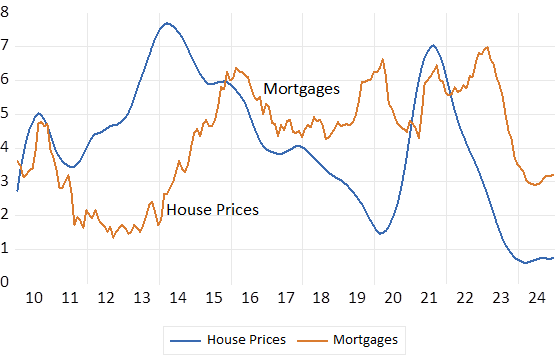
The lack of demand is easily explained by the money supply (bank deposits) and the credit supplied by the banking system. In 2025 the money supply and supplies of bank credit and mortgages, adjusted for inflation, have been in retreat and are barely above levels of early 2024. Clearly the lack of demand for money and credit can be explained by their high real costs.
Money Supply and Bank Credit Adjusted for Inflation; Monthly Data (2024=100)
Source; SA Reserve Bank, Investec Wealth & Investment.
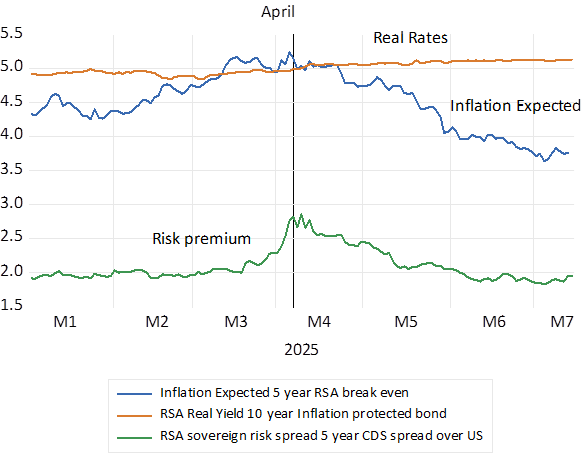
One notable improvement in financial conditions has been the decline in the inflation rate to below 3% p.a. Perhaps even more worthy of notice is the decline in longer term interest rates since April, when the anxieties about the Budget and the survival of the GNU were at their most intense. The 10, 5 and 1 year bond yields are off by 128, 89 and 25 basis points respectively. Truly big moves at the long end. Largely because expectations of inflation in SA have been revised significantly lower.
Inflation expectations are implicit in the differences in the yield on an inflation exposed bond and its inflation protected equivalent. These differences in nominal and real yields for five-year RSA’s have declined impressively from 5.14% p.a. in April 2025 to 3.75% this week. Perhaps because the Reserve Bank has committed itself to a 3% inflation target. But more likely because inflation itself has receded so sharply. Inflation leads and inflation expected follows – not the other way round – as the Reserve Bank likes to contend.
However, the SA specific risks explicit in bond yields, while 50 bp lower than they were in April are still highly elevated, now just under 2%. For five year RSA’s. And the fully inflation protected RSA 10 year bond yield remains above a risk infused real 5% p.a. This implies a very high real cost of capital for SA business that suffocates capex spending, especially when demand for the goods and services they produce remains so depressed – and is expected to remain so. And when short term borrowing costs are not expected to decline by more than 25 bp over the next 12 months.
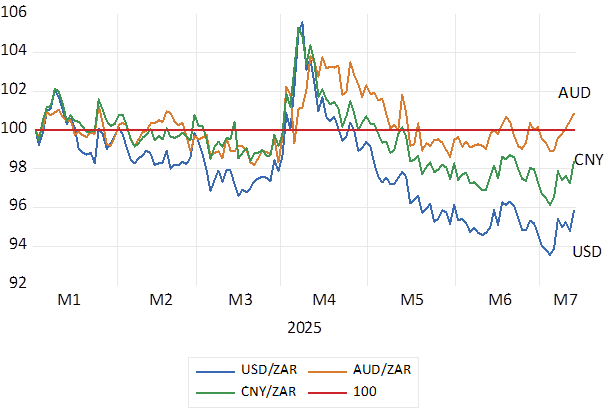
Inflation is down because demand for credit with which to buy is severely repressed. And because the rand has maintained its strength against most currencies. And in line with the bond market the ZAR has strengthened significantly since April 2025 for GNU related reasons. It is noticeable that the rand has weakened against the Chinese Yuan (our largest trading partner) at no more than an average about 1% p.a. rate since January 2021. One reason why Chinese motor cars are as cheap as they are. (despite Tariffs)
The ZAR Vs the USD, the Aussie and the Chines Yuan. (2025=100) Daily Data to 14th July 2025.
Source; Bloomberg, Investec Wealth & Investment
Real Rates, Inflation Expected and the RSA risk premium. Daily Data 2025
Source; Bloomberg, Investec Wealth & Investment
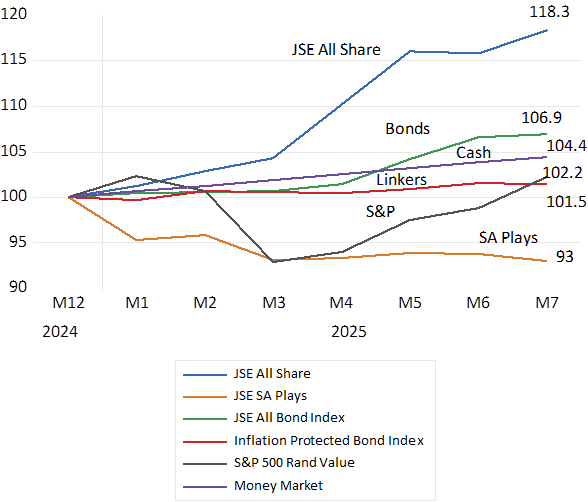
The stock market has nevertheless brought some welcome cheer. The JSE All Share Index has returned a whopping 18% this year. This run has everything to do with precious metals- platinum and gold in that order. Though the performance of the SA Economy Plays on the JSE reveals the dismal reality of a stagnant economy. The return on my constructed Index, market value weighted, of SA plays that includes the slow growth defying Clicks and Capitec, is down by seven per cent this year.
Growth can improve with governance and supply side reforms and less SA risk. Including reforms that can get more gold and other minerals legitimately out of the ground. Common cause surely. But faster growth needs the essential accompaniment of a more sympathetic monetary policy. That would hence reduce SA risk, sustain a stronger rand and lead to less inflation. Three per cent inflation is possible without squeezing further life and growth out of the demand side of the economy.
Total returns from the different SA Asset Classes in 2025. Month end data. (January 2025=100)
Equity equivalence is a better alternative to giving away a significant chunk of equity in a good business to some undeserving party with the right lucky credentials, racial and or political. It has been used in SA before Starlink, as in the allocation of the original casino licences in the Western and Eastern Cape in the late nineties. Bidders competing for the limited licenses were required to qualify for them by offering the wider community valuable add-ons of their own invention. The support of Sun International for the establishment of the Cape Town Convention Centre helped win them the valuable right to operate the only Casino in Metropolitan Cape Town.
The same opportunity for the Gauteng Government to establish what could have been a highly profitable monopoly Casino in downtown Johannesburg, with an accompanying and competitively determined large contribution extracted for the renovation and sustainability of the precinct, was proposed at the time. And rejected as politically unacceptable given competing and powerful empowerment interests. En kyk hoe lyk dit nou.
Presumably Starlink has attached value for its shareholders in the opportunity to supply its internet connections to rural South Africa. And is willing to pay up in advance in the form of conspicuous public benefits for the opportunity to earn these potential profits.
The same principal of equity equivalence could be or could have been applied to the award of the right to operate the State Lottery. Clearly this right is a valuable one judged by how much the contending parties have been willing to spend challenging the award in the Courts. How much better it would have been for the SA public and its taxpayers if the Minister could choose between the contending and technically and racially qualified partners simply on how much cash, or better, in equivalent benefits, they would have been willing to pay up for the lottery license?
Though the ratio of the lottery revenue to the cash paid out by the lottery to its winners, merely 50%, the lottery is a very poor gamble. Though the charities and others who receive the grants paid for by the lottery, part of the 50% retained after salary and other expenses, can be regarded as a compensating public benefit that the mostly low-income lottery players are paying for. Provided that is the lottery grants are awarded on merit; which it appears sadly, may not be the case.
The value of a license to operate a Casino, or a gambling machine in SA, has surely been competed away. By internet-based gambling houses supplying a convenient phone based and easily scalable service to gamblers with essentially very low fixed costs. And with minimal operating costs in the form of a few programmers using probably codes taken off the shelf. And games that now presumably are even more easily enhanced with the aid of AI. The internet does not require an expensive to build and maintain a physical Casino. Or pay its croupiers, clerks and security officers. Or provide prize money to keep horses racing so that gamblers can bet on them.
The gambling market in SA appears as highly competitive judged by the barrage of adverts directed at gamblers watching sporting events encouraging them to join the action so easily through their cell phones and gambling accounts. By a variety of licensed operators. Highly profitable businesses usually see their profits competed away. I am confident this will prove the case in time for the rapidly growing sports betting industry.
The competition for the bets made by the gambler takes place in part through the odds offered. Improve the gamblers odds of winning or losing less, reduce the share kept by the house, and the bets placed with a house will tend to increase. The highly competitive casino market in Las Vegas proves the point. Casinos there compete publicly on the odds offered.
Yes, the average gambler must lose to keep the house in business. But the average loser is surrounded by a presumably normal distribution of above average winners and below average losers, per day, year, or even over a lifetime of what some presume is irrational gambling. You may just get lucky. And there is fun to be had in playing the odds, win or lose, as ever larger number of betters on sporting events confirm. Though gambling and losing more than can be afforded can become dangerous to the addict.
For the internet gambling houses their most important cost will be advertising and promoting their plays on TV. It may be of some consolation to the non-gamblers to recognise that this spend on TV is in fact paying for the sport they are watching. It is the competitively determined – and rising value of the TV rights to broadcast the games and to advertise betting opportunities on them, that pays the wages of the players and determines the value of the clubs that hire them. And reduces the profits of the internet gambling house. Provided there is no licensed monopoly to limit competition.
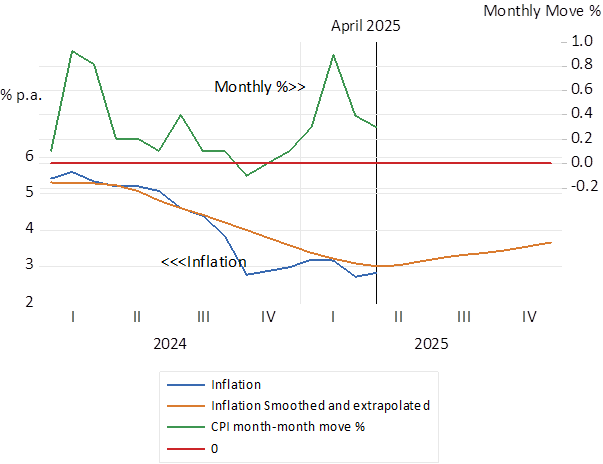
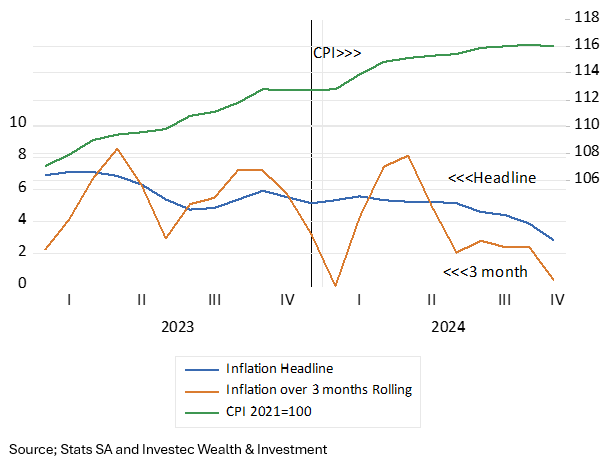
Inflation in SA has declined sharply from a 5% plus rate in early 2024 to 2.8% p.a. (see below) If current trends persist the rate of inflation will rise to about 3.5% by year end. We consider the reasons for the recent decline in inflation and the conditions that could give rise to persistently low inflation in SA, that is 3% p.a. or lower inflation sustained over an extended period.
South African Inflation (2016 – 2025) Monthly (Annual % change in CPI Index)
Source; Bloomberg, SA Reserve Bank and Investec Wealth & Investment.
South Africa Inflation (2024-2025) Monthly (Annual % change in CPI Index)
Source; Bloomberg, SA Reserve Bank and Investec Wealth & Investment.
The reason for this welcome relief from rising prices seems clear. The demand for goods and services has been growing very slowly, thanks to highly restrictive monetary policy. And the supply side of the economy given rand stability helped further recently by a degree of absolute ZAR strength has meant moderate increases in the CPI. Weak demand and increased supplies- lower price imports – have meant modest pressure on prices.
The demand side
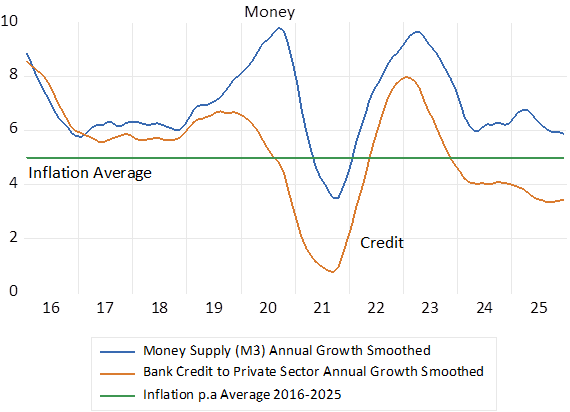
The growth in the money supply and bank credit, that influence spending in a direct way, has remained highly restrained for an extended period- going back to 2016. Money supply (bank deposits) have grown by an average 7% p.a. since 2016 and bank credit supplied (accounting for a large majority of the asset side of the bank balance sheets) has grown by an average 5.3% p.a. Inflation has averaged 5% p.a. over these years, implying real growth rates of the supply of money and credit, in line with the slow rates of growth of output(GDP) and national incomes.
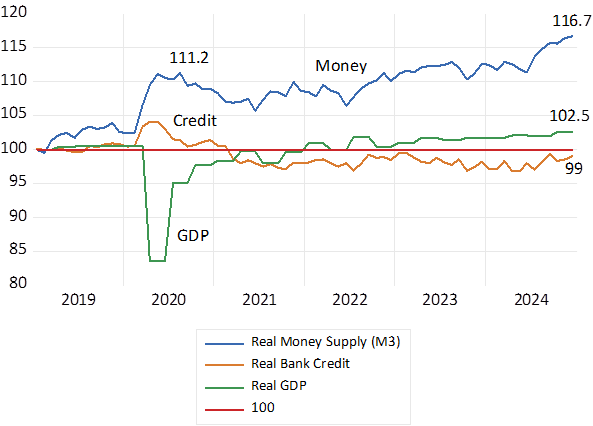
Reactions by the Reserve Bank to the Covid lock downs led to a brief spurt in money supply growth in 2020-2021. Money and credit growth picked up again in 2022-23 as commodity and metal prices recovered but then as abruptly fell away. Both money and credit growth have declined consistently since then. Real bank lending to the private sector is below pre-Covid levels as is GDP. The money supply- that is mostly bank deposits, is barely up (by a mere 4%) since 2020. Given such financial repression, any upward pressures on prices from extra spending – from the demand side of the price equation, were surely not possible. Furthermore, this lack of demand itself would have been inconsistent with real GDP or GDE growth of more than one per cent p.a. since 2023- as has been the case. Growth as well as prices respond to a mixture of supply side and demand side forces. When real demand grows very slowly as it has in South Africa, real income growth cannot advance at a much faster rate. Regardless of what may well have been faster potential growth. One can never know what might have been with less austere monetary policy settings.
The money supply and credit cycle 2016- 2025. Monthly data annual growth rates
Source; Bloomberg, SA Reserve Bank and Investec Wealth & Investment.
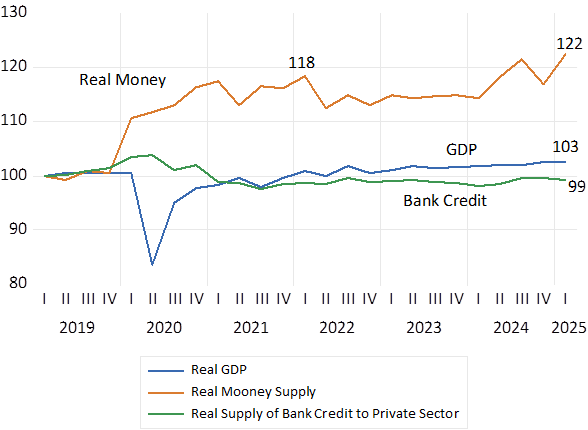
Real Money Supply (M3) and in Bank Credit supplied to private sector. (2019=100)
Source; Bloomberg, SA Reserve Bank and Investec Wealth & Investment.
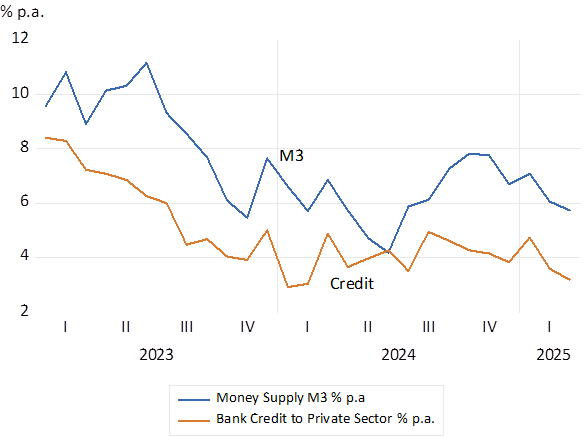
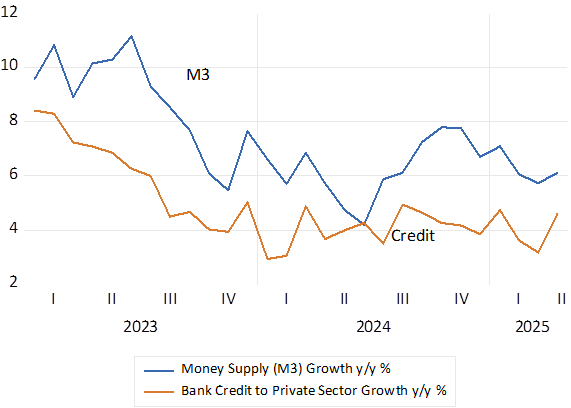
Since early 2023 the growth in the money supply and bank credit- at current prices- has declined significantly as is shown below. The trends, especially when adjusted for (lower inflation) have continued to restrain spending.
Growth in Money Supply and Bank Credit 2023-2025. Monthly % p.a.
Source; Bloomberg, SA Reserve Bank and Investec Wealth & Investment.
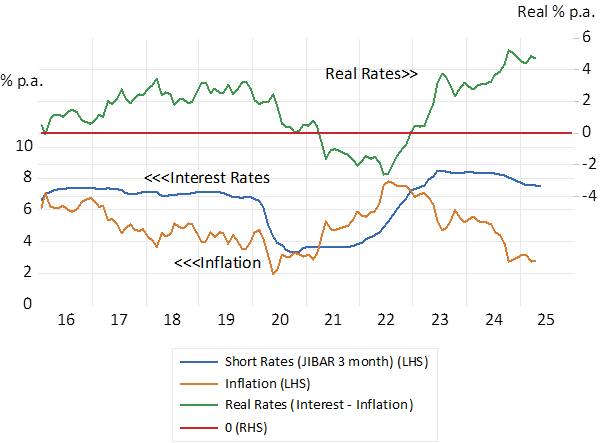
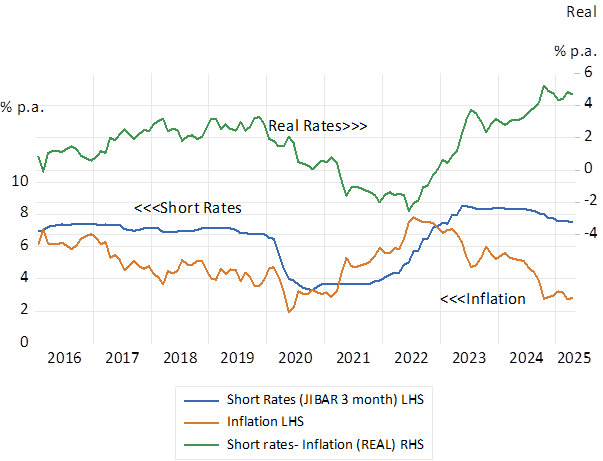
Monetary policy must also be judged as highly restrictive by observation of policy determined short term interest rates. When interest rates are adjusted for falling rates of inflation, to approximate the real cost to borrowers of raising credit it may be seen that real interest rates are at a post 2016 peak. The Reserve Bank does not target money supply or credit growth rates. The instrument of policy is its interest rate settings. Policy determined short term interest rates were hiked sharply in response to higher inflation, post Covid. This represented a highly predictable SARB interest rate response to a supply side shock to prices. A shock linked to the Ukraine crisis, combined with a weaker rand. Borrowing costs are now lagging well behind the more recent decline in inflation sending real rates to very high demand suppressive levels. Clearly borrowing from the banks to fund working capital or a mortgage on a home loan has been strongly discouraged by the high real costs of or rewards for money and credit. And the demand for and supply of bank credit have accordingly grown at a very slow rate.
Significant relief for borrowers is not expected any time soon. The forward rates of interest on May 25th indicate a mere 25 bp reduction in short rates over the next twelve months. Without significantly lower interest rates to encourage the growth in demand for bank credit and spending by households and firms, GDE will not grow beyond forecast GDP growth rates of less than 2% p.a. And too little rather than too much spending (relative to potential supplies of goods and services) will continue to weigh heavily on the pricing power of domestic producers.
That is without pressure on prices emanating from the supply side of the economy that could independently force prices higher- and demand still lower in response to supply side driven higher prices. Especially should higher interest rates follow supply side shocks- as has so often been the been the case in SA. The Reserve Bank has predictably increased interest rates, whatever the cause of higher prices, less supplied or more demanded. Though the pressure on prices has almost always come from the supply side – from exchange rate weakness. shocks. As was the case most recently in 2022. Ideally temporary supply shocks on the price level should be ignored by monetary policy.
Short term interest rates before and after inflation. 2016-2025.
Source; Bloomberg, SA Reserve Bank and Investec Wealth & Investment.
The Supply side
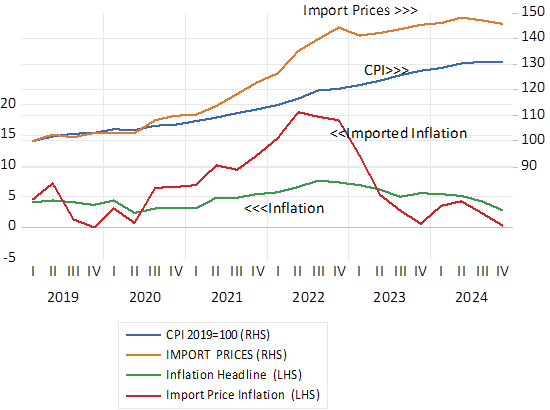
The supply side of the SA economy is dominated by the exchange value of the ZAR and the impact it has on the prices of imported and exported goods. The SA economy is heavily dependent on imports and exports- equivalent together of about 60% of GDP – and usually well balanced. The cost of an average imported good or service, and the value of an export depends on global price trends- usually expressed in USD . Their translation into rand prices is via the exchange rate. With something of a lag – as prices adjust gradually to higher exchange rate related costs of supply- higher or lower depending turn on the hedging strategies adopted. For an important influence of this kind, we can refer to the USD price of a barrel of oil that finds its way into petrol and diesel prices and the CPI will be a combination of world market prices in USD and the exchange value of the rand.
It should be recognised that the exchange value of the ZAR has remained unusually stable over recent years. As a result, the supply side of the economy, has generally benefitted from a degree of rand stability, helping to contain inflation about the 5% p.a. mark until the recent improvement. This degree of rand exchange rate stability came after the Zuma inspired, significant degree of rand weakness, of 2015, And absolute strength in the ZAR over the past year and a half has helped take the inflation rate to 3% p.a. Helpfully also the price of oil in USD and in ZAR has been in retreat for most of the period since 2022, having spiked between 2020 and 2022 in response to the invasion of Ukraine and the sanctions imposed on Russian oil. The prices of all imports to SA have stabilised and the inflation of imported goods was close to zero by year end 2024. Recently oil price trends in USD and ZAR have been very helpful in containing upward pressure on costs and prices.
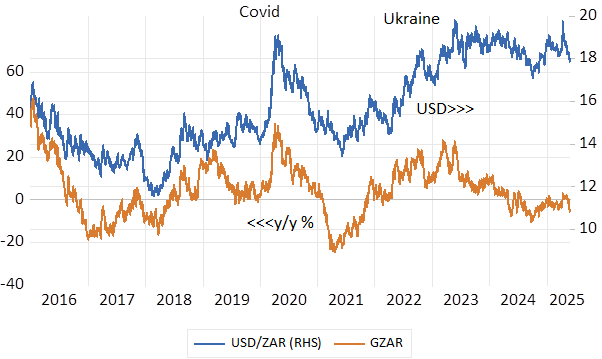
The USD/ZAR exchange rate and annual movements in the USD/ZAR (y/y % p.a.)
Source; Bloomberg, SA Reserve Bank and Investec Wealth & Investment.
The price of Brent Crude Oil USD per barrel (LHS) and ZAR per barrel (RHS)
Source; Bloomberg, SA Reserve Bank and Investec Wealth & Investment.
Price Indexes SA CPI and Import Price Deflator (2019=100) and annual % changes in Indexes. Quarterly Data
Source; Bloomberg, SA Reserve Bank and Investec Wealth & Investment.
Supply and demand working together
Inflation in SA has receded because of a combination of weak demand and an improving supply side – led by a more stable exchange rate and helpful oil prices. Inflation can stay at low levels if these supply and demand side forces are sustained.
Slow growth threatens fiscal sustainability. It raises the risk of a SA government resorting to creating money to fund government spending for want of revenue and under the pressure of a growing interest rate bill on a budget- that seriously constrains other more popular spending plans. Slow growth and the money supply responses that may accompany slow growth increases the expected rate of inflation over the long term. These expectations lead in turn to higher long-term interest rates on government debt to compensate lenders for more inflation expected. So adding to the interest costs of servicing government debt and putting further strains on government budgets.
Slow growth may restrain incomes and spending and so, absent supply side forces lead, to lower rates of inflation. But slow growth threatens fiscal stability, it discourages domestic capex and capital inflows to fund them that might have improved longer term growth prospects. Thus, weakening the exchange rate and despite weak demand putting upward pressure on prices. The relative strength of the ZAR has had very little to do with recent demand destroying interest rate settings and the consequently slow realised rates of growth since 2020 and indeed since 2016. It is almost all a supply side story – the prospect of somewhat improved growth prospects given the GNU.
The dependence of the outlook for economic growth on political developments in South Africa and therefore for the exchange value of the ZAR has been very clearly illustrated recently. More growth expected leads to a stronger rand as capital tends to flow more to than away from South Africa and vice versa, slower growth expected frightens capital away and tends to weaken the rand- and raise inflation rates.
The Government of National Unity (GNU) formed after the elections of May 2024 were regarded as more growth friendly. And the rand strengthened accordingly. Dounts that the GNU would survive the arguments over the 2025-26 Budget proposals led to rand weakness. The agreements on the Budget reached finally in May 2025 have reinforced the GNU and added too rand strength (see below) For the ZAR it is the supply side – the outlook for growth that matters most. The demand side and interest rate settings matter much less. And unaccommodating interest settings and slow growth in money and credit that slow down growth lead to rand weakness rather than rand support.
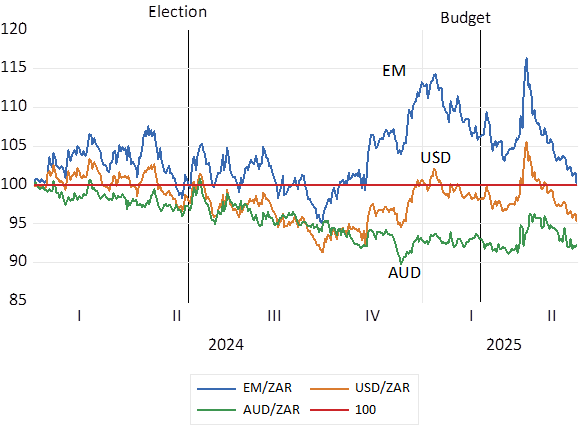
Political developments and the ZAR in 2024-2025. Daily Data. Lower numbers indicate rand strength.
Source; Bloomberg, SA Reserve Bank and Investec Wealth & Investment.
A firmer rand responding to what the markets decided would be growth improving economic policy settings has meant less pressure on inflation. Combined with sustained negative pressure on the demand side of the economy the prospect of low rates of inflation over the long run becomes more likely with supply side reforms that raise potential growth rates.
Ideally the prospect of more growth and less inflation would be recognised early by the bond and currency markets. In the form of lower interest rates and a narrower risk spread between RSA and USA interest rates. That is in the form of a narrower carry and therefore a lower cost buying dollars for forward delivery.
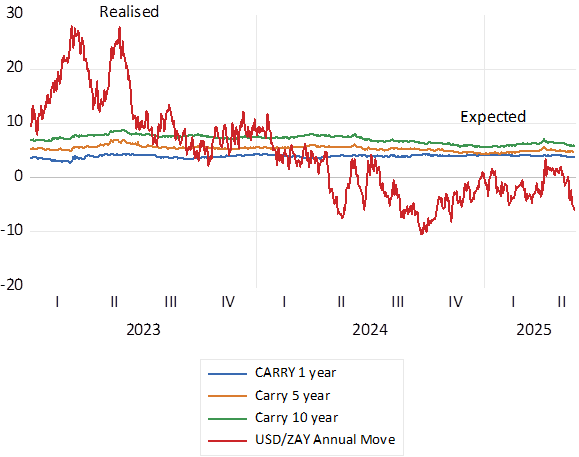
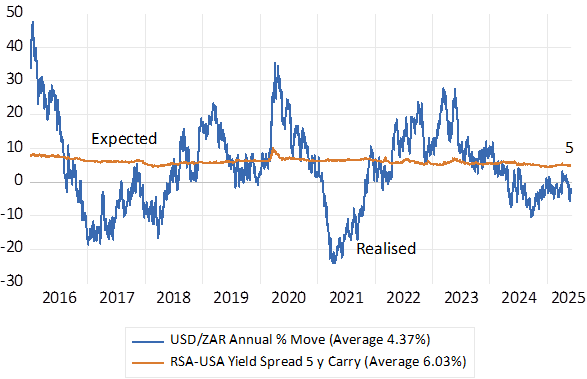
SA Interest rates, their levels and differences with US rates have still to register any marked change in sentiment about the outlook for SA growth and inflation. Forward exchange rates still consistently expect the rand to weaken, compounding at about 5% p.a. Since 2016 the difference between one year SA and US government bonds has averaged 5.1% p.a. with very little deviation about this average. The actual market movement in the rand over one year averaged less over the past 15 years by 4.4% p.a. with very wide fluctuations about the average (see below) Currently the difference between one year SA and US Treasury yields has declined to less than 4%. The carry for five year and ten year money has remained above 5% p.a.
Inflation expected in South Africa is not only reflected in longer term interest rates. It is also revealed by differences between RSA rand rates of interest and USD interest rates for securities of the same duration. These differences in interest rates indicate the expected direction of the ZAR. The greater the difference, the more the ZAR is expected to weaken over time, by application of the interest parity condition. The difference in yields is equal to the difference between the spot and forward rates of exchange. Arbitrage maintains this equilibrium condition.
This yield difference -the so-called carry- represents the cost of hedging the rand against the US dollar. The difference in yields may also be regarded as the reward for or the cost of expected exchange rate weakness or strength. What is gained on the interest rate spread is offset by (expected) ZAR exchange rate weakness. And vice versa for holders of USD receiving lower interest rate income but offset by a stronger dollar.
The wider the difference in interest rates the more expensive in ZAR will be dollars to be delivered in a year or more ‘s time. This cost of hedging will also find its way into the prices of imported goods and services. Rand weakness expected adds to inflationary pressures. To hope to sustain inflation at low rates, these interest rate differences must narrow to simultaneously reduce expected rand weakness and so ease the supply side pressures on prices especially the prices of goods or services imported.
The expected and realised move (% p.a) in the USD/ZAR over one year (Daily Data 2016-2025
Source; Bloomberg, SA Reserve Bank and Investec Wealth & Investment.
Source; Bloomberg, SA Reserve Bank and Investec Wealth & Investment.
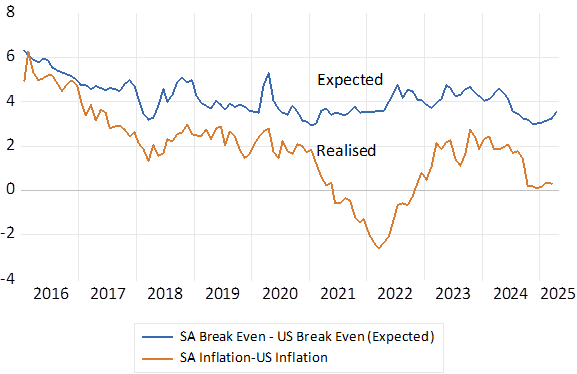
Yet not only is the rand expected to depreciate at a compounding rate of close to 5% a year over the next five years and more, the rand, is also expected to weaken by more than the difference in inflation in SA and the US. As it has done in the past. The ZAR has weakened over the years at a significantly faster rate than past differences in inflation between SA and the US. It is expected to continue to do so at about 2% a year faster than the expected differences between SA and US inflation.
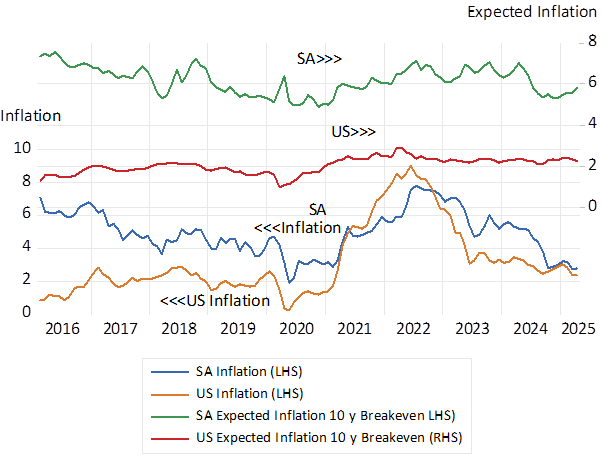
We show the differences between actual inflation in the US and SA and the differences between expected inflation in the two economies. Expected inflation in SA over the next ten years is expected to average 6% p.a. Expected inflation over the same ten years is expected to average about 2.2% p.a. A difference of close to 4%. Yet a dollar delivered in ten years’ time would cost over 6% a year more p.a. (see below) Put differently the ZAR/USD exchange rate has not conformed to Purchasing Power Parity, it is expected to deviate still further away from PPP in the future. Inflation expected in the Bond market is calculated objectively as the difference in yields between a vanilla bond and an inflation protected bond of the same duration, the so-called breakeven rates.
SA and the USA Actual inflation and Expected Inflation 2016-2025
Source; Bloomberg, SA Reserve Bank and Investec Wealth & Investment.
SA and USA Differences in Inflation and Inflation expected
Source; Bloomberg, SA Reserve Bank and Investec Wealth & Investment.
There is much to be done to raise the growth in SA output and incomes. There is as much to be done to convince investors in and outside SA that faster growth and less inflation and less exchange rate weakness over the long run is to be expected. Setting a lower target for inflation will not be sufficient to the purpose. A stable ZAR will be essential. Changing the long-term growth trajectory would be very helpful to the purpose of faster growth with less inflation to accompany a stronger ZAR. And as important for immediate improvement in the growth and inflation outcomes would be less inflation and exchange rate weakness expected.
It would also be helpful that should the economy suffer from another shock to the ZAR for global or SA specific reasons, the Reserve Bank could refrain from raising interest rates. To let the price shock work its way through without incurring further damage to the growth prospects of the economy and the demand side of the economy, when already under pressure of higher prices, with higher interest rates. Judged by past performance the danger to the economy will be policy determined interest rates that are too high rather than too low for the good of the economy. It is to an improved supply side of the economy we should look for permanently low inflation. The danger of demand led inflation, given the prevailing Reserve Bank culture, is a small one.
Inflation in SA has declined sharply from a 5% plus rate in early 2024 to 2.8% p.a. in April 2025 – for the usual supply and demand reasons. The demand for goods and services has been growing very slowly, and the supply side of the economy, given rand stability, recently even absolute ZAR strength, has brought moderate increases in the CPI.
Bank lending to the private sector has been growing very slowly. Adjusted for prices, bank credit was still below pre-Covid levels and the real money supply after a spurt during Covid had grown by only 4.2% between 2021 and the first quarter of 2025. Recent growth rates in money and credit have trended lower. A financial state that can be described as severely repressive. Given the weakness of demand for goods and services it is unsurprising that real incomes and output (GDP) were but 3% higher in q1 2025 than they were in early 2019. When real demand grows as very slowly as it has in South Africa, real output could not have advanced at any faster rate than it has, meaning an expensive waste of a somewhat better growth opportunity.
Real Money Supply (M3) and in Bank Credit supplied to private sector. (2019=100) Monthly data to 2025 q1.
Growth in Money Supply and Bank Credit (January 2023-2025 April) Monthly % p.a.
The lack of demand for and supply of credit and money is explained by short term interest rates set by the Reserve Bank. As inflation has come down the real cost of borrowing for overdrafts or mortgages has risen to very high, near record levels. Despite two 25 bp, highly delayed, reductions in the policy determined rate. The money market now predicts but a mere 25 bp further reduction in short rates over the next twelve months.
Without significantly lower interest rates to encourage the demand for bank credit and spending by households and firms, frustratingly poor GDP growth rates of less than 2% p.a. should be expected. And the prospect of too little rather than too much spending (relative to potential supplies of goods and services) is likely to continue to weigh heavily on the pricing power of domestic producers. The demand side of the economy is very unlikely to threaten higher prices for the foreseeable future without an unlikely change of mind set at the Reserve Bank.
Short term interest rates before and after inflation. 2016-April 2025. Monthly Data
Yet the unpredictable supply side of the SA economy, perhaps accompanied by a sharp reduction in the exchange value of the ZAR could always drive prices higher. And judged by past performance the Reserve Bank would then then drive interest rates higher to further depress demand that would come under pressure from higher prices. Imports and Exports account for a combined 60% of GDP. Their translation into rand prices depends on the exchange rate. That recently has been strong against the USD, the Aussie dollar and the EM basket. The Import Price Index (with a large oil component) was falling in 2024.
Price Indexes; SA CPI and Import Price Deflator (2019=100) and annual % changes in the Indexes. Quarterly Data
Slow growth aided and abetted by aggressive monetary policy while disinflationary, threatens growth and fiscal sustainability. It discourages domestic capex and capital inflows to fund them that might have improved longer term growth prospects. Slower growth expected frightens capital away and tends to weaken the rand- and raise inflation rates. Doubts that the GNU would survive the arguments over the 2025-26 Budget proposals led to some rand weakness. The agreements on the Budget reached finally in May 2025 have reinforced the GNU and added rand strength (see below) For the ZAR it is the supply side – the outlook for growth that matters most for the rand and in turn inflation.
Political developments and the ZAR in 2024-2025. Daily Data. Lower numbers indicate rand strength.
Long term interest rates, their levels and differences with US rates have still to register any marked change in sentiment about the outlook for SA growth or inflation. Forward exchange rates still expect the rand to weaken at about 5% p.a. over the next five years. (see below) And bond market yields- the difference between high vanilla bonds and elevated inflation protected RSA interest rates – indicate that inflation is still expected to average over 6% p.a. over the next ten years. Meaning expensive debt to add to fiscal strain.
Expected inflation and the cost of hedging the ZAR will not narrow, nor borrowing costs decline meaningfully, absent any significant improvement in the SA growth outlook. But nonetheless a welcome 3% p.a. inflation in SA could be sustained absent any exchange rate shocks initiated by politicians, local and foreign. Would setting a 3% inflation target mean more growth sensitive management of the demand side of the economy? Would it secure rand stability? Only possibly. It might however encourage the worst, anti-growth instincts of the Bank to prevail, especially when the supply side of the economy, the exchange rate, does not play ball.
The five-year RSA-USA carry and the realised annual move (% p.a) in the USD/ZAR (Daily Data 2016-2025 June)
SA and the USA; Actual inflation and Expected Inflation over the next 10 years (2016-2025)
Well maintained homes in my neighbourhood continue to be demolished at an impressive rate. Demolition in is being ordered so that the land released can be converted to a new residential unit or two or more. A process also well under way widely in the Western Cape. But conspicuous by its absence in much of the rest of SA.
If the demolition is to make economic sense the to be realised market value of the new units constructed must be expected to exceed the purchase price of the old building, the significant costs of constructing the new units, the demolition costs and the interest income sacrificed on the working capital tied up in the project would have to be covered as would the price paid for the established building demolished or expensively redeveloped. The purchase price paid will be approximately equal to the present value of the future rentals being sacrificed on demolition.
Any extant building survives because a potential re-development of it does not meet this profit test. Most buildings (slowly) survive the test of time. Look around you. It takes rising rentals, or rental income effectively sacrificed by owner occupiers, to encourage re-development. Escalating rentals add value to homes or commercial buildings and encourage owners to sell up and move on. And add value, that is additional wealth and spending power for their owners. It takes a growing economy to change the face of the nation.
Sadly, for the average home or building owner in South Africa, or those owning commercial property, the rental tide has been receding, outside of the Cape. The legitimate dreams, based on past performance, of millions of homeowners and landlords of buildings generating hoped for wealth for them, has been frustrated. They should blame the national government for the economic policies that have failed. And moreover, blame local governments who, egregiously, have raised taxes on their homes to deliver far inferior services in exchange. Terrible wealth destroyers they have proved to be.
Between 2010 and 2024, annual returns calculated from owning the average home, including rental income, assumed to have increased at the rate of inflation, and reinvested or used to pay down mortgage debt, was on average 4.2% p.a. Annual average returns from the listed REITS have been an average 5.6% p.a. while the JSE delivered much more, 11.7% p.a. on average, also including dividends reinvested. Even the low-risk money market returned more than homes or listed real estate. Some 6.2% p.a. on average. Inflation averaged 5.1% over the fifteen years. A million rand invested fifteen years ago in the stock market would be worth R5.3m today, the average million rand home then would fetch but R1.84m and an average R1m portfolio of commercial and industrial property would by now have compounded to about R2.5m. That is by about the same increases in the prices of the average basket of consumer goods, up by about 200% in the fifteen years.
Investment Returns; Shares, Real Estate. Cash (Income reinvested) and the CPI. 2010-2024 (2010=100)
Source; OECD, Reserve Bank of South Africa and Investec Wealth and Investment
Consistently, the average increase in mortgage advances since 2010 has averaged but 4.3% p.a. close to the average increase in house prices. Recently this growth rate has fallen further to about 2% p.a. The housing market has not been particularly good for banks- or might one say the banks, especially the Reserve Bank, has not been very good for the housing market, given very expensive mortgage loans.
Annual growth in house prices and mortgage advances (2010-2024)
Source; OECD, Reserve Bank of South Africa and Investec Wealth and Investment
If, a big IF, you could have rented your dream home fifteen years ago you would have done better renting than owning. Especially if you had saved the difference between the cash rent paid and the mortgage interest rate – say a 5% p.a average yield gap – into the share market.
The total internal investment return on a property is the sum of the initial year one rental yield plus the rate at which the rents are expected to escalate over say the next 15 years. For much of the past 15 years the expectations of rental escalations and consequent capital gains must have been disappointed (outside the Cape) Thus renters rather than owners would have been favoured by the persistent gap between lower rental yields and higher mortgage rates.
What comes next for renters or owners of real estate will depend on the state of the economy and the competence of municipal authorities. If property prices and rentals continue to rise at their recent pedestrian price, rental yields will rise to compete with punishingly high borrowing costs. Initial rental yields, (Rents/Value) will rise as the expected capital gains owning property fall away. Though rentals themselves may not rise much, given a depressed lack of demand for the space available. As has clearly happened with commercial property and the REITS. Much of the return from their shares is coming in the form of dividends paid.
Real Estate Investment Trusts on the JSE. Index values and Dividend (net rental) Yields (2010-2024)
Source; OECD, Reserve Bank of South Africa and Investec Wealth and Investment
A revival of the economy and the property market with it could change the trajectory of real estate values, and help create income and wealth for many homeowners. And revive the construction sector in the old-fashioned way. By turning the old into the new to revitalise our cities and suburbs. It can happen with a clear vote for better governance, better policies and their execution. Surely very much possible – as the Cape proves.
You are only wealthy if you have saved a good proportion of your income over the years and not consumed it all, to sustain an extravagant lifestyle. It is however your wealth that makes your large incomes and consumption tolerated by the wider society. Thus making it possible for the talented and diligent and hard-working and, most important for a growing economy, the enterprising and innovative successful risk takers, to earn their high incomes legitimately and enjoy their consumption and also help create their most useful wealth.
The savings that add to wealth and most important are invested productively by the income seeking business organisation that also saves and borrows and undertakes capex on behalf of their owners. These firms are given the responsibility to manage the capital stock and all the complementary scarce resources that are entrusted to them. Including employing workers and managers whose wages and rewards will depend on the good returns on capital (savings) their employers are able to realise to sustain their enterprise.
The more such capital is created and made available to the economy in the form of plant, equipment, dams, roads and ports etc and the more efficiently they are managed, the higher will be the incomes earned by the poorer households. More capital raises the relative scarcity of labour and improves productivity and incomes. Which makes the people understandably willing to protect the wealth that funds real assets against damage or theft or violent expropriation by local or foreign invaders. The protection and respect for property, that is for capital or wealth, in turn encourages the potentially higher income earners to venture more, to earn more and to save and invest more in the capital stock. Thus serving the essential interests of the wider community.
The consumption of others is not helpful to you- it adds to the competition for scarce resources. Saving, accumulating wealth to fund an investment in real assets is very helpful for the many without much wealth. It is the large-scale waste of capital, extracted by taxes, as has been the case with our SOE’s, that should be condemned.
Such essential willingness to protect property is to be found in the Bible and the rabbinical commentaries on it. As I was pleased to discover at a recent joyous barmitzvah. The substance of the readings that day were the laws and regulations governing the protection of property and compensation for its damage, intentional or accidental. And about laws that also regulated the rights and obligations to an important asset class of those times, the slave. All food for my economist soul.
There was little more I could read that morning about the creation and purpose of wealth. I thought I would ask this question of the Torah and Rabbinical commentary, the Talmud using AI. Rab AI so to speak. Here is a summary of the responses received, with my reactions indicated between brackets.
“The Talmud places a strong emphasis on the importance of hard work and diligence. It acknowledges that while effort and work are important, ultimately, one’s success may also depend on divine blessing. (Unbelievers will call this luck) The Talmud establishes the principle that those who are wealthy have a responsibility to support the less fortunate. The act of giving is seen as a valuable pursuit, and generosity is highly praised. Wealth is viewed as a trust that comes with significant responsibilities – that one should use their wealth not just for personal pleasure but also for the betterment of society. This includes supporting community needs and contributing to public welfare. (My point about the social purpose of wealth being the creation and preservation of the productive capital stock for the benefit of the greater society, has not apparently been recognised)
The Talmud warns against excessive attachment to wealth. A person should not let the pursuit of wealth dominate their life to the detriment of their spiritual and ethical responsibilities, that through work and the creation of wealth, one can achieve personal and communal fulfilment.”
(Ancient wisdom that is clearly consistent with human aspiration and economic development that implicitly recognises inevitable differences in economic outcomes as socially helpful)
A large threat to the long-term growth prospects of the SA economy is the loss of essential skills to emigration. Such losses have been a continuous drain on the growth potential of our economy both pre and post our democracy. That Trump saw fit to take the back of white South Africans could be even more damaging to South Africa than he imposing higher tariffs or denying aid. What if the US decided that badly treated South Africans with skills and the right aspirations would be very welcome in the US? A drain of emigration could become a flood. A severe potential loss that could be avoided by seeking the friendship and support of the US rather than so gratuitously incurring its ire and enmity.
How could this be done to the great benefit of South Africa and its growth prospects? I would suggest by doing in SA what Trump aspires for the US. That is for SA to become a truly colour blind and meritocratic society and economy. Which it is not. Our policies have focused on restitution for a black South Africans rather than stimulating growth. Understandable perhaps but self-defeating- making growth that would benefit the many so hard to realise.
Growth rates would surely be greatly enhanced by unfettered competition for jobs and for contracts to supply the State and its agencies. A process that would be particularly helpful to the least advantaged poor of South Africa. In the form of many more well-paid jobs and indirectly in the form of better education and health care that only a prosperous and competitive economy could afford. BEE clearly does not benefit them. There must come a time when the highly educated and talented black elite of South Africa are willing to compete on their own considerable merits with all the competition for the commanding heights of the economy and its governance. The sooner the better for growth and our international standing.
Faster growth may not reduce inequality and moreover, should not be expected to do so. To them that have may well be given. And be resented accordingly when it has a racial or ethnic connotation. But envy should not be allowed to frustrate the realisation of the greater good as it has to date. Higher incomes earned fairly by providing superior service to customers and employers should be applauded not resented. Growth is a positive sum game.
How badly has the South African economy been doing? According to the recent extensive Survey of Income and Expenditure and Income (PO100) of 19,940 SA Households conducted by Stats SA so much worse than could ever have been imagined. It has come up with a literally unbelievable estimates of household income and expenditure and their distribution by race. These estimates of household expenditure and income are also widely different from the national income estimates. And should be rejected.
Between 2006 and 2023, inflation adjusted household consumption expenditure of all SA households is estimated to have declined absolutely by a real 1.9%. Real Black household expenditure, with a 62% share of all spending, is estimated to have risen by an impressive 36.2% over these years. While the household spending of increasingly poor white SA households is estimated to have declined by 21%. Households headed by those with a tertiary qualification did even worse- they apparently saw their expenditures decline by 29.2% between 2006 and 2023. No case for envy here if it were so.
The income story told is less depressing. Black headed households are estimated to have seen their incomes rise by 46% between 2006 and 2023. While white incomes declined by only 7.7%. All household incomes are estimated to have grown by 5% since 2006. Suggesting a completely implausible and unobserved increase in real household savings – the difference between incomes and expenditure.
By contrast the National Income Statistics record that real household disposable income rose by 42% between 2006 and 2023, while real household consumption expenditure increased in line by 37% over the period (see below) Such inexplicable differences in the measures of income and expenditure need reconciliation. And what does it all imply for the reconstruction of the weights in the CPI that depend on the Survey? And for our measures of inflation?
We hear frequent complaints from state-owned enterprises (SOEs) that they are struggling to meet their debt obligations and need to be recapitalised. Yet the SOEs are simply not generating enough return on capital invested (ROIC) to justify allocating more capital to them.
Let’s take Transnet as an example. Transnet’s return on invested capital (ROIC) was 1.0% in 2024, which is lower than the miserable ROIC of 1.5% posted in 2023. The cost of debt on long-term South African government debt is 11%. This is the bare minimum cost of capital Transnet should meet. Transnet is destroying over 30 billion rand in economic profit every year when the difference between its return on capital and its opportunity cost is considered. A terrible unaffordable waste.
There are two key value drivers that feed into ROIC: operating margin and asset turns. To improve the operating margin, Transnet needs to increase revenue AND bring down operating expenses. To meet an 11% cost of capital, Transnet needs to generate 47 billion rand in annual operating profit on its invested capital. Its profit from operations was 4.3 billion in 2024 (operating profit is before interest expenses). Assets need to be run more efficiently or sold to private parties that can do so.
The large SA state owned enterprises, Eskom and Transnet, among other SOEs including the Post Office and the trading divisions of most municipalities have not remotely met the requirement for an investable credit rating. They have not been able to contain their costs well enough to cover their interest bills let alone their true opportunity cost of capital. Nor have they properly maintained their Plant and Equipment. Fundamentally they have failed because the bottom line, that is an adequate return on invested capital, has had little influence on their behaviour. Without many eye-watering billions of maintenance capex, their ability to continue to supply essential services, indispensable for economic growth, is severely compromised.
The SA government now recognises that the only practical way to secure the supply of these essential services is to raise large investments of private capital. Of which there is no shortage, provided the terms are regarded as acceptable.
And it would only be a private company, with a bottom line that requires a risk-adjusted return on capital, that could realistically hope to control costs and preserve and improve the capital stock, to reliably supply essential services in the future. Any imaginary mythically reformed SOE –capable of containing costs and operating efficiently – but without the right private incentives- is not a viable option. We’ve been down this track too many times.
The agreed terms for private sector engagement would have to recognise the true market value of the plant (PPE) taken over by the new operator of a network or part of it. Given years of neglect, existing assets might have very little value to any new operator. The potential market value could be exchanged for equity held by the government in the new privately controlled suppliers.
The private operator would have to commit the extra capital required to guarantee a flow of essential services over the long run. And such extra capex, would have to be recognised in the tariffs and or charges made for what could be valuable access to the networks.
Complicated calculations or regulations of appropriate charges or tariffs do not have to be a barrier to private entry. Any private company that won a tender to enter a network, with a degree of monopoly power, would be highly conscious of the impact of the prices it could charge on demand, sensitive to degrees of capacity utilisation and so its bottom line. And would be very considerate of its growth prospects. Becoming a reliable supplier at a competitive price with market-related returns would be a valuable outcome for all stakeholders.
The purpose of any private- public partnership or initiative is a simple one. That is to secure the future supply of essential services for SA users without which SA incomes and output must stagnate or decline. This all-important objective, viewed realistically, must be top of officials’ minds engaged in any negotiation with potential private partners.
The differences in the value of residential property in Cape Twon and Gauteng – and in Durban and the upper market suburbs of all the other SA cities are most striking. I learn anecdotally of a modern multi-bedroomed home in a gated estate near Johannesburg, largely grid free, that is municipality free, that has been on the market for six months for an asking price of not much more than three million rand with no takers. The owner wants to move to Cape Town as do so many and the market is flooded with like homes. Palaces that would take R10m or more to build. The same 3 million would have difficulty in securing a well appointed two-bed roomed apartment in Sea Point.
The differences in property outcomes are easily explained. In the Cape property owners in the towns and suburbs get reasonable value for the wealth taxes and service charges they are forced to pay. This adds to rather than subtracts from property values. Unlike the abject failures of service delivery almost everywhere else that destroys demand for homes and valuations.
The sad news is that the hopes of many have been dashed. Those who have responsibly been saving, paying off their mortgages each month expecting that the growing equity in their homes would help fund their retirements when they downsized and cashed in. The expectation now is that the value of their homes has not and will not keep up with inflation.
I am informed by a leading property appraiser that on average commercial real estate in Cape Town is expected to increase in capital value by 6.5% p.a. – ahead of inflation expected – while equivalent property in Johannesburg is expected to gain but 3% p.a. Furthermore, the so-called capitalisation rate at which future rental incomes are discounted is lower for Cape Town property that a similar building in Johannesburg. A value adding 1.25% margin in favour of Cape Town discount rates is estimated.
Recent property transactions confirm this difference. The Table Bay Retail Mall was sold for an initial yield of 7.75% to Hyprop. The Mall of the South in Johannesburg was sold to RMB at a significantly higher initial rental yield of 9.5%. For landlords of residential property in Cape Town initial rental yields (net rents/Market Value) range from about 3% in the most favoured suburbs to about 5-6 percent where there is less competition. All consistent with expensive real estate.
It should be assumed that the total return expected by investors in real estate will be similar everywhere in SA. Flows of mobile capital make it so. But total returns come in two parts- an initial yield – in dividends or net rental income and in capital growth. Thus the more growth expected in net income the lower will be the initial yield for homes of similar quality. For cash strapped migrants relocating to the Cape it may seem easier to rent rather than buy- with expected capital growth conceded to the investor.
The good news for our cousins in the North is that their cost of living is dramatically lower than ours in Cape Town. The bigger and better the home the more consumption power it delivers and such delivery comes much less expensively in Joburg.
The opportunity to live in an inexpensive palace rather than a crowded bed-sitter for the same modest outlay, either in rentals paid or sacrificed by owner- occupiers, should surely be an attraction not to migrate. And enough of a saving to help owner-occupiers go off grid and behind gates. And to run a four by four to negotiate the potholes when off to their bushveld retreats.
My New Year advice therefore is to buy more of what is cheap. To house up and take advantage of the bargain basement offers. And hope that all the bad news about service delivery is in the already low prices. The best performing asset class in SA in 2024 has been listed property. Residential property might just enjoy a similar rebound should service delivery unexpectedly improve rather than deteriorate further. (see below)
Total Return To end Dec 2024. Property Vs The All Share Index
Source; Bloomberg and Investec Wealth & Investment
Inflation in SA has nearly halved since June. From 5.1% p.a then to 2.8 in October. Indeed average consumer prices have hardly risen at all since June. In October they fell marginally, and over the past three months the CPI has hardly budged, and price increases were close to zero.
Inflation and the SA CPI; Monthly Data
One observation that one can make is that such price stability could not have occurred without a very strong rand. A rand that has gained value against a range of low inflation currencies. This year to date the rand is worth four per cent more USD, can buy six per cent more Euros and seven per cent more Aussie dollars. The year before the rand had weakened VS these currencies by over 10%. Its surely no surprise that inflation in SA accelerated in 2023 and has sharply decelerated this year.
The ZAR Vs the USD, the Euro and the Aussie Dollar. Daily Data (2024=100)
One can also conclude that the exchange value of the ZAR drives the direction of prices in SA – rather than the other way round. SA is a very open economy. Flows of exports and imports account each for about 30% of GDP- of total supply and demand in the economy. What we pay in rands for imports and receive for exports helps determine all prices in a systematic way. You can tell as much at the petrol pump.
And so how then can SA achieve currency strength and low inflation? The answer would also seem obvious enough. Form a government of national unity that is expected to raise growth rates, improve the outlook for SA bonds and equities and so more capital will flow in more than out leads to less rand weakness and inflation expected in the future. Lower long term bond yields, lower costs of capital generally, all reinforce the growth momentum. And with lower inflation short term interest rates decline just as predictably, as they can be expected to rise with rand weakness. Yet expectations of faster growth have to be reinforced with consistent growth enhancing actions. Investors can be encouraged, they can as easily be disappointed.
It is not only in South Africa that politics and the economic policies and outcomes associated with a change in leadership drive the direction of the exchange rate. And depending on the degrees of openness to foreign trade that will then drive the direction of all prices. The exchange rate leads and prices follow, and the exchange moves in response to changes in expectations of returns in the capital market. The exchange value of the USD, the essential reserve currency, is subject to large changes in direction, persistently so, that have little to do with differences in inflation between the US and its principle trading partners. And everything to do with expected returns on capital invested. But will have a significant impact on the profits and growth prospects of businesses that engage in foreign trade.
The DXY is a weighted Index of the exchange value of the USD Vs the major currencies, the Euro, Yen etc.. It gained nearly 50% additional exchange value between 1995 and 2000. It then declined from an Index value of 120 to 70 by the time of the Global Financial Crisis. The dollar since has been on a mostly upward tack since and clearly has received a boost from the Trump ascendancy. From which the ZAR has not be immune but has behaved broadly in line with all other currencies. Dollar strength will be far more easily managed provided the ZAR holds its own with the other low inflation currencies, as it has been doing.
But for the Trump administration the impact of the potentially stronger dollar on trade flows may be far more important than the impact of higher tariffs on imports and the retaliation that may follow and on prices US consumers will pay. The unpredictability of exchange rates, despite low rates of inflation in the developed world, especially of the exchange value of the USD, is a fundamental flaw of global trade and finance that all economies including SA have to cope with.
Looking back at the economy reminds how tough it has been in recent years for households and businesses dependent on the state of the SA economy. Since those pre-Covid days the economy has hardly grown at all. Compared to Q1 2019 GDP by June 2024 had gained a mere 5% over the five and a half years. (growth of less than 1% p.a) Households are spending but 6% more than they did then and capital formation is down by about 14% in real terms. How could such a deterioration be allowed to take place?
Vital SA Economic Statistics. Supply and Demand. (2019=100) Quarterly Data.
Source; SA Reserve Bank and Investec Wealth and Investment.
Clearly the supply side of the economy performed poorly – led by the well documented, confidence sapping failures of the State-owned enterprises and of government generally, including those of the provinces and municipalities. But demand management by the Reserve Bank can also be held responsible for at least some of the weakness. Much of the period since 2021 has been accompanied by much higher interest rates both absolutely and relatively to inflation. That is despite the grave weakness of demand for goods services and labour.
The Reserve Bank’s Monetary Policy Committee provides a full explanation on a regular basis for these interest rate settings. It has been fighting inflation and only inflation that rose after 2021 as the rand weakened so significantly after 2021. The idea of a dual mandate of the US Fed kind – low inflation and employment growth being the combined objective of monetary policy – has been anathema to our determined inflation fighters.
Shocks to the price level caused by exchange rate weakness – unrelated to immediate monetary policy settings and inflation trends – are clearly not ignored when interest rates are set. Yet such shocks- decidedly not of the Reserve Bank’s doing- lead inevitably to more inflation – then higher interest rates – and in turn still weaker demand – already under pressure from higher prices. Higher prices have their complex causes- but they also have (rationing effects) on the willingness to spend more- given minimal growth in income
The problem for SA and the Reserve Bank was that the ZAR weakened decidedly after 2021- and weakened against not only the US dollar but also vs other EM and commodity currencies. It was SA specific in nature clearly linked to the failures of government and the failure of the economy to grow that added to SA specific risks. The USD/ZAR, as had the average EM/ZAR and AUD/ZAR had recovered well from the Covid linked risk aversion that brought pressure on the ZAR and the market in SA Bonds. SA appears particularly vulnerable to Global Risk aversion. It may be recalled that the USD/ZAR had recovered to as little as R14 in early 2021. But then the sense of South African failures to realise economic growth took over the currency and Bond markets . And the weaker rand inevitably forced prices higher at a faster rate. Given the MO of the Reserve Bank.
The ZAR Vs the USD, the EM Basket and the Aussie Dollar. Daily Data 2019-2024 (2019=100)
Source; Stats SA, Bloomberg and Investec Wealth and Investment.
Interest rates and the USD/ZAR 2019-2024. Monthly Data to September 2024
Source; Stats SA, Bloomberg and Investec Wealth and Investment.
The ZAR and Short-term Interest Rates. Daily Data (2019-2024)
Source; Stats SA, Bloomberg and Investec Wealth and Investment.
The connection between the foreign and domestic exchange value of the ZAR and the outlook for the SA economy has never been clearer. The GNU has raised the prospects for growth and the ZAR and the bond and equity markets have responded accordingly. Inflation is therefore on the way down. Over the past three months it has averaged but 2.4% p.a. Interest rates at the short end of the market have come down and will come down further provided the ZAR holds up. Not so much vs the US dollar, that may be getting a Trump boost, but also against the other currencies similarly affected by the USD. We should not expect the Reserve Bank to change its pro-cyclical approach. We should but insist and hope that the supply side weaknesses of the SA economy are well addressed. Raising the GDP growth rates to a modest 3% p.a. will not only promote economic and political stability, it will bring lower interest rates and less inflation.