JSE listed retailers: Identifying impressive outperformance

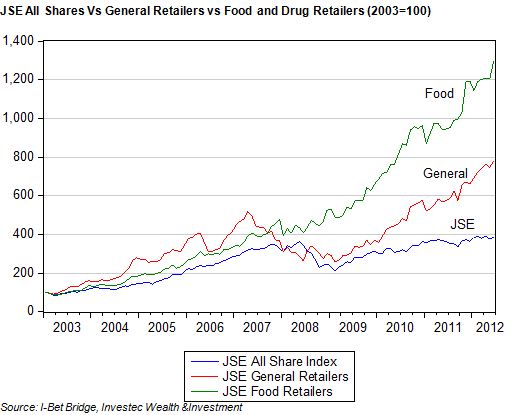
JSE listed retailers listed in the General Retailer or Food and Drug Retailer sub-indexes continue to enjoy great approval from investors. They have outperformed the All Share Index since 2003 by very large margins with the Food and Drug Retailers performing especially well with this Index rising by an extraordinary 1200% over the period 1 January 2003 to 22 June 2012 compared to a still very satisfactory 400% improvement for the All Share Index.

The General Retail Index did twice as well as the All Share. Over the period January 2003- June 2012 the JSE ALSI provided an average return, including dividends, calculated monthly of 15.2% p.a., compared to 25.3% from the General Retailers and 28.7% realised by the Food and Drug Retail Index.

The sector has re-rated: prices have risen further than earnings

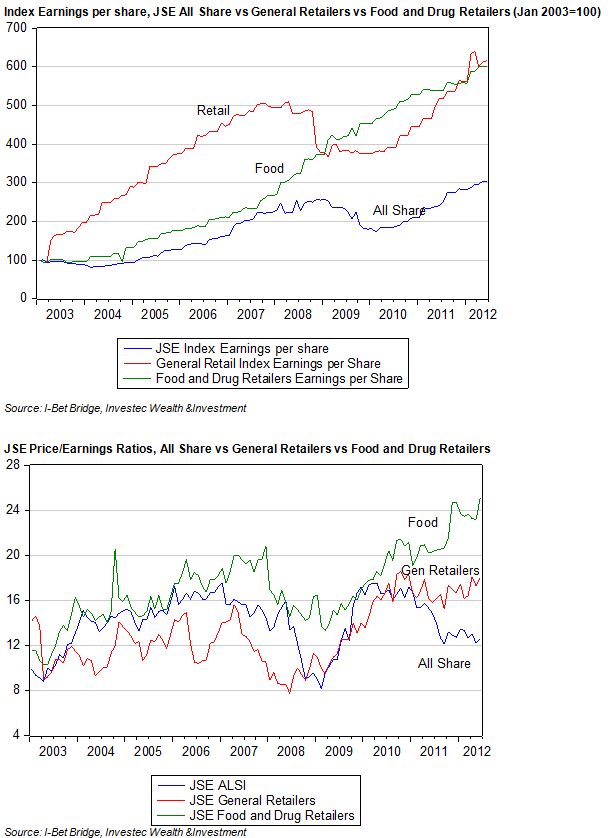
The outperformance by retailers was almost as impressive on the earnings front. Retail Index earnings per share have grown twice as fast as All Share Earnings, growing six times compared to the three fold increase recorded by the market as a whole (including the contribution made by retailers. The General Retailers, having seen earnings decline in the recession of 2009, have now caught up with Food and Drug Index earnings per share. Impressively the Food and Drug Retailers were able to sustain impressive growth in their earnings despite the recession.

Over the past twelve months to 22 June the General and Food Retailers, co-incidentally, both provided their shareholders with as much as a 34% return. Clearly investors continue to be surprised by the sustained excellent economic performance of the retailers. Returns of this order of magnitude are far in excess of the risk adjusted returns required to satisfy investors and therefore must represent further unexpectedly good performance over the past twelve months. But having been surprised, investors have come to expect more from their retailers, as revealed by more demanding valuations.

The Food retailers are trading at over 25 times trailing earnings and the General Retailers 18 times compared with the market as a whole that is priced at a much less demanding 12.5 times reported earnings.

Identifying the performance drivers

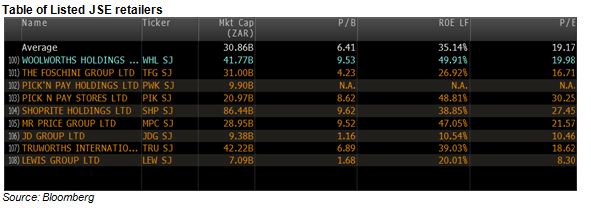
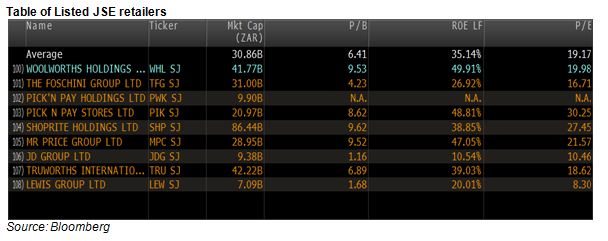
As we indicated in our previous report on retailers on the JSE, these companies, in growing their earnings, have realised extraordinarily good (internal) returns on shareholders capital they have invested in recent years. The accounting returns on equity capital for the latest reporting period have ranged from 20% to 49% as indicated in the table below.

Given these exceptionally good returns on capital and given what have become demanding market valuations, we thought it helpful to compare the listed retailers using three metrics. In our previous report we compared Shoprite to Pick n Pay and Woolworths. In this report we extend the comparison to Truworths (TRU), The Foschini Group (TFG) and Mr Price (MPC).

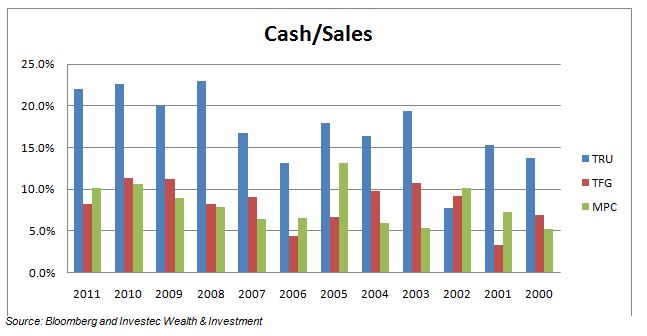
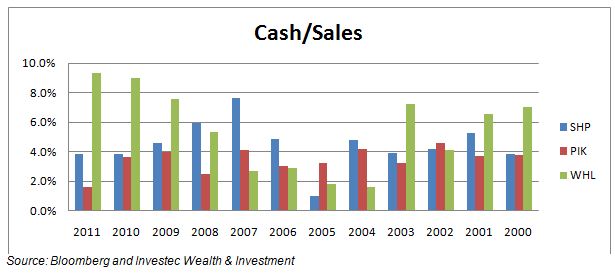
Firstly we compare the ability of the different retailers to realise cash from sales revenue. In the figure below we compare cash to sales ratios of three retailers. All three have proven ability to turn sales into cash on the balance sheet but TRU is a clear leader in this regard as may be seen.

But realising cash is not all that will determine the value of the company. It is what is done with the cash that will matter to shareholders. Investing the cash will add more value than paying it out in dividends or share buy backs, provided the returns on capital exceed their opportunity costs. Clearly the retailers meet this proviso by large margins.

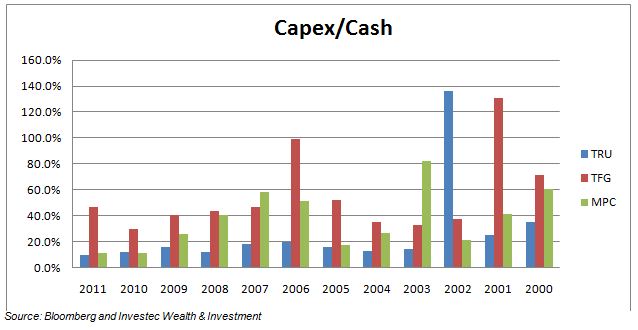
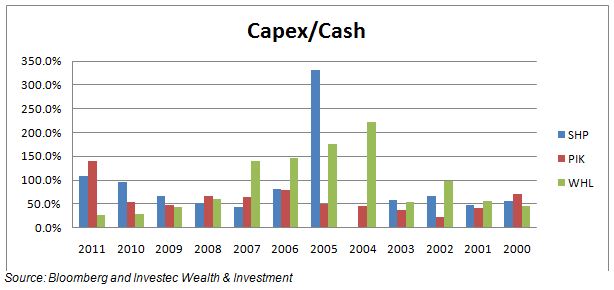
We show the ratio of capex to cash flows below. By this criterion TRU ranks behind MPC and more so TFG. TFG appears as the most willing to turn cash into fixed and perhaps also working assets. But all three retailers typically invest only at best to half the cash they generate.

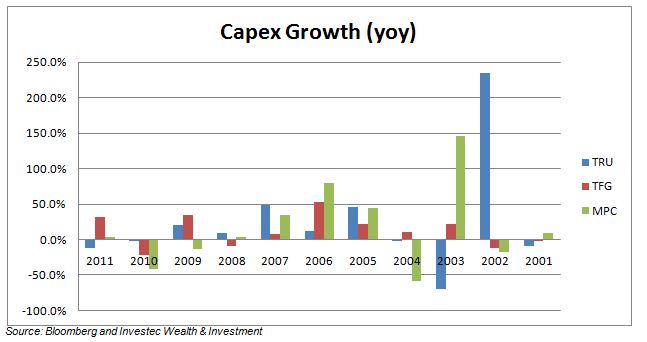
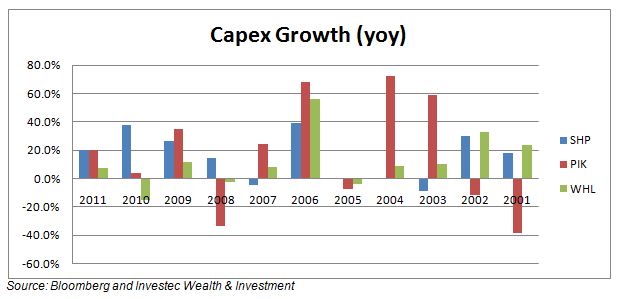
This reluctance, or rather perhaps the inability, to find value adding investment opportunities is demonstrated by rather tepid and variable growth in capital expenditure itself as we show below. As may be seen the rate of capital expenditure appears to have slowed down in recent years.

Conclusion

It seems fair to conclude that these listed retailers have done done much better at the operating level than they have at identifying and implementing growth enhancing investment activity. If they are to surprise the market in the future as they have done in the past, they would need to do both. Brian Kantor
Retailers: What shareholders should expect

What should investors wish of the companies they own a share of? Ideally their management is able to generate an (internal) rate of return on the shareholders capital they invest that is in excess of the opportunity cost of that capital. The larger the excess returns, the more capital the company would be encouraged to invest and the more the share market will approve of such growth over time.

This capital could be raised from operations, from issuing additional shares or by borrowing. As the company expands by undertaking value adding capital expenditure, it can be expected that the gap between the internal rate of return and the cost of capital would narrow. The potential value to be added for shareholders is a multiple of the amount invested and the spread between the internal rate of return from capital invested in working and fixed capital and the opportunity cost of that capital. The objective of the company should be to maximise the value add, not the spread between internal and required rates of return. We would suggest that the required rates of return would be about 4%-5% above the rate of interest on an RSA long dated bond. This is a lower risk premium for food retailers and higher for credit providing retailers.

SA retailers have proved highly capable of generating very high internal rates of return from their businesses. Returns realised on equity capital by listed retailers and their market-to-book values are impressively high. The share market has also registered its approval by raising the price to earnings (PE) multiples of listed retailers. The following table taken from Bloomberg indicates the range of outcomes for listed JSE retailers. Market price-to-book values range from over 9 times for Woolworths, Shoprite and Mr Price to under two times for furniture retailers. Return on book equity ranges from nearly 50% to about 20% and the PE multiples range from eight to 22 times reported earnings.

Clearly not all retailers are equal. Given the excess returns potentially available to retailers, those best able to undertake additional value adding capital expenditure for shareholders should be prized above others. If they lack such opportunities, the best they can do for shareholders would be to return capital to them either via the dividend route or through share buy backs.

We have compared three leading retailers below. We compare and examine Shoprite (SHP) Pick and Pay (PIK) and Woolworths (WHL) on two dimensions: by cash flow over capital expenditure and sales; and by growth in capital expenditure. Ideally the more capex relative to cash flow the better it is for shareholders on the assumption that the returns will exceed the cost of capital. If cash flow exceeds capital expenditure then cash will have been used to pay back debt, pay dividends or buy back shares. These are signs that management lacks the confidence or the ability to realise value adding capital expenditure.

The cash to sales ratio indicates the ability of the respective retailers to generate cash from current operations and the growth in capital expenditure provides a leading indicator of future growth. At the operational level, SHP has generated significantly more cash per unit of sales than PIK over all years since 2000 except for 2005 and 2002, by a small margin. WHL has performed much better than SHP over recent years in terms of cash flow per unit of sales, though it lagged behind SHP between 2004 and 2007.

These three retailers seem generally unable or unwilling to undertake capex in excess of cash flow, with the notable exceptions of SHP in 2005 and WHL between 2004 and 2007, when capex exceeded 100% of cash flow. No doubt the improved operational performance of WHL in recent years has had something to do with the capex undertaken earlier. What may also be important is that PIK in 2011 increased its capex to more than 100% of cash flow – something that it conspicuously failed to do before.

The growth in capital expenditure shows an uneven pace: SHP and WHL score better than PIK in this growth league.

It will be clear that SHP has been doing much more of the good stuff for shareholders than PIK. WHL has also been competing strongly with its expansion plans. PIK has lagged behind and is, by all accounts from management and its board, playing catch up (as it needs to do if it is to compete effectively).

The recent capital raising exercise by SHP, when it raised about 10% of its market value with new debt and equity, puts it in a strong financial position to fund growth. The share market is pricing all these retailers for strong growth, as indicated by current valuations, market-to-book and PE ratios. They will have to run hard and continue to grow fast to satisfy demanding market expectations. Thus having to raise additional equity or debt capital, rather than relying on internally generated cash, should be seen a positive rather than negative by shareholders. We will compare in a similar way other listed retailers in subsequent reports. Brian Kantor

Markets: A good week for global equities, RSA bonds and SA risk

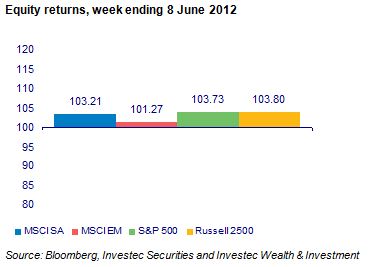
Last week was very kind to global equities. The S&P 500 was up nearly 4% as were US small caps represented by the Russell 2500. The SA component of the benchmark MSCI emerging market index was up over 3% and also did better than the average EM market last week.

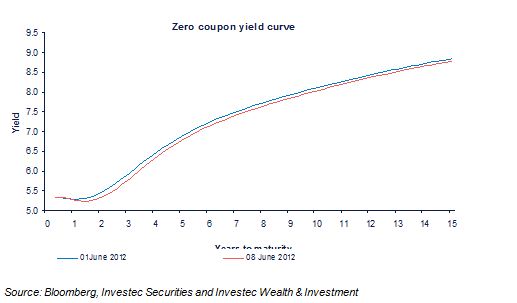
It was also a very good week for investors in RSA bonds, of both the rand and US dollar denominated variety. The spread between RSA Yields fell across the term structure of interest rates.

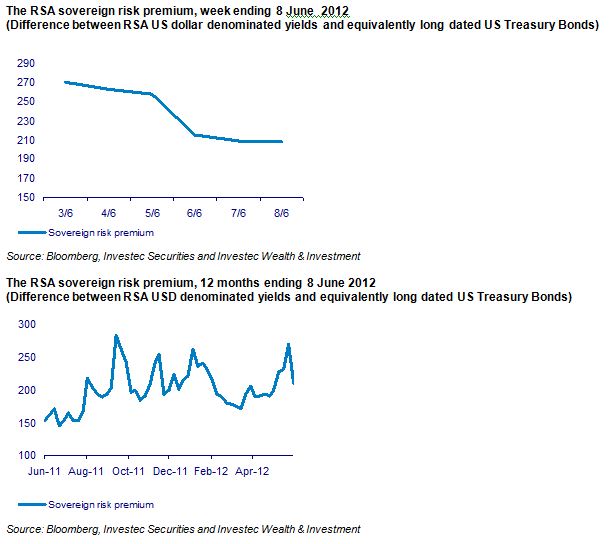
Yankee bonds and their US Treasury Bond counterparts declined by over 60bps in the week – strongly reversing wider spreads that had opened up recently with heightened global risk aversion.

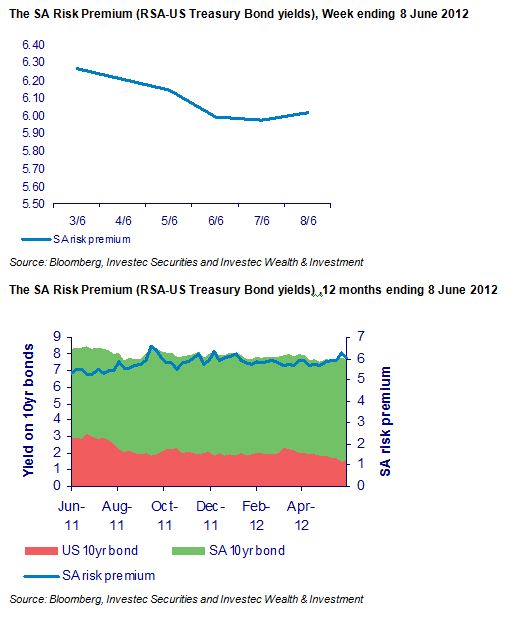
The good news in the RSA bond market meant that the spread between RSA 10 year bonds denominated in rands and US Treasury Bonds yielding US dollars, also narrowed by about 20bps. This spread may be regarded as the total SA risk spread offered to offshore investors with the difference in 10 year yields representing the rate at which the rand is expected to depreciate against the US dollar over the 10 years. Should the rand weaken as expected over the next 10 years, that is at an average rate of 6% p.a, it would make little difference to borrow or lend rands or US dollars. What is gained or lost on the exchange rate leg will be made up or given up on the interest rate spread.

Sometimes known as the interest parity condition, these interest rate differences will also reveal themselves in the premiums paid for US dollars to be delivered against rands in the future, that is the premium paid for forward cover. Last week insuring against expected rand weakness became a little cheaper. If risk tolerance should improve further, both the spot rand/US dollar rate should benefit and interest rates in SA decline relative to those in the US. Brian Kantor

The Hard Number Index (HNI): The foot comes off the accelerator

Our Hard Number Index (HNI) of the current state of the SA economy indicates that economic activity in SA continues to grow but its rate of acceleration (that is, the forward momentum or speed of the economy) appears to be slowing down and may slow down further if current trends persist. In other words, while the SA economy continues to move ahead it appears to be be doing so a slower speed.

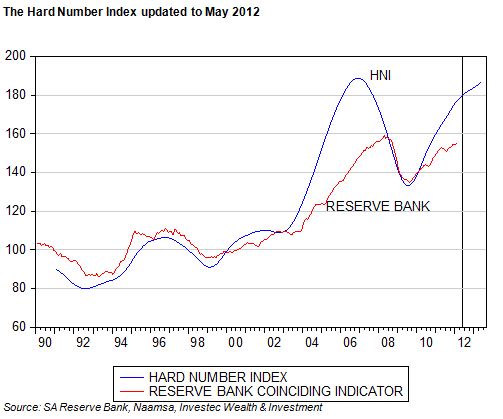
Our HNI is based on two equally weighted, very up to date hard numbers, namely: new vehicle sales released by the motor manufacturers (Naamsa) for May earlier this week and the real value of the notes in circulation at May month end. The notes in circulation figure was released yesterday in the updated Reserve Bank Balance Sheet.

This series we then convert into the Real Money Base by deflating it by the CPI (extrapolated one month ahead). The current level of the HNI and a time series forecast of it is shown below where it is also compared with the Reserve Bank’s business cycle indicator – only updated to February 2012.

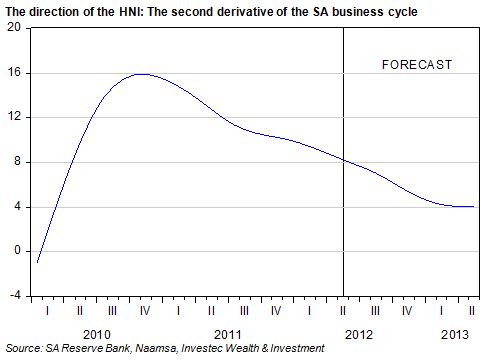
In the figure below we show the change in the forward speed of the economy by measuring the rate of annual change in the HNI. This may be regarded as the speedometer of the economy. The fastest forward speed registered recently by the HNI was in late 2010. The foot has come off the accelerator gradually since then, with a further slowdown in forward momentum predicted.

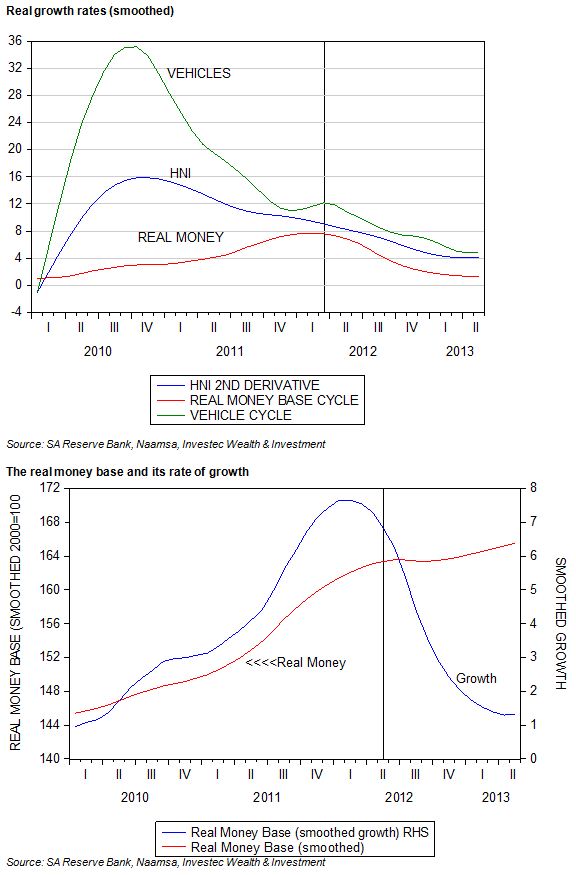
As we show below, it is the decline in the growth of the supply of and demand for notes by the public and banks (adjusted for the CPI) that is slowing the forward momentum of the HNI, more than the direction of the new vehicle growth cycle, which is also trending lower. Growth in new vehicle sales has peaked, but growth is holding up rather well. May 2012 was a better month for the motor dealers than April 2012, even when seasonal factors like number of trading days are taken into account.

However the underlying growth trends are clearly pointing down, as are broader measures of money supply and bank credit growth. This is the case even though the economy may be regarded as growing slower than its potential growth. The Reserve Bank has suggested this will occur in late 2013. The money market has come to predict that the economy may take much longer to realise its potential growth. Decreases, not increases in short term interest rates are now being predicted to help the economy along. Our direction of our HNI supports such a view. Brian Kantor


An explanation of the numbers

The HNI and the Reserve Bank Indicator may be regarded as a proxy for the underlying state of the economy. When the indicator registers above a real base value of 100, the economy is producing more goods and services, it is growing, and when below 100 the economy is shrinking. Growth will then have turned negative. As may be seen from the HNI and the Reserve Bank Coinciding Business Cycle Indicator, that hovered around 100 between 1990 and 2002, economic activity did not appear to have expanded at all in SA over these years. Since then the index numbers have remained well above 100.

In 2006 -07 the HNI Index turned lower but still remained well above 100. This indicates that while economic activity was still expanding in 2008-09 it was doing so at a slower rate and that the upper point in the Business Cycle, the period of maximum growth or forward economic speed had passed. The HNI Index turned down before the Reserve Bank Indicator and then picked up forward momentum in late 2009 at exactly the same time as the Reserve Bank Index. This indicated that faster rather than slower growth was under way: the HNI more timeously and usefully than the Coinciding Indicator.

GDP provides another much more comprehensive estimate of the level of economic output and its rate of growth. But based, as it must be, on a large number of sample surveys of activity across the economy, and not on hard numbers, these GDP estimates lag well behind economic events. This is true even of the initial estimates of GDP that capture the headlines but that will be subject to significant revisions. We are already in June and national income estimates for the first quarter of 2012 still are only partly released. These lagging indicators of economic outcomes call for more up to date estimates – hence our HNI. But one does wonder about the usefulness of the Reserve Bank’s Coinciding Business Cycle Indicator, or even its leading economic indicator, that even lags behind the lagging GDP estimates themselves.

Vehicle sales: Post Marikana resilience

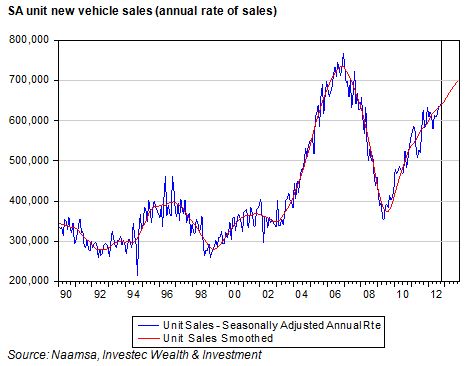
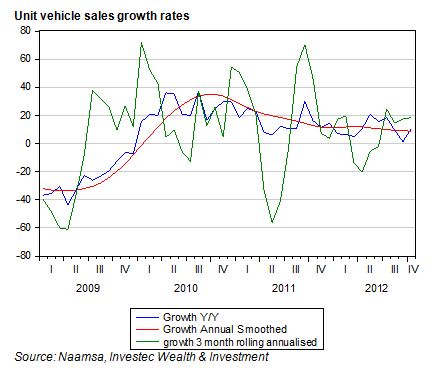
October proved to be another very good month for vehicle sales in SA. On a seasonally adjusted basis, an extra 675 new vehicles units were sold in October than in September. On an annual basis sales are now running at 644 505 units and if present trends are sustained, sales could be about 700 000 units by October 2013. This would leave the industry only slightly behind peak sales of late 2007.

The headline growth in sales – unit sales compared to the same month a year ago – perked up to a 10.5% rate from a sedate 1.4% growth in September 2012. This growth rate will receive most attention but the much more meaningful indicator of sales to come is the more recent growth trends. As may be seen in the chart below, the growth in seasonally adjusted unit sales compared to three months ago was at an 18.5% rate. As the chart shows, this three month growth rate picked up sharply in July 2012 and has been sustained at a very robust rate since then. The annual smoothed rate of growth appears to be trending towards a 9% rate.

Vehicle sales are the first indication of the state of the SA economy post Marikana. That unit sales could have sustained their forward momentum in the face of such a potential shock to confidence should be regarded as highly encouraging. The buyers of vehicles and the banks that finance such sales do not seem to have been much put off by the problems of the mining industry. Such resilience is surely welcome. Brian Kantor