Our Hard Number Index (HNI) of the current state of the SA economy indicates that economic activity in SA continues to grow but its rate of acceleration (that is, the forward momentum or speed of the economy) appears to be slowing down and may slow down further if current trends persist. In other words, while the SA economy continues to move ahead it appears to be be doing so a slower speed.
Our HNI is based on two equally weighted, very up to date hard numbers, namely: new vehicle sales released by the motor manufacturers (Naamsa) for May earlier this week and the real value of the notes in circulation at May month end. The notes in circulation figure was released yesterday in the updated Reserve Bank Balance Sheet.
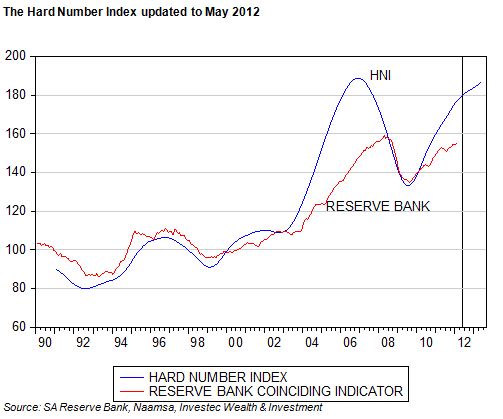
This series we then convert into the Real Money Base by deflating it by the CPI (extrapolated one month ahead). The current level of the HNI and a time series forecast of it is shown below where it is also compared with the Reserve Bank’s business cycle indicator – only updated to February 2012.
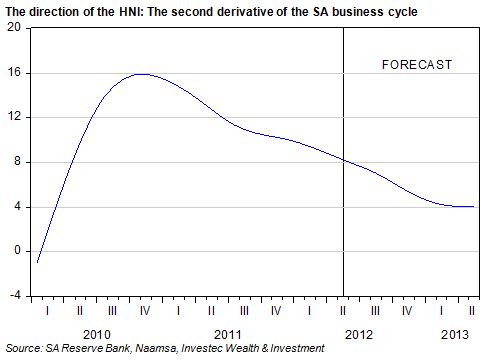
In the figure below we show the change in the forward speed of the economy by measuring the rate of annual change in the HNI. This may be regarded as the speedometer of the economy. The fastest forward speed registered recently by the HNI was in late 2010. The foot has come off the accelerator gradually since then, with a further slowdown in forward momentum predicted.
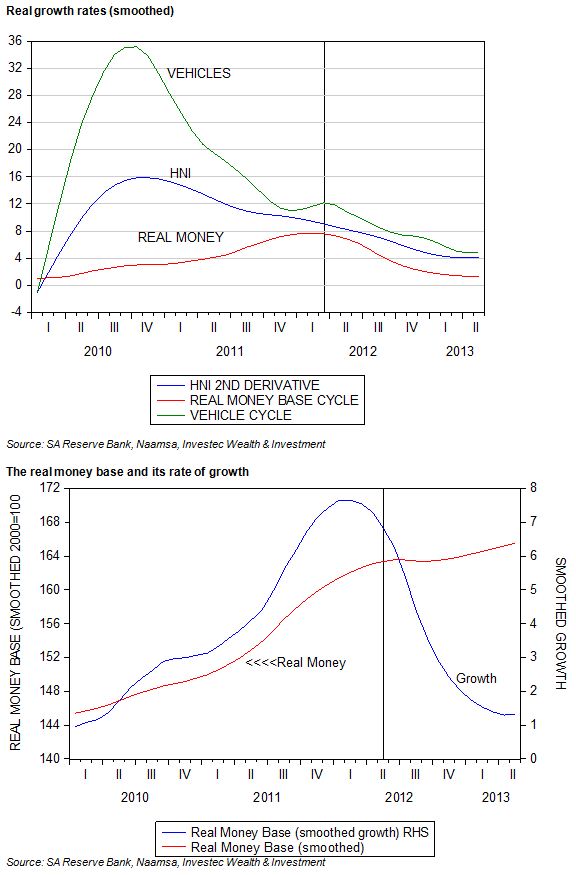
As we show below, it is the decline in the growth of the supply of and demand for notes by the public and banks (adjusted for the CPI) that is slowing the forward momentum of the HNI, more than the direction of the new vehicle growth cycle, which is also trending lower. Growth in new vehicle sales has peaked, but growth is holding up rather well. May 2012 was a better month for the motor dealers than April 2012, even when seasonal factors like number of trading days are taken into account.
However the underlying growth trends are clearly pointing down, as are broader measures of money supply and bank credit growth. This is the case even though the economy may be regarded as growing slower than its potential growth. The Reserve Bank has suggested this will occur in late 2013. The money market has come to predict that the economy may take much longer to realise its potential growth. Decreases, not increases in short term interest rates are now being predicted to help the economy along. Our direction of our HNI supports such a view. Brian Kantor
An explanation of the numbers
The HNI and the Reserve Bank Indicator may be regarded as a proxy for the underlying state of the economy. When the indicator registers above a real base value of 100, the economy is producing more goods and services, it is growing, and when below 100 the economy is shrinking. Growth will then have turned negative. As may be seen from the HNI and the Reserve Bank Coinciding Business Cycle Indicator, that hovered around 100 between 1990 and 2002, economic activity did not appear to have expanded at all in SA over these years. Since then the index numbers have remained well above 100.
In 2006 -07 the HNI Index turned lower but still remained well above 100. This indicates that while economic activity was still expanding in 2008-09 it was doing so at a slower rate and that the upper point in the Business Cycle, the period of maximum growth or forward economic speed had passed. The HNI Index turned down before the Reserve Bank Indicator and then picked up forward momentum in late 2009 at exactly the same time as the Reserve Bank Index. This indicated that faster rather than slower growth was under way: the HNI more timeously and usefully than the Coinciding Indicator.
GDP provides another much more comprehensive estimate of the level of economic output and its rate of growth. But based, as it must be, on a large number of sample surveys of activity across the economy, and not on hard numbers, these GDP estimates lag well behind economic events. This is true even of the initial estimates of GDP that capture the headlines but that will be subject to significant revisions. We are already in June and national income estimates for the first quarter of 2012 still are only partly released. These lagging indicators of economic outcomes call for more up to date estimates – hence our HNI. But one does wonder about the usefulness of the Reserve Bank’s Coinciding Business Cycle Indicator, or even its leading economic indicator, that even lags behind the lagging GDP estimates themselves.


