The recent labour force survey of some 30,000 households by Stats SA confirmed the baleful state of the labour market. That is the ever growing mismatch between supply and demand for workers in SA. In the third quarter the supply of potential workers increased, by 153,000 or 0.4% and much faster than the demand for them that increased by 92,000 to 16.4m. The numbers defined as unemployed, not working but actively looking for work, increased by 127,000 to 6.2m pushing the unemployment rate up to 27.5% of the potential work force.
But not all the news from the employment front was bad – depending on your perspective. While the formal sector continued to shed jobs, the informal sector was adding them at a rapid rate. In Q3 informal employment outside of agriculture rose by 188,000 and by 327,000 or 12.2% over the past year to over 3m workers employed informally, or over 18% of all employed.
The decline in formal and the increase in informal employment is not a coincidence. Formal employment has been subject to a rising tide of intervention by government and trade unions (with more to come soon in the form of a national minimum wage) These have provided those in jobs with consistently improved wages and other valuable employment benefits and security to a degree against dismissal and compensation for retrenchment. The informal sector’s employers and workers largely escape these constraints on the freedom to offer and supply employment opportunities. If formal employment – decent jobs as they are described – are unattainable – the choice may be only informal employment or not working or earning much less. A Hobson’s choice that many more South Africans are exercising.
It should be well appreciated that while formal employment, outside the public sector, has stagnated, the share of employment costs in total value added by private business has not fallen. The bill for employment benefits in real terms has gone up in real terms as have employment benefits for those in work, even as the numbers employed have gone down. ( see figures below)
Non-Financial Corporations – Share of Value Added. Operating Surplus and Compensation of Employees
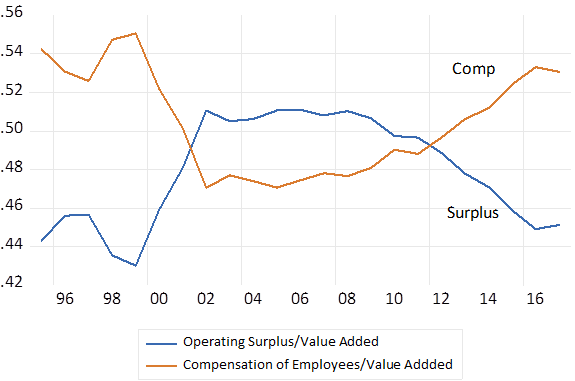
Source. SA Reserve Bank and Investec Wealth and Investment.
Real Value Added by Non-Financial Corporations (1995=100) Using household consumption deflator
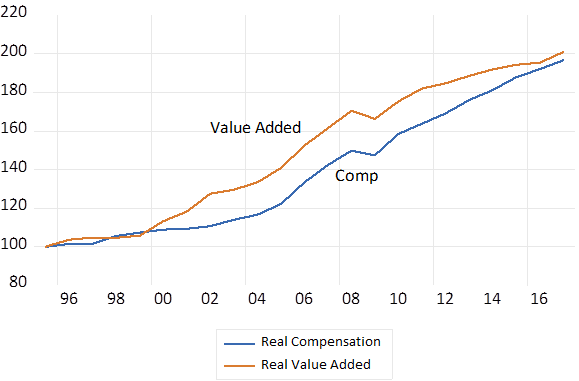
Source. SA Reserve Bank and Investec Wealth and Investment.
Non-financial corporations – Growth in Real Value Added and Real Compensation (using household consumption deflator)
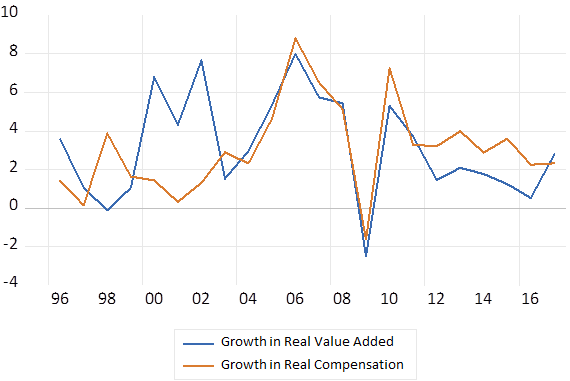
Source. SA Reserve Bank and Investec Wealth and Investment.
If the wage bill in any sector of the economy goes up faster than the decline in union membership (as it has been doing) the pool of income upon which to draw union dues is deeper, not shallower. Strikes that increase employment benefits at the expense of employment are therefore not irrational from the perspective of union leaders -if wages increase at a faster rate than employment declines.
The jobs summit would have been better described as the “Decent Jobs Summit” for which the heralded Landmark Framework Agreement is but a wish list of all and everything that can be imagined to promote the demand for labour. A plan however that gives no consideration to the possibility that the rising cost of hiring labour and the more onerous conditions imposed on its hire, may have something to do with the disappointing volume of employment provided.
Everybody will agree that decent jobs for all able and willing to work is to be wished for. And to hope that economic growth can make it possible – as has largely true of employment conditions in the developed world. But the irresistible truth is that far too few South Africans have the skills, the qualifications or experience to allow them to be employed on decent terms- by inevitably cost conscious employers .
And the soon to be imposed National Minimum Wage (NMW) of R3500 per month or R20 per day will make it even more difficult to find employment outside of the informal sector. Because these minimums are well above what many in employment currently earn. And despite the fact that of the poorest in SA the apparent beneficiaries, a very small proportion are currently employed.
For all the many (including economists who should be trained to know better) to wish wages higher and poverty away it has been convenient to ignore the findings of the one comprehensive and highly relevant study. That is the very thorough study by Haroon Bhorat and colleagues of the impact of higher minimums etc. on employment in SA agriculture introduced after 2003. The impact on employment- down 20% -and much improved wage benefits for those still employed – were correctly described by the analysts as significant. There is every reason to conclude that the impact of the NMW on employment will be as significantly and destructive for those who lose their jobs. And helpful for those who retain their jobs on improved terms. They will be even more carefully selected for the skills and strengths they bring to their tasks. The informal sector will have to come to the rescue of the larger numbers of unemployed workers while they wait impatiently for economic miracles.
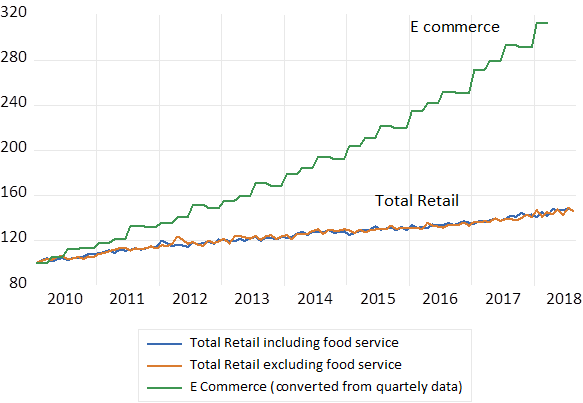
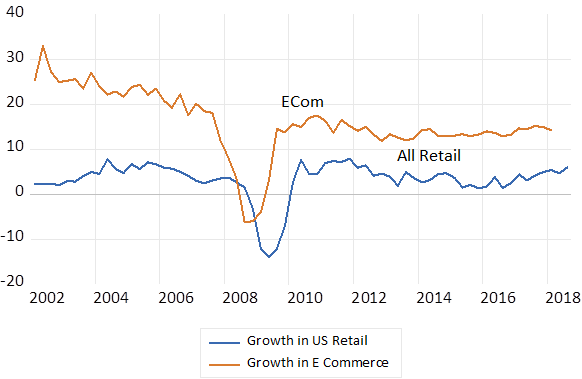
.jpg) Retail sales of all kinds have been growing strongly, though the growth cycle may have peaked. As may GDP growth, leading perhaps to a more cautious Fed. How slowly growth rates will fall off the peak is the essential question for the Fed, as well as Fed watchers, and answers to which are moving the stock and bond markets.
Retail sales of all kinds have been growing strongly, though the growth cycle may have peaked. As may GDP growth, leading perhaps to a more cautious Fed. How slowly growth rates will fall off the peak is the essential question for the Fed, as well as Fed watchers, and answers to which are moving the stock and bond markets..jpg)
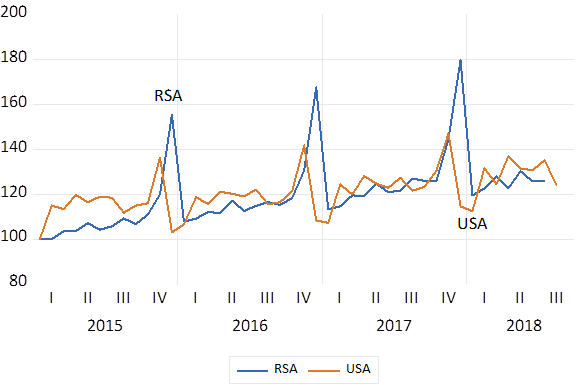
.jpg) In-the-black Friday for SA retailers thus comes later than it does in the US, and perhaps makes the case for adding promotions in November to smooth the sales cycle and reduce the stress of running a retail business. Retailers will also hope the Reserve Bank is not the Grinch who spoils Christmas.
In-the-black Friday for SA retailers thus comes later than it does in the US, and perhaps makes the case for adding promotions in November to smooth the sales cycle and reduce the stress of running a retail business. Retailers will also hope the Reserve Bank is not the Grinch who spoils Christmas.