Ten years after the crash: What has South Africa learnt?

Listen to the Podcast: 10 Years after the crash

It’s a decade since the global financial crisis shook the world’s financial system. The policy response prevented a global depression, but in the process rewrote the textbook on monetary policy. Professor Kantor examines the crisis and the policy response – and then looks beyond, with particular lessons for South Africa.

The backdrop to the global financial crisis

The global financial crisis (GFC) of 2008-09 was caused by the collapse in the value of US homes, as well as the globally-circulated securitised and mortgage debt that had funded a long boom in US house prices. The value of an average US home had increased by an average of 9.2% per year between January 2000 and December 2006. By the time house prices bottomed in February 2012, the average home had lost 32% of its peak value of July 2006. US mortgages on the balance sheets of banks around the world – not only in the US – had lost much of their once-presumed secure value. As a result, much of the capital of the highly leveraged banks was wiped out.

South African banks cannot flourish without a strong economy. Similarly, the economy cannot flourish without real growth in the supply of money and credit. Both have been lacking recently as we show in figure 1 , where we relate real economic growth to the real money and credit supply.

As was the case between 2003 and 2008, it will take a combination of better export prices, a stronger rand, less inflation, and lower short-term interest rates to spark the economy to a cyclical recovery. It will also take more encouraging economic policies for investors in SA businesses (less policy associated risks), including investors in SA banks, to permanently raise the growth potential of the South African economy. There is no reason to believe that South African banks would not be up to the task of funding a much stronger economy. What is required for both are higher returns on capital invested by banks and businesses generally: these would need to be risk-adjusted returns that would justify reinvesting earnings at a faster rate, and raising additional share and debt capital to sustain growth.
The price index of US bank shares peaked in May 2007 and troughed in September 2011, some 70% lower. Average house prices in the US regained their crisis levels by 2013, while the value of the average US bank share exceeded its value of September 2008 a little sooner. The values of both US banks and houses are now above their pre-crisis peak levels, though it took until 2016 or 2017 to get back to the heights of the pre-crisis boom (see figure 1 ).

The crisis for US banks has been long over, thanks to the bold and unprecedented interventions of the US Federal Reserve (the Fed), which pumped extraordinary amounts of cash into the banking system. The US Treasury recapitalised the banks, even those that it was argued didn’t need the helping hand. Europe took longer “to do what it took,” in the famous words of the chairman of the European Central Bank (ECB), Mario Draghi, but largely succeeded in securing its banking system. The central banks and treasuries of Japan and the UK ran their own similar rescue operations.

South African banks were not directly exposed to the US mortgage market, although those with significant exposures offshore felt more of the draft. This was because the South African housing market held up well enough in its relevant rand value after 2008 to prevent any major write-downs of the value of the mortgage credit provided by the banking system. The price of the average middle-class house maintained its rand value after the GFC, while the fall in the value of the banks listed on the JSE was less severe than in the US.

South African banks and other financial institutions were, however, damaged collaterally by the collapse in the share prices of banks and financial institutions in the developed world. They were also damaged by sharp declines in the value of corporate and government debt, including South African government debt held on their balance sheets. The rand value of the JSE Banks Index declined by about 43% from its peak of April 2007 to its trough in February 2009 (see figures 2 and 3 in link ).

The impairment ratio of SA banks fell sharply between 2003 and 2007, but then rose sharply to ratios of about 2.4% to 2.8% of credit provided. These ratios have been more or less maintained since 2010.

The South African Reserve Bank did not practice quantitative easing (QE), which are efforts to avert a liquidity crisis by pumping cash into the banking system through the purchase of government bonds and other securities in the market on a truly massive scale. Nor did the South African Treasury have to recapitalise the system by subscribing to additional share or debt issued by banks and insurance companies, as did the US government and the European Central bank.

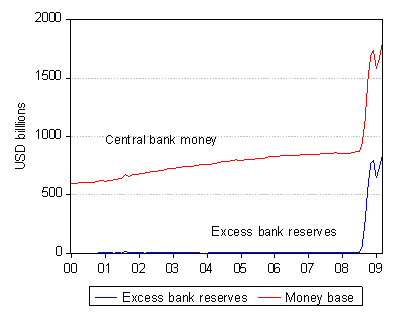
Much of the extra cash supplied to the banks of the US, Europe and Japan ended up on the asset side of their balance sheets as deposits with their central banks. The scale of these bank deposits with their central banks grew to be well in excess of the cash reserves they were required to hold against deposit liabilities. The extra cash supplied by central banks to their member banks was held as cash rather than used (as would have been usual) to fund bank loans or investments. Holding excess cash reserves that usually earn no interest is not profitable for banks, though the US Fed offered interest on these deposits. The other central banks do not do so, and the ECB charged banks to hold deposits.

The extra spending normally associated with additional cash supplied to banks thus did not materialise. This was because the extra cash supplied to the banking systems was closely matched by extra demands for cash. Inflation was restrained accordingly, in response to QE. Indeed, central bankers worried more about deflation than inflation after the crisis, a concern that encouraged still more QE until 2015. Only then did the Fed balance sheet stop increasing. A reversal of QE – reduced central bank holdings of assets – is still to transpire in Europe or Japan.

In figures 5 and 6 we demonstrate QE in action in the US. Note the increase in the size of the Fed balance sheet – from less than US$1 trillion in 2008 to over US$4 trillion by 2014. Note also the equivalent increase in cash reserves (deposits with the Fed) of close to an extra US$3 trillion – almost all of which were in excess of required reserves. Cash supplied by a central bank is described as high powered money because it leads to a multiple expansion of bank deposit liabilities (and bank credit on the asset side of the balance sheet of the banks). This is because the cash supplied to the banking system by the central banks is then loaned out by the banks and put to work by the customers of banks.[1]

The contrast with South African banking developments over the same period is striking. The assets of SA banks declined very marginally after 2008, while those of the SA Reserve Bank increased at a steady pace. Moreover, the cash reserves held by SA banks, as normal, were held almost entirely to satisfy required reserve ratios set by the Bank. Excess reserves were kept at minimal levels while the commercial banks continued to borrow cash from the Bank – rather than supply more cash to the central bank, as has been the case in the US, Europe and Japan. It is of interest to note how much more dependent the SA banks have become on the cash they borrow from the central bank since the crisis. Currently, the liquidity supplied to the SA system by the Bank is of the order of R60bn.  We return to a possible explanation of these SA trends below, where we consider trends in the equity capital ratios of SA banks.

The study can be found on my blog, www.zaeconomist.com. It is perhaps worth emphasising that it is not the supply of money, however broadly defined, that matters for the level of spending and so prices, but the excess supply of money over the demand to hold that money that can be inflationary.

SA and US economic trends before and after the GFC

When comparing the developments in the US and SA before and after the GFC, it is relevant to note the very different circumstances that prevailed in the SA and US banking systems before (see figure 8 ). Between 2003 and 2008, SA banks were on a lending and money (mostly bank deposit) creation spree that accompanied and financed a period of rapid growth in the SA economy. This boom period has sadly not been repeated. Credit and money supply growth in the US, despite the housing boom, was more subdued at that time, though the temporary pick up in US money supply growth after the GFC should be noted. This response softened the blow of the recession that followed the GFC.

In 2006 at the peak of the bank credit cycle, bank lending in SA was growing at a very robust rate of over 25% per annum. Lending on mortgages had been growing at close to 30%. Mortgage loans can account for as much as 50% of all bank credit provided to the private sector in SA.

Such growth was regarded by the Bank as unsustainable and was then inhibited by significant increases in interest rates and borrowing costs. The slowdown in the growth in bank credit was therefore well under way when the GFC broke, as may be seen in the figures below . Hence it is difficult to isolate the impact on the SA economy of what was the end of a boom and the shock to the economic system that emanated from abroad. It is nevertheless clear that the GFC made any smooth adjustment to more sustainable growth in SA output, money and credit growth perhaps impossible, whatever might have been the reactions of the Bank.

The boom in money supply, the real economy between 2003 and 2008 and the subsequent
slow-down thereafter is demonstrated further in figure 10  below. While GDP growth turned negative immediately after the GFC, the economy soon improved and registered GDP growth of over 3% in 2011, with money supply growth rising from negative growth in 2009 to about a 10% annual rate by 2012.

The decline to sub 2% GDP growth rates occurred only after 2014, accompanied by a decline in the money supply and credit growth rates. It should be noted how rapidly short-term interest rates were allowed to fall soon after the GFC. They were increased in 2014 despite the persistent slowdown in GDP growth, which contributed to the higher interest rates.

In figure 11 we show exchange, interest and inflation trends before and after the GFC. The GFC brought with it a much weaker rand, and was preceded by higher inflation and interest rates. The recovery in the USD/ZAR exchange rate after 2009 was accompanied by much lower inflation and interest rates, resulting in the short-lived recovery in GDP.

The forces driving the SA economy, before and after the GFC

However, supporting these economic trends was the state of the global economy and the effect it had on metal and mineral prices that are so important for the balance of payments (including capital flows). It also had an effect on the direction of the rand and therefore, in turn, resulting in less or more inflation and so lower or higher interest rates. In figure 13 we show the key and related cycles of GDP growth trends, and those of the export and mining deflators.

The 2003-2008 boom was accompanied by improved mining and export prices. The downturn in the economy after 2008 was accompanied by a fall-off in mining and export prices. The GDP recovery after 2009 was accompanied by the revival of the commodity supercycle that ended in 2014. It is no coincidence that GDP and money and credit growth slowed so severely after 2014. The accompanying increase in interest rates added salt to the wounds of weaker commodity prices and the inflation that followed a weaker rand. The hope is that the recent recovery in the commodity price cycle, should it last, can help stimulate a recovery in GDP and credit growth.

SA banks: profitability and capital adequacy

Figure 14 shows the total assets of the SA banking system, the equity capital raised by the banks, and the ratio of equity to total assets between 1990 and 2018. The ratio of equity to total assets and liabilities of the banks rose through the 1990s. It peaked to about 27% in 2002 and then rose again with the GFC. The equity ratio has since declined and more or less stabilised around 17% of total assets and liabilities.

Figure 15 shows JSE-listed bank earnings and dividends per share and the ratio of earnings to dividends (the payout ratio). Dividends have been growing faster than earnings since about 2000 and the payout ratio (earnings/dividends) has declined consistently since the GFC.

Between 2000 and the GFC, annual growth in earnings averaged an impressive 19.1% a year. The best month saw growth in earnings of 45% and the worst saw earnings decline by 6%. Dividends grew at an average 18.4% a year, with the worst month recording positive growth of 5.5%. Since the GFC, JSE bank earnings have grown on average by 7.3% a year and dividends at a more robust 12%. The worst month for earnings growth, a decline of 27%, was recorded in February 2010.

Since 2012, bank earnings have grown at a steady 13% average annual rate and dividends at over 16%, though this growth has been declining with slower growth in the economy and in the pace of lending. The lack of demand for bank credit, and perhaps some lack of willingness to provide credit, has reduced the profitability of the SA banks and the case for retaining profits to fund growth. Additional reliance on cash borrowed from the Reserve Bank, noted previously, perhaps served a similar purpose to maintain generous dividend payments.

Conclusion – the future of the SA banks and the economy will depend on the returns to investing in SA

South African banks cannot flourish without a strong economy. Similarly, the economy cannot flourish without real growth in the supply of money and credit. Both have been lacking recently as we show in figure 17 , where we relate real economic growth to the real money and credit supply.

As was the case between 2003 and 2008, it will take a combination of better export prices, a stronger rand, less inflation, and lower short-term interest rates to spark the economy to a cyclical recovery. It will also take more encouraging economic policies for investors in SA businesses (less policy associated risks), including investors in SA banks, to permanently raise the growth potential of the South African economy. There is no reason to believe that South African banks would not be up to the task of funding a much stronger economy. What is required for both are higher returns on capital invested by banks and businesses generally: these would need to be risk-adjusted returns that would justify reinvesting earnings at a faster rate, and raising additional share and debt capital to sustain growth.

For a fairly recent full account of the money supply process in South Africa, see MONEY SUPPLY AND ECONOMIC ACTIVITY IN SOUTH AFRICA – THE RELATIONSHIP UPDATED TO 2011, G D I Barr and B S Kantor,  J.STUD.ECON.ECONOMETRICS, 2013, 37(2)

A New York state of mind: Some judgments about the economic and financial state of play

Financial markets have normalised. Much of the dislocation has been resolved – and the more obvious opportunities provided by dislocated markets have to a large degree been exercised (think of recent moves in sovereign bonds, corporate bonds, bank credit, emerging equity markets). Equity market volatility has subsided.

The US economy will come out of recession in H2 2009: positive growth will be achieved and is well under way. Preliminary Q2 estimates of GDP will be released on Friday. Even the housing market has turned with sales of new houses off their bottom. Yesterday’s Durable Goods number – excluding volatile aircraft orders – was a good number. Such a view of recession being over is not contentious but is now consensus.

The normal forces of economic growth and earnings growth surprises (up or down) therefore take over as the main drivers of equity and bond markets. Higher short and long term interest rates – while a sign of recovery under way – will not be welcome.

The key issues will be the pace of US recovery, V or U shaped – and even it is V shaped (driven by depressed output catching up with stable final demand) – the question that will be asked of the US is: can such fast growth be sustained over the next few years? That the US recovery is ahead of Europe’s should be helpful to the US dollar/euro rate of exchange.

The answer to this issue about the long term growth potential of the US economy is for observers to expect less long term growth. Given the state of fiscal policy, higher taxes and more intrusive government will be expected to restrain growth. The ability of the Fed to withdraw the punch bowl before the party gets raucous will remain a live one – inflationary expectations remain very low and explicit real interest rates remain depressed. The bond market vigilantes are sleeping soundly at home for now. Any inflation threat to bond yields and mortgage rates will be most unwelcome but always possible. Corporate bonds remain more enticing than government bonds.

Emerging market economies offer a much healthier prospect, but their equity markets have run very hard, as have their currencies. The EM index and the JSE ALSI in US dollars are both up 80% from their lows in early March and the rand is up there with the best performing EM and commodity currencies. This is a very powerful run indeed. China has led the way and possible oriental bubbles will be of concern.

The SA economy continues to languish without active enough assistance form monetary policy. But the better state of the global economy will be helpful to SA exporters. Lower inflation and the strong rand will be helpful for consumers.

Reserve Bank Governor Tito Mboweni’s decision not to lower rates in June can perhaps be regarded as a final act of defiance. Knowing (presumably) that he was to lose his job he stuck to his inflation target guns even as his ship was sinking. He had failed to seize his opportunity to save the economy with an activist programme. Even as central bankers elsewhere put on the Superman capes he remained aloof as if all that mattered was inflation. This was not only arguably an error of judgment but obviously very poor survival tactics.

The case for lower interest rates remains as strong as ever and if Gill Marcus is in the next MPC chair – one assumes she will be – she will surely wish to distance herself from her predecessor. They apparently did not get on at all well when she worked at the Bank as Deputy Governor and resigned accordingly.

There is in this author’s mind at least a 50% chance of a 50bps cut at the August MPC meeting; and if August is too soon to signal change in direction of monetary policy then there is a much greater chance of a cut, perhaps even a 100bps cut, at the following meeting. The money market is not expecting any change in rates for now – or at least wasn’t yesterday. Watch this space.

*The author wrote this piece while on a visit to the US

Volatility update and what it means for the JSE

Investors will be well aware of the extremely wide daily moves on the JSE and other equity markets, such as the benchmark S&P. We show such daily moves below. It may be seen how volatile the markets became during the height of the credit market crisis in September 2008 and have become only partially less volatile since then.

Daily percentage moves in the S&P 500 and the JSE

Cont_9.jpe

Source: I-Net Bridge and Investec Securities

The average moves can only tell part of the story, especially when the movements higher are cancelled by falls in the market. It is the movements about this average that tell us about the extremely volatile conditions with which investors have had to cope recently. Movements about the average are captured by the statistic known as the standard deviation (SD) of a series about its average.

Measuring volatility

Between June 2005 and June 2008 the SD of the S&P 500 Index was less than one per cent per day on average, (0.08011 per day) to be exact. The SD of the JSE ALSI moved on average by 1.1% per day over the same period. Since then the SD of daily moves on the S&P 500 have more than doubled to 2.5% per day on average while the SD of the average daily move on the JSE have almost doubled to 2.1%.

In the figure below we show the volatility of the S&P, the JSE and the MSCI Emerging Market Index since 2005. We measure volatility as the 30-day moving average of the Standard Deviation of the Index. As may be seen the volatility on the different markets are highly correlated indicating just how well integrated global financial markets are. There are no places to hide in equity markets.

It should also be noticed that volatility has receded sharply from the extreme levels of September 2008. Volatility picked up again in January 2009 only to recede again in March. While now significantly lower than it was, volatility is still well above what might be regarded as normal levels, as may be seen below.

Global equity market volatilities

Cont_10.jpe

Source: I-Net Bridge and Investec Securities

Risks and returns – economic theory vindicated

Clearly the more volatile the markets the more risks faced by investors for which they will seek compensation in the form of higher returns. And so as we show below, as the risks increased dramatically so the markets fell away equally dramatically. The recent recovery in the ALSI and all the other equity markets – from their lows of early March – have clearly been associated with less risk. We show below the relationship between the JSE ALSI and the 30-day moving average of the standard deviation of its daily returns. The reduction in volatility has been very helpful for the market. Indeed, without the company of consistently lower volatility it is difficult to predict further consistent advances in the equity markets.

The JSE and its volatility

Cont_11.jpe

Source: I-Net Bridge and Investec Securities

Implicit and actual volatility compared

Another method for measuring volatility is to calculate the volatilities implied in the prices of options bought and sold on the equity market. In Chicago such an index known as the Vix is actively traded – so that volatility itself can be bought and sold. A similar measure of implied volatility is calculated for the JSE and published as the Savi. These measures may be regarded as forward looking measures of expected volatility, and can be compared to the actual volatility registered by the standard deviation of recent daily moves in the Index. As we show below these two measures of expected volatility that influence today’s share prices are also highly correlated, providing further evidence of the integration of global equity markets.

Implied equity market volatility – the Vix and the Savi

Cont_12.jpe

Source: I-Net Bridge and Investec Securities

In this case past performance of volatility does seem to be a very good guide to expected volatility. The 30-day moving average of the SD of the daily moves on the S&P 500 and the JSE Alsi tell very much the same story about volatility as we show below.

Volatility compared – SD of daily returns Vs the Savi

Cont_13.jpe

Source: I-Net Bridge and Investec Securities

Explaining volatility

Clearly returns and risk as measured by actual or implied volatility will move in consistently opposite directions as economic theory would predict. Higher returns after all are the expected rewards for bearing higher expected risks.

The cause of the surge in volatility in mid 2008 is obvious enough. The credit crisis made it near impossible to estimate with any degree of confidence the outlook for real economic growth and so for the earnings of listed companies. The economic outlook had obviously deteriorated but by just how much was impossible to say. Furthermore the credit market crisis itself did more than collateral damage to companies via the state of demand for their products. It made it much more difficult for them to raise finance and when finance was available it had become much more expensive. Thus risks of default and al it cold mean for the value of debt and equity capital increased markedly.

The issue of how to value the future income to be generated by a listed company became subject to most unusual difficulty. The difficulty the market has in estimating value shows up in sharp daily and even sharp intraday moves in share prices. Economic news in such circumstances becomes especially difficult to interpret and consensus about what it all means becomes especially difficult to reach. Hence much reason for changing opinions about the outlook for economies and firms that are reflected in volatile share prices.

Why volatility has receded

Volatility has receded in recent months because, while the outlook for the global economy has not improved greatly, there is much more confidence in economic forecasts. The downside seems now to have a bound to it compared with a few months ago when the downside seemed so difficult to estimate. The recovery in the credit markets has contributed greatly to this. Capital markets have not frozen. The appetite for corporate paper, offering perhaps only temporarily high yields, has been recovered. Companies are raising both debt and equity capital in a very much a normal way. Default risks have receded.

One senses that there is further scope for improvements in both the confidence with which the economic outlook can be forecast. Even if the news about the economy does not show any marked improvement, a stronger sense of what the future holds will reduce fear of the future and the volatilities associated with such fears. It will be much more helpful for equity investors when the forecasts themselves can predict economic recovery with a degree of confidence. If economic recovery comes more firmly into sight, default risks implicit in the still large interest rate spreads paid by corporate borrowers over governments, will recede further to the advantage of their bottom lines. With economic recovery confidence in the survival prospects of the will improve further to the advantage of the equity investor.

The interest rate outlook has become very clouded

One of the uncertainties to be resolved with any sustained economic recovery will be the future of government interest rates themselves. Short term interest rates will rise as economies recover and long term government bond rates will take their cue as always from the outlook for inflation. The outlook for inflation has become particularly difficult to estimate. Central banks in the US and Europe are pumping cash into their banking and credit systems to help encourage lending and spending. The cash in large measure is being hoarded rather than lent or spent. And so deflation rather than inflation remains the immediate threat to the US economy.

The path from deflation to inflation will be a difficult journey

But at some point with recovery, inflation will become the danger to be addressed by the Fed. The issue of whether the Fed can get its timing right to prevent actual inflation from rising is a live one. Good timing – from fighting deflation to fighting inflation – will be made all the more difficult by the surge in US government borrowing that will continue for years putting pressure on long term interest rates. Such pressure, when it occurs, will add temptation in the form of monetising the debt as a temporary alternative to the sting of higher interest rates.

Interest rate volatility

We show below just how much more volatile US long term government bond yields government have become. These volatilities also measured by the 30 day moving average of the SD of daily interest rate moves increased greatly in the midst of the credit crisis. They increased even as government interest rates fell which was result of the greatly increased demand for default free safe havens. But these volatilities remain highly elevated and such risks will not only influence the government debt markets, they will also make it harder for the equity markets to perform well. It is of interest to note that US bond yields have been a lot more volatile than long dated RSA yields

The volatility of long term government bond yields. USA and RSA

Cont_14.jpe

Source: I-Net Bridge and Investec Securities

Interest rates and the equity markets

In our view the uncertainty about the inflation outlook in the US and elsewhere and the direction of interest rates has already entered the equity markets, to its disadvantage. To be equity market bulls now would require optimism about the outlook for economic recovery and optimism in the ability of the Fed to negotiate successfully the fork in the road when it points to inflation rather than deflation. Furthermore the bond market will have to share this confidence in the excellence of Fed timing. This confidence would show up in lower volatility of interest rates. We will be watching trends in the volatility of equity markets and debt markets very closely as a guide to the direction of the equity markets.

Explaining quantitative easing and the case for its application in SA

 Introduction

 In this report we explain why quantitative easing has been called for in the US because the demand by banks to hoard cash has increased so dramatically despite lower interest rates. This demand for cash has meant less bank lending and a weaker economy. In South Africa the unwillingness of banks to lend has also to be countered for the sake of the economy. However the monetary problem locally, unlike the US, is the slow growth in the supply of cash rather than the increase in cash hoarded at he Fed. We call for a combination of lower interest rates and quantitative easing to revive bank lending and the SA economy

 Lower interest rates may not work if banks prefer to hoard than lend cash

 It is clear that reducing interest rates cannot on their own always revive an economy in recession. Central banks in the US and Europe have become ever more ready to freely assist their member  banks with cash at close to zero rates of interest. But the private banks have remained unwilling to borrow the cash. They have preferred to lend more to their central banks rather than borrow from them.

 As we show the US banks have come to hold cash reserves far in excess of their legal requirements to do so and this demand for cash has greatly inflated the supply of central bank money in the US being the sum of the notes issued by the Federal Reserve Banks plus the deposits of the bans with the Fed less the cash held to meet compulsory reserve requirements.

 US central bank money and excess cash reserves of the banking system

Source; Federal Reserve Bank of St Louis and Investec Securities Source; Federal Reserve Bank of St Louis and Investec Securities
 

The banking system is powering down rather than up

 This sum of central bank money is sometimes described as the money base of the system or more evocatively as its high powered money. This description indicates that increases in central bank money usually power up the supply of bank deposits in the system that are included in the broader definitions of the money supply (M1, M2, M3) But this can only happen when the banks lend out the cash. When the banks hoard the cash the system powers down rather than up as it is now doing.

 Thus quantitative easing

 Hence the call for quantitative easing to get the cash on the balance sheets of the central banks back into circulation so that it can help stimulate more spending as extra money normally does. The central banks eases quantitatively by utilising the cash it has on deposit to buy assets in the money and credit markets. This exchange of cash for assets, usually for securities issued by the government itself or government supported agencies, gets cash in the hands of those – unlike the banks – who are more likely to spend or lend rather than hoard cash. Judged by the recently improved ability of US and European companies to raise capital in the money, bond and lately also again in the equity markets, it does appear as if the global credit system is easing up in a most welcome way.

 Both the supply of and demand for money matters

 Recent developments in the money markets helps to remind us that what matters is not so much the supply of money but the excess supply of money, that is the excess of the supply of money over the demand to hold money. When the supply of money grows faster than the demand to hold more money  the extra spending then pushes up prices at a faster rate. And when the supply of money lags behind the demand to hold money you get the opposite – less spending and deflation. This is the problem for the developed world- the demand to hoard money has grown even more rapidly than the supply of money. The challenge central bankers will face in due course will be to reign in the supply of cash when the banks become more willing to lend and less anxious to hoard their cash.

 In South Africa the supply of money is growing far  too slowly

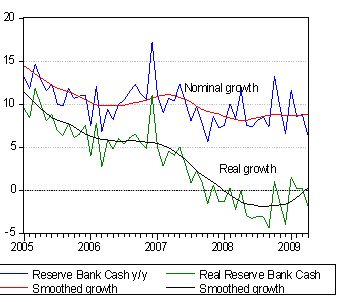
 While the SA economy is also performing well below its potential completely opposite conditions prevail in the money market. Unlike the case abroad, the growth in the supply of SA Reserve Bank money has been growing very slowly and far too slowly for the health of the economy. (See below) As we also show the growth in the supply of more broadly defined money, to include deposits issued by the commercial banks, has been decelerating sharply, as has the growth in the supply of bank credit to the private sector. The growth in M3 that was over 25%

in mid 2007 is now running at about 10% pa as may be seen in the figure below.  However this growth rate understates the recent sharply decelerating trend in the growth in money and credit. The March 2009 quarter to quarter seasonally adjusted rate of growth in M3 was but 6% and the growth in bank credit supplied to the private sector was but 2%. Clearly these growth rates are far to slow to help revive the SA economy.

 Growth in SA Reserve Bank Cash Supply


Source; SA Reserve Bank and Investec Securities

 South Africa; Growth in M3 and Bank Credit supplied to Private Sector


Source; SA Reserve Bank and Investec Securities


No banking crisis in SA – merely an economic crisis not helped by nervous banks. Quantitative easing called for

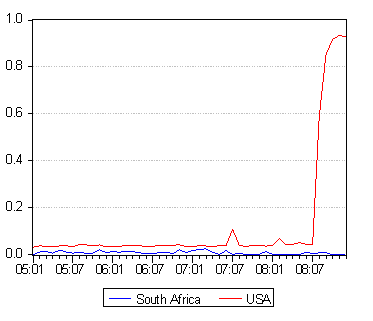
 South Africa has not suffered  from a credit or banking crisis. Banks in South Africa, unlike their US peers have therefore not increased their demand for cash reserves. The ratio of excess reserves to the supply of central bank money remains very close to zero as we show below.

 USA and South Africa- ratio of excess to required cash reserves of Banking System


Source; SA Reserve Bank Federal Reserve Bank of St Louis and Investec Securities
  But the SA economy is growing far below its potential. SA banks too are suffering from higher write offs for bad debts though nothing like the scale infecting the banks in the US. Yet much more important they too have become more reluctant to lend and this is adding to the weakness of the economy. Something therefore needs to be done to accelerate the growth in the supply of money and credit in SA . Lower repo rates, still far higher than levels in the developed world,  may not be sufficient to the purpose. Quantitative easing in fact is as much called for in South Africa as it is the US to encourage the banks to lend more.

 How best to ease quantitatively

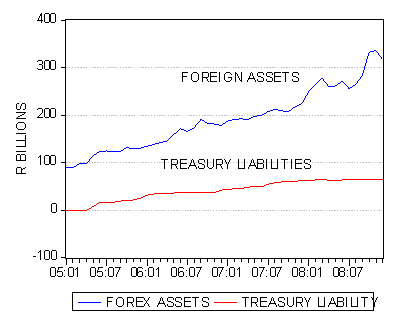
 The method to do so is at hand. That is for the Reserve Bank to counter unwanted rand strength with purchases of foreign currency. However the additional rands, used to pay for the  foreign currency, should be allowed to a greater degree to find their way into the market rather than be sterilised by the Treasury. Such sterilisation operations have taken place on a large scale in recent years to counter the growth in the foreign exchange and gold assets of the Reserve Bank. The Treasury has borrowed large sums, some R66b at year end to this purpose. The funds raised are then kept idle at the Reserve Bank and these idle balances then reduce the cash available to the private sector and prevent the money supply from increasing.

 SA Reserve Bank


Source; SA Reserve Bank and Investec Securities

Given the increase in the fiscal deficit and the ordinary borrowing requirements of the Treasury the idea of selling fewer interest bearing government bills and bonds for the purpose of restraining the growth in the cash supply should have additional appeal. The case for encouraging the supply of cash to grow faster in SA has become a very strong one. The SA economy needs both lower interest rates and quantitative easing to recover its growth momentum.

Encouraging declines in risk aversion

It was not a good week for global equity investors with the Emerging Market Index down 2.4%, the S&P 500 down 5% and the small US cap Russell 2000 off nearly 7% by the weekend. The SA component of the MSCI EM Index fared relatively well and was 1.5% weaker in US dollars. The rand investor on the JSE suffered only marginal weakness with Industrials up 2% and Resources off a little more than 2%. The rand ended the week nearly 5% weaker vs the USD and on a trade weighted basis.

Continue reading Encouraging declines in risk aversion

How Keynesian are we?

Back from Davos

Maria Ramos, once Director General of the Finance Department, then CEO of Transnet and now of Absa and also incidentally newly married to long serving Minister of Finance Trevor Manuel, returned from Davos to tell us “We are all Keynesians now”

This is what Time magazine thought prematurely in 1965

This was in fact the heading of an iconic Time Magazine story written on 31 December 1965. Economists were then very confident that by fine tuning government spending and taxes, the Keynesian prescription, they could maintain full employment without inflation. Ramos might have been surprised that Time magazine in its “We are all Keynesians now” title was quoting none other than Milton Friedman. It was he more than any other economist who helped suppress the Keynesian revolution in economics.

Continue reading How Keynesian are we?