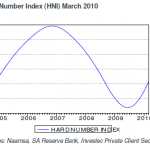
The Reserve Bank on Friday 9 April reported the number of its notes circulating at the end of March. This enables us to update our Hard Number Index (HNI) of the SA Business Cycle that combines vehicle sales, also available for March 2010, with the real money base, that is the note issue deflated by the CPI.
The HNI is pointing firmly upwards, confirming very clearly that the SA economy has entered a new upswing phase in the SA business cycle (see below). Higher numbers indicate that the economy is expanding, that is, the economy is delivering positive rates of growth that will be confirmed in due course by a much wider selection of economic time series. First quarter GDP numbers for example will only be released in June 2010.
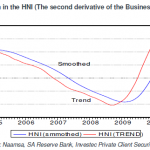
The second derivative of the business cycle, that is the rate of change of the HNI, is also in positive territory and indicates that growth is accelerating. The economy according to the HNI began to grow again in the fourth quarter of 2009, as confirmed by the National Income statistics for the quarter. It is picking up momentum.
image001
image002
As we reported previously, the new vehicle cycle is demonstrating very strong growth. The growth trend in vehicle sales is pointing sharply higher.
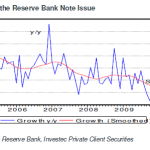
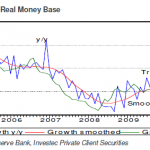
The growth in the note issue picked up in March 2010. However when these numbers are adjusted for the declining trend in the CPI the real money base is indicating positive growth rates at a modest rate (see below).
image004
image005
It should be appreciated that the note issue will grow in line with extra demands for cash that reflect the state of the economy. It is therefore a very good coinciding indicator of the state of the economy rather than a leading indicator. Growth in the supply of cash does not lead the economy but follows it. Nor is it a policy instrument of the Reserve Bank, though we have argued it should be. However the note issue has the great advantage for economic forecasters of being a very up to date indicator of the current state of the economy. Most economic indicators provide only a rear view mirror of the state of the economy.
The HNI overcomes the problem of driving along the economic track through the rear view mirror. The index, as we have shown, tracks the official business cycle indicator of the Reserve Bank very closely. It has the advantage of being very up to date as well as being based on hard numbers – actual vehicle sales and the note issue. The release of the Reserve Bank’s Coinciding Indicator of the SA business cycle by contrast lags behind economic events by three to four months (the latest number is for December).
The HNI therefore estimates the immediate state of the economy and the current estimate leaves little doubt that the economy is in a cyclical upswing and is accelerating.
It seems clear that new Reserve Bank governor Gill Marcus has not yet brought anything of a different point of view to the
Monetary Policy Committee (MPC). The style was much more inclusive and open but the substance was largely the same as
before. She has deferred to the established positions of the MPC of which she is the only new member.
Therefore the sense held by the previous MPC that the economy is at a turning point and therefore needs no further
encouragement for fear of being too procyclical with interest rates (which have declined by 500bp has been maintained). Also
maintained is the concern with second round effects on inflation of electricity price increases – absent of which inflation would not
be regarded as a problem at all by the MPC.
The inflation problem is Eskom and interest rates remain where they are largely because of the Eskom effect on inflation. This
Eskom effect is creating great uncertainty and therefore is affecting inflationary expectations which are presumed to make ever
higher inflation inevitable, unless the Reserve Bank remains vigilant in setting interest rates accordingly.
Had I been at the Media Conference I would have asked this question. Does not the prospect of further electricity price increases
justify lower rather than higher interest rates given the impact of such price increases on domestic spending and therefore on
output and employment?
The answer that would have been provided would unfortunately probably have been something like as follows: no, because higher
inflation following such electricity price increases might lead to even more inflation – because of possible second round effects on
inflation.
That the MPC could still concern itself with second round inflation when the economy is as weak as it is and when the rand is as
strong as it is and when in the Reserve Bank’s view global inflation is not a threat at all to domestic inflation, speaks volumes about
the MPC’s lack of grasp of the causes and effects of supply side shocks on prices. But here nothing has yet changed with Ms
Marcus in the chair – which is the pity.
The right answer would have been yes – because Eskom’s price increase is a tax on consumers and tax increases lead to higher
prices and less spending and in the circumstances, while inflation will go up – profit margins will come down and employment
growth will remain subdued and so the economy will need some encouragement from monetary policy. Or in other words the
distinction between supply side shocks that drive inflation higher and demand led inflation should be emphasised by the
Governor. The Governor should make it clear that Monetary Policy can only be effective against demand led inflation and
monetary policy should not add to the demand reducing influence of higher levels of taxation.
Ms Marcus was also complacent about the negative growth in money supply and credit which other central banks have been very
active in trying, though not yet succeeding in combating. Again the MPC still does not wish to do anything to encourage SA banks
to ease up for the sake of the economy.
But this lack of action by the MPC was surely encouraged by a belief that the domestic economy is recovering. However such
predictions by the Reserve Bank were highly qualified as the quote from the MPC statement below indicates very clearly:
There are signs that the domestic economy will continue on its recovery path but economic growth is expected to remain below
potential for some time; and dependent to some extent on the pace of the global recovery, which still appears to be fragile and
uneven across regions. Economic growth is also expected to be constrained by subdued domestic consumption expenditure. The
domestic outlook for inflation remains favourable as a result of weak demand pressures and the main threat to the inflation outlook
emanates from possible electricity price increases.
We however see no signs of any meaningful revival in domestic spending. Reference was made to the particular unpredictability of
GDP growth this past quarter- of which preliminary estimates will be released next week. However marginally positive quarter-on-
quarter GDP growth may be recorded even as final consumption and investment demands decline. Improvements in net exports
and a reversal in inventory accumulation may yet allow GDP to grow even as final demand remains very weak. Even a modest
recovery in GDP growth would therefore not indicate the likelihood of the SA economy operating even close to its potential over
the next year – something that should concern the MPC greatly.
Should the Reserve Bank be surprised by the lack of economic recovery, it now only has its next meeting in January 2010 to
respond to it. We should not expect any emergency meeting before then and we should expect interest rates to remain on hold for
much of 2010. We can anticipate that a broader mandate for the Reserve Bank is in the offing that would allow it to concern itself
more with the growth outlook and less with the inflation outlook, especially when the inflation is supply side driven, as is clearly the
case now. We would welcome such a development as we would continue to support the independence of the Reserve Bank to act
as it judges – an independence that Governor Marcus will uphold determinedly.
This is not an easy time to be taking over the reins at the Reserve Bank. Spending by households and privately owned firms (which account for a very large part of the economy – up to 80% of GDP) remains in the grip of a very severe recession. More important for Gill Marcus to take into account is that there seems little sign of any imminent recovery in this spending upon which the economy depends for its growth.
For technical reasons the third quarter GDP numbers might look better because exports declined less than imports and the run down in inventories was at a slower pace than it was in the second quarter when an extraordinary reduction in inventories took as much as 10% off the GDP growth rate. But such numbers will indicate just how weak the economy is and there will be little consolation to be found in the trends in spending by the private sector.
The case for a fresh dialogue
The case for the Reserve Bank in these circumstances doing all it can to help the economy by lowering interest rates and pumping in cash to encourage the banks to lend more, might appear unassailable. However the Monetary Policy Committee found reasons at its last two meetings not to lower interest rates or to ease quantitatively.
The arguments that would have supported such inaction would presumably have included the notions that real interest rates in SA were already very low. The argument would also have been made that inflation in SA remains unsatisfactorily high and that elevated inflationary expectations could continue to have an unwelcome self fulfilling impact on inflation itself.
Ms Marcus would do well to question the validity of such arguments. It was such arguments that helped raise interest rates to recession producing levels in the first place and restrained their reversal long after it was clear that the growth in spending by households, particularly on interest sensitive durable goods was falling sharply. The damage caused to the economy is there to be seen. As we have argued before the weakness in the SA economy was of our own making. The global credit crisis made it more difficult to escape from recession.
What exactly are real interest rates?
Firstly let us raise the issue of real interest rates that may be defined as the difference between borrowing costs and inflation. By reference to CPI inflation real money market interest rates in SA may indeed appear very low. However if prices realised by producers, represented by the Producer Price Index (PPI), are taken as the point of reference real interest rates have increased to exceptionally high levels as we show below. The reason for this difference is that while consumers in SA still face inflation, producers have to deal with significant and dramatic deflation.
CPI and PPI Inflation
Source: StatsSA and Investec Private Client Securities
The Consumer and Producer Price Indexes
Source: StatsSA and Investec Private Client Securities
SA Real short term interest rates
Source: StatsSA and Investec Private Client Securities
Real interest rates are very high – not very low
The simple idea behind the importance attached to real interest rates is that higher prices charged for goods sold offset the interest costs of borrowing. In an extreme case, if the prices firms can charge for their goods or services rise faster than the interest rates then doing no more than borrowing (cheap) money to fill up a warehouse with stuff that is bound to increase in value becomes a highly profitable business. For a household taking a loan to buy goods (a car or a house), the prices of which will rise as fast as the interest rates they are charged, may also seem like a good idea.
However as is very apparent SA households are not responding to the prospect of more inflation by borrowing more, even when banks or retailers remain willing to lend. They are borrowing less because the prices of the homes and cars and furniture they might in normal circumstances be in the market for are not expected to rise at anything like their cost of borrowing. They may even be expecting prices to fall. They will know that the rising prices they are forced to pay are for goods and services they cannot store – electricity and other municipal services that could better be described as higher taxes.
The firms that might ordinarily be encouraged to borrow funds to add to stocks and work in progress and to their complement of workers, or to add more plant and equipment, are facing and expecting deflation rather than inflation. For them the idea that their real costs of borrowing have declined is risible. Their real cost of borrowing, that is to say the real interest rates they are paying, has risen dramatically. This is why they are running down inventories, working capital and (most regrettably) workers employed.
The reality is that for producers in SA prices are falling, not rising. The further reality is that higher prices/taxes paid by their customers and themselves for electricity and other services and the higher wages they have been forced to pay their unionised workers have made it harder rather than easier for them to raise prices. The strong rand has most importantly made it more difficult for them to compete on the local or export markets. They have less, not more, pricing power because of the rising trend in CPI and wages. Their operating profits have come under such pressure and this has led them to invest less and employ fewer workers and managers.
Inflation is not a self fulfilling expectation
The notion that in these circumstances producers will not only expect more inflation but that such expectations could be self fulfilling in the absence of support from the demand side of the economy, is surely a damagingly false notion. It means damagingly high interest rates. In the absence of accommodating demands for goods and services inflationary expectations (that is to say in current circumstances, expectations of more supply side shocks for the economy in the form of higher electricity prices) will not lead to still more inflation. Supply side driven inflation expected will however lead to less output and employment. All the Reserve Bank can hope to do in such circumstances is to ease rather than add to the punishment.
The Reserve Bank needs to make the firm distinction between the inflation it does have influence over (demand led inflation) and supply side shocks that cause inflation and even expected inflation to rise – over which it has no direct influence.
Judging the right level of interest rates for SA without full regard to this distinction can prove very damaging to the economy. Interest rates influence the spending decisions of SA households and firms without necessarily having a predictable influence on the supply side of the economy and therefore on prices. The unpredictable link between interest rate changes and the exchange rate makes it even more difficult to know how interest rates will influence the inflation rate in SA.
Ms Marcus would do well to recognise these difficulties for the practice of monetary policy in SA. She should also be under no illusions that the only problem for the Reserve Bank to focus its attention upon for now is the very weak state of demand, not the rate of inflation.
Statistics recently released for new vehicle sales and the note issue of the Reserve Bank in October 2009 do not indicate that any recovery of the SA economy is under way. The data suggest if anything that the SA economy has continued to shrink at a faster rate.
These two very up to date economic series, vehicle sales and the note issue, both actual numbers rather than estimates derived from sample surveys, make up our Hard Number Indicator (HNI) of the state of the economy (we adjust the note issue for consumer prices). As may be seen below our Hard Number Index (HNI) tracks the coinciding business cycle indicator of the Reserve Bank very closely. As may also be seen the HNI calculated to October 2009 is still falling while the Reserve Bank Coinciding Business Cycle Indicator, available only to July 2009, has levelled off.
The Hard Number Index and the Reserve Bank Coinciding Indicator
Source: I-Net Bridge and Investec Private Client Securities
Two measures of the State of the SA economy 2007-2009
Source: I-Net Bridge and Investec Private Client Securities
The HNI and the Coinciding Indicator may be regarded as representing the rate of change of the economy or the first difference of the level of economic activity. When the economy is picking up momentum or accelerating, the indexes should point higher and when the economy is decelerating the indexes should point lower.
The second derivative – that is to say the rate of change of the rate of change – may provide a further indicator of the direction of the economy. However when we review the second derivative of the HNI, it does not suggest that the economy has begun to decelerate at a slower rate. In fact the economy, according to the HNI, appears now to be decelerating even faster than it was. We provide two measures of the direction of the HNI. One is the annual year-on-year change in the HNI and the other the monthly change in the HNI annualised. The monthly move in the index raised to the power of twelve suggests that the economy was deteriorating at a faster rate between August and October.
The HNI – The second derivative
Source: I-Net Bridge and Investec Private Client Securities
While vehicle sales are now declining at a slower rate (see below) the Real Note Cycle or what can be described as the real money base of the system, having tentatively recovered in September, turned down again in October (See below).
New vehicle cycle
Source: I-Net Bridge and Investec Private Client Securities
The real money base cycle
Source: I-Net Bridge and Investec Private Client Securities
The evidence suggests that domestic spending remains very weak. While GDP in the third quarter may have benefited from a less severe run down of inventories and an improvement in net exports, SA households and firms remain highly reluctant to spend more. And while they retain these inhibitions the economy will not be able to make much progress.
The Monetary Policy Committee of the Reserve Bank will be updating its evidence on the state of the economy next Monday and Tuesday under the direction of the newly appointed governor Gill Marcus. The weakness in domestic spending revealed by vehicle sales and the demand for and supply of cash, as well as the slow pace of revenue collected by the Treasury reported on recently, should ordinarily provide every reason for cutting interest rates and quantitative easing, as should the strength of the rand and the lower inflation accompanying the stronger rand.
A newly appointed governor might however prefer to wait and see how the economy evolves before taking any bold action. However any complacency about the ability of a global economic revival to lift the SA out of its current severe recession mire should be actively discouraged by the latest data.
The focus of fiscal policy in South Africa on the long run interests of the economy by living within your means has been admirable. It means building balance sheet strength in the good times when revenue growth is strong rather than indulging in a spending fever. So that when the economy slows down, more debt can be raised to finance government spending to avoid a self destructive resort to higher tax rates. Higher tax rates in a recession can easily lead to less rather than more tax revenue and slow down the economy and revenue growth further.
On reading the Medium Term Budget Policy Statement (MTBPS) one was gratified that the Treasury and its Minister understood these facts of economic life very well. No resort to higher taxes was to be made while government spending was to be sustained. And then the Minister of Finance in comment later last week, in all innocence presumably (hopefully) pronounced on the necessity to raise taxes should the economy not grow as expected.
This is very worrying. The most urgent task facing those responsible for managing the economy is to do all they can to get the economy moving again. This means all the encouragement they can offer households and firms to spend more now. It should mean lower rather than higher tax rates. For example temporarily accelerated investment allowances would help private sector capital formation, which has stalled so badly, as would every effort made to accelerate the award of tenders for the infrastructure programme about which the construction industry is so concerned.
Monetary policy also needs to try a lot harder than it has to get money and credit supply growing again. Lower interest rates might not help much on their own any more, but if accompanied by the quantitative easing practiced everywhere else to pump extra cash into the economy, it would do no harm and might do some good.
Yet despite the recession and the deflation of prices at the factory and farm gates one still hears whispers out of official circles of the danger of self fulfilling inflationary expectations. The theory that inflation can be self perpetuating irrespective of the state of demand in the economy is wanting in ordinary circumstances – it is simply damagingly nonsensical at times like this.
The biggest danger to the recovery of the economy would be the much higher charges Eskom would like to impose on the economy, charges that would allow Eskom to avoid to a significant degree drawing on the government balance sheet to finance its essential capital expenditure. Incidentally this capex is particularly welcome at this stage of the business cycle.
Such price increases well above the cost of supplying additional electricity (costs understood to include an appropriate return on capital to be invested) should be resisted by raising more government debt. That is to say, it should be financed with more Eskom debt, assisted by a further government guarantee, should the considerable guarantees provided for Eskom debt to date be insufficient to the purpose of avoiding excessive price increases.
Increased charges (i.e. taxes) for electricity would continue to add to measured inflation as they have done to date. They will also, as they have done to date, tax away spending on almost everything else. Could the SA authorities, despite the state of the economy, not only raise taxes in the form of excessive charges for electricity but in addition also raise interest rates because of the impact higher electricity prices will have on inflation, and maybe therefore on inflation expected? Such responses are not apparently impossible to contemplate and so represent a most dangerous threat to the long term health of the economy.
The long term health of the economy and the willingness to invest in its long term potential will depend on the confidence investors and households will have in the ability of the authorities to manage the business cycle in a sensible way. They would spend and invest more now knowing that the path back to sustainable growth has been clearly marked out. Some of the signals received from the Treasury and the Reserve Bank about how to make the transition from the short to the long run do not always inspire confidence.
The global recession has led the monetary and fiscal authorities to usefully recall the advice Milton Friedman offered on how to deal with a banking crisis by the central bank acting as the lender of last resort (in his Monetary History of the US published in the late 1960s) and the instruction John Maynard Keynes provided on how to deal with depression with vigorous government spending (in his highly influential General Theory of Employment Interest and Money, published in 1936). Keynes was cynical about the human condition but it might be well for our authorities to be reminded in current circumstances of his celebrated remark that “in the long run we are all dead”.
The presentation of the Medium Term Budget Policy Statement in Parliament yesterday was unusually important for two reasons. It was the public baptism of the recently appointed Minister of Finance, Pravin Gordhan, who would be presenting the revised three year outlook for government spending and revenues in much changed economic circumstances.
The severity of the recession had made nonsense of the Government’s Revenue projections made in February this year. Gross tax revenues estimated for fiscal year 2009-10 have now been revised markedly lower by R70bn from the R659.3bn expected in February to R589bn, or from 26.6% to but 24.5% of a significantly lower expected GDP. Expenditures have been revised modestly upwards by about R16bn, so lifting the budget deficit from an estimated R95.6bn in February to the latest estimate of -R181.6bn and requiring additional, not previously planned, debt issues of R85.5bn. Government expenditures are now equivalent to an unhealthily large 35% of GDP. Unhealthy in normal circumstances but temporarily helpful in offsetting the sharp decline in private spending
The unknowns to be resolved yesterday were about style: how would the Minister present himself and be received, and about content, and how would the government address the much more difficult economic circumstances in its plans for revenue collection and spending?
Comfortably in command
On the question of appearance and reception the Minister was very well received. South Africa, one would suggest, has found a worthy successor to Trevor Manuel. The rookie Minister was comfortably in welcome command of his brief. Especially welcome since the content of his proposals and projections were eminently sensible and represented the continued commitment to fiscal conservatism of the SA government.
The immediate recessionary dangers facing the economy were well recognised – no pro cyclical increases in tax rates are proposed – and the extra borrowing requirement is to be wisely tolerated, given the strength of the balance sheet.
While, as was pointed out, the financial situation of the SA government has deteriorated more severely than almost anywhere else, the ratio of government debt can be allowed to increase from the currently low 23% of GDP to an estimated, much less comfortable 41% of GDP in 2012-13 when the economy will have recovered to a degree. The interest expense on the Budget will have risen by about R40bn or around R100bn a year. But importantly the plan thereafter is to reduce dependence on debt finance to reduce spending on interest and to restore the still highly valued balance sheet strength. This will allow spending on much more valuable other services to the hard pressed South African public. It should be appreciated that fiscal strains in the developed world will see government debt to GDP ratios rising above 100% within the next year or two – a much more difficult condition than that faced by South Africa.
A very conservative U-shaped recovery is predicted by the Treasury, though its forecasting credentials will not have been improved by the recent underestimates of economic activity. GDP is estimated to decline this year by 1.9% and to grow next year by only 1.5% and to then pick up to a still modest 3.2% rate of growth in 2012. Such an economic outlook, taken with the established and appropriately careful approach to issuing more debt, make for highly constrained plans for extra expenditure and revenue between now and fiscal year 2012/13.
The framework allows for government expenditure to grow at a compound average growth rate of 7.8% per annum and for revenues to grow faster, to partially close the deficit of 11.9% a year. The deficit is thus planned to decline from an estimated R183.8bn in 2009/10 to R131.5bn in 2012/13. Since inflation is expected to average around a still high 6% a year this will mean minimal growth in real government spending, though much faster growth in real government revenues is predicted.
The intention to reduce deficits and to contain real government expenditure is admirable. Whether such revenue estimates will prove consistent with macro-economic stability remains to be seen, especially if Eskom is allowed to tax the hard pressed consumer to the extent it has proposed. The Treasury has set its face against further debt issues by the central government and further guarantees of the debt issued by state enterprises including Eskom. Over R170bn of additional Eskom debt has already been guaranteed by the Treasury and we may hope that this will allow for electricity prices that make long run economic sense and do not damage the economy in its current fragile state. Perhaps in the strained circumstances actually selling off a power station or two, accompanied by an attractive enough price for the electricity to be fed to the grid, will seem like a good financial deal.
The strained financial conditions would also seem to have ruled out expensive health care innovations at least for the foreseeable future. They have also led to grave concerns about the size of and employment benefits of what has become an increasingly well paid government employee. The scope for further improvements in public sector conditions of employment are being recognised as very limited.
Hamlet without the Prince
The government in this Budget Review could not have been more frank about the large scale failures of its own administration and then the need to address its inability to service the community. To quote the Budget Statement: “The functioning of the public service requires fundamental reform to obtain better value for public money, to do more with less, and to build a culture of responsible stewardship so that citizens trust the institutions of service delivery…..”
Such self recognition is very welcome as a starting point to reforms that are essential to the purpose of a better South Africa. Also welcome is the recognition of the extreme gravity of the employment problem that is graphically illustrated in the Statement. South Africa’s ability to offer employment, that is to say its ability to absorb labour, appears weaker than almost anywhere else in the world with only 42% of the age group 15-64 in employment. To quote the government again, “creating jobs, particularly among millions of relatively unskilled South Africans, is the country’s greatest economic challenge….” A number of interesting innovations are proposed to this end, but a discussion of this issue without reference to the employment destructive role of unions – or how such employment objectives can be met without the essential services of labour brokers – is bit like Hamlet without the Prince.
Helpful to the goal of a stronger economy are the steps taken and intended that will enhance the flexibility of monetary policy. Also signalled by the Treasury was a more flexible approach to inflation targeting that took account of forces acting on inflation that was beyond the influence of monetary policy.
The significant exchange control reforms announced have been timed to counter an unwanted degree of rand strength. The Brazilians have imposed a tax on capital inflows to this purpose. More impressively South Africa has provided greater freedoms to move savings in and out. The currency market however did not react at all to the news – though the rand had responded earlier yesterday with weakness and again today to the downward pressure being exerted on emerging equity and commodity markets accompanied by the stronger US dollar. We show below how little reaction to the Budget statement made at 14h00 was observed in the currency market, while the market in RSA debt reacted favourably to the news.
R157 bond
Rand/US dollar
Graph sources: Bloomberg
Clear evidence that the government continues to budget conservatively and wisely under capable guidance is very welcome. Very welcome too is the recognition of its own failures to deliver services and employment opportunities as an essential starting point for reform. But the state of the economy remains very fragile and every effort will still have to be made to encourage domestic spending for the sake of incomes employment and government revenue.
By the end of this year, it will have been 20 years in which long dated bonds will have registered superior returns over equities in the US and South Africa. As may be seen in the tables below long dated government bonds have outperformed the equity index in the US and the RSA on both dimensions – they have provided significantly extra annual returns for less risk – as measured by the standard deviation of these returns.
Unexpectedly equities have failed to provide long term investors with a risk premium over long dated bonds. Equities and bonds have returned more than cash over the period though the competition from cash for equities in SA has been very strong over the past 20 years. Encouragingly all asset classes in both economies have provided in returns well ahead of inflation over the past 20 years. Especially so for SA investors (it was not as if equities performed poorly): in real terms they provided excellent average returns of over 5% pa. However, as may be seen, long dated bonds did even better for somewhat less risk.
Annual Returns Equities, bonds and cash calculated monthly 1990-2009
USA
Sample: 1990:01 2009:09
S&P 500
US 10 Y TBONDS
US SHORTS
US INFLATION
Mean
7.2
10.6
4.1
2.8
Median
11.1
12.9
4.7
2.8
Maximum
41.6
62.1
8.3
6.3
Minimum
-59.6
-30.4
0.3
-2.3
Std. Dev.
18.2
15.3
2.0
1.3
Observations
237.0
237.0
237.0
237.0
RSA
Sample: 1990:01 2009:09
JSE
SA LONG RSA
CASH
SA INFL
Mean
13.7
16.2
12.1
8.0
Median
14.8
18.7
11.7
7.7
Maximum
54.3
41.1
21.7
16.6
Minimum
-43.4
-18.8
6.8
0.1
Std. Dev.
19.2
12.2
3.4
3.9
Observations
237.0
237.0
237.0
237.0
Source: Investec Private Client Securities
The prices of long dated bonds generally rose over the 20 years as they benefited greatly from low inflation. Long dated interest rates fell back as less inflation was priced into their yields. Clearly the monetary and fiscal authorities consistently surprised the bond market in their ability to reduce inflation – and even more so in the US than in South Africa as we show below. Less inflation expected was good for equity returns and for the real returns from cash – but it turned out to be even better for investors in long dated bonds.
Fixed Interest yields 1990-2009
Source: Investec Private Client Securities
The caveat – past performance is not necessarily a guide to future performance – may be particularly apt when we contemplate expected returns from bonds, equities and cash over the next 20 years. Equities will always be valued to realise an expected premium for the extra risks associated with them. The yield on long dated bonds will always carry a premium to cover expected inflation. But as always, markets may be surprised or disappointed as evidence changes the temporary beliefs captured in current valuations giving rise to unexpectedly good or poor returns.
There is no guarantee that over the next 20 years inflationary expectations will be revised generally downwards as they have been over the past two decades. Given the much deteriorated recent state of government finances in the developed world, the temptation will have risen to print money to finance government expenditure – rather than cut expenditure or raise taxes and or pay market interest rates for funds borrowed. The share of government tax revenues that will have to go to pay interest rather than used for much more popular spending will be rising inexorably over the next few years at least.
Yet the bond markets in the developed world remain highly sanguine about the inflation outlook. The yields on US and other developed country bonds are currently offering inflation compensation of less than two per cent per annum on bonds maturing in 15 or more years, that is nominal bonds issued by Uncle Sam are currently offering near record low yields (about 3.5% pa) and less than two per cent more than the inflation linked bonds that would secure investors a real return over the long run. Currently these long dated inflation linkers also yield less than a two per cent per annum real yield. In SA the bond market is compensating for expected inflation by offering more than six per cent more on vanilla government bonds over their inflation linked equivalents.
We would regard the vanilla government bonds in the US as dangerously exposed to a revival of inflationary expectations. Accordingly holding inflation linked US government bonds seem like the superior alternative for now. By contrast in SA the higher yields on RSA vanilla bonds do now offer more attractive compensation for inflation to come. An average rate of inflation of over 6% per annum now priced into the bond market may well again prove overly pessimistic about the ability of the SA government to contain inflation in the years to come. Perhaps the history of declining bond yields in SA over much of the past twenty years should encourage SA investors to pay more respect to long dated bonds as an asset class.
The strength of the rand has astonished many. The rand is now more than strong enough to bring down inflation, which it is helping to do. The stronger rand and the downward pressure it has put on prices in the shops and showrooms is providing some encouragement to still very depressed domestic spending.
Further rand strength would not be very welcome. The gains made by consumers in the stores are at the expense of domestic manufacturers and their employees competing for shelf space. Their rand costs, especially their wage costs, are still rising while their pricing power in rands is under pressure from cheaper imports. It would greatly help if the trade unions moderated their wage demands accordingly, but such assistance has been sadly lacking and job losses continue as the manufacturers and miners attempt to reduce their costs to counter the pressure on their operating margins caused by the strong rand.
It needs to be appreciated just how strong the rand is; why it is so strong and what implications for economic policy should be drawn from it. The rand, as we show below, has not only gained against the weak US dollar and the not-so-weak euro, but has held its own against the growing strength of the emerging market and commodity currencies represented below by the Brazilian real (BRL) and the Australian dollar (AUD). We show this below and also that rand strength this month against the US dollar and euro is accompanied by strength in emerging market and commodity currencies, of which the rand is clearly one.
The rand in 2009, daily data
Source: I-Net Bridge and Investec Private Client Securities
The rand in October 2009 (Sept 30=100), daily data
Source: I-Net Bridge and Investec Private Client Securities
Why the rand is so strong
The most obvious explanation for rand strength is the hugely increased flows out of the dollar and to emerging market and commodity fund managers, of which SA receives a consistent share. Citibank analysts report very large net flows into emerging markets of US$45.5bn this year, of which US$4bn flowed in the past week up to 14 October 2009.
The JSE offers very convenient exposure to emerging and commodity markets for offshore fund managers. It is exposed much more to the state of the global economy than the SA economy, which given the depressed state of the SA economy, is just as well. The correlation between moves in the benchmark MSCI Emerging Market Index and that of the JSE when converted into US dollars is very close (about one to one) as we show below.
The JSE ALSI (USD) vs the MSCI EM (January 2009=100), daily data
Source: I-Net Bridge and Investec Private Client Securities
The JSE ALSI (USD) vs The MSCI EM, September to October 2009 (October 2009=100), daily data
Source: I-Net Bridge and Investec Private Client Securities
What it means to be a global market
This correlation shown above as indicated is no co-incidence. It is because JSE listed companies are fully exposed to the expected and improving trends in the global economy and especially the emerging market share of it, which is growing and is expected to grow at well above average rates. Hence the demands for shares in companies exposed to this promising growth found on the JSE.
How to capitalise on the opportunity presented by abundant capital
The question then is how best to take advantage of these inflows of capital that have brought with them rand strength. Or, to put it another way: what can and should be done to increase the demand for foreign exchange from SA, to perhaps hold back rand strength and in ways that will serve the economy and all those dependent on it?
Just grow faster and do all we can to encourage faster growth
The short answer is to use the opportunity presented by the abundant supplies of foreign capital behind rand strength to encourage the economy to grow much faster. The abundance of foreign capital and the strength of the rand scream out for faster SA growth. Faster growth might inhibit rand strength – though this is not certain given the influence of faster expected growth on the willingness to invest directly in SA. But even should faster growth not lead to a degree of accompanying rand weakness (due to the prospect of faster SA growth attracts more foreign direct investment), faster growth will surely be very welcome even if not accompanied by a degree of rand weakness.
Our call for policies to promote growth will not be surprising to our readers since we have been calling for such responses all year. We have called for urgent steps to be taken to revive household spending in the form of lower interest rates, accompanied by faster money supply growth: that is for quantitative easing to encourage the banks to lend more. The Reserve Bank therefore should be active in buying forex and by so doing adding cash to the system, and the extra cash should be accompanied by lower interest rates.
Perhaps one of the investments the Reserve Bank could usefully make with the dollars it buys in the market would be in foreign currency denominated RSA debt. This would improve both the government balance sheet and provide a very useful reserve for the time when SA government debt becomes less actively sought offshore
Encourage outward investment by institutional investors
The other steps to be taken to counter rand strength would be to encourage outward investment by SA fund managers. Listings of foreign companies on the JSE in which South African fund managers can invest freely – without limitation of foreign investment allowances – should get every encouragement. This is a very good time surely for the managers of SA retirement and pension funds to diversify some of the exposure to the SA economy of their clients. This will help build reserves in the form of offshore investments which can be drawn upon when circumstances in SA become less favourable. If such flows off shore help restrain rand strength for now, so much the better.
We have updated our indicator of the current state of the economy we call the Hard Number Index. It is based on hard numbers, namely vehicle sales and the Reserve Bank note issue adjusted for the Consumer Prices Index extrapolated for an extra month. The advantage in applying these hard numbers is that they are updated within a week of month end. All other published indicators of the state of the economy are as much as three or more months behind the times. Moreover the numbers that make up our very up-to-date Hard Number Index of Economic Conditions are actual accurate numbers not estimates based on sample surveys.
We have demonstrated that the Index tracks the business cycle represented by the coinciding business cycle indicator of the SA Reserve Bank very closely and the relationship has been an especially close one recently, as we show below. The Reserve Bank business cycle indicator however is only updated to June 2009 as is also shown.
Hard Number Index: Compared with the Reserve Bank Coinciding Business Cycle Indicator (2000=100)
Source: I-Net Bridge, SA Reserve Bank and Investec Private Client Securities
A closer inspection of the Hard Number Index and its annual rate of change (which should be regarded as the second derivative of the business cycle) indicate that the SA economy is now finally showing signs of a bottoming out. The Index itself, while still in decline, is now falling less rapidly. If present trends continue we can look to an actual increase in economic activity within the next month or two.
The Hard Number Index: The first and second derivates of economic activity
Source: I-Net Bridge, SA Reserve Bank and Investec Private Client Securities
A recovery despite further declines in the growth in Reserve Bank cash
This promised revival in economic activity owes little to the supplies of cash provided by the Reserve Bank to the system. No such assistance of the kind offered by many central banks has been made available to SA banks. The growth in the SA money base defined as the supply of notes issued by the Reserve Bank plus cash reserves banks held with the Reserve Bank, less required reserves, continues to slow down as we show below. But as we also show, the growth in the Real Money Base has stopped declining because the inflation rate has slowed down; and promises to slow further. Less inflation to come will add impetus to household spending in the months to come.
Real and nominal money supply growth
Source: I-Net Bridge, SA Reserve Bank and Investec Private Client Securities
The vehicle cycle has reached a deep bottom
Vehicle sales, having first turned negative in early 2007, now also appear to have bottomed out as we show below. What higher interest rates took away from vehicle sales, lower interest rates are very slowing adding something back, though if recent trends are to be extrapolated until year end 2010 the revival in sales will be a modest one (See below).
New Vehicle sales
Source: I-Net Bridge, SA Reserve Bank and Investec Private Client Securities
The sources of recovery are to be found outside of the Reserve Bank
The long awaited recovery in the SA economy will have little to thank monetary policy for, especially if the impulse of monetary policy is measured by the growth in money supply or bank credit rather than policy determined interest rates themselves. These have declined by 500bps since December 2008 but as yet lower interest rates, in the absence of quantitative easing, have not revived bank lending or the money supply. The economy has suffered a deep recession and the recovery prospects are for at best a slow recovery.
The recovery will be encouraged by the confidence that comes with the knowledge that the global credit crisis is over and the global economy is recovering. Relief of this kind also percolates through to SA business and their investment decisions while also encouraging the foreign demand for goods and services from SA. The improved global tolerance for risk has boosted values on emerging equity markets and the JSE, realising positive wealth effects. By boosting the value of the rand these improving trends have also helped lower inflation in SA and will continue to do so. We can look to lower inflation to boost the real money supply even if the Reserve Bank, unfortunately in our opinion, continues to resist doing so.
A most interesting article in the latest Barron’s by Michael Santoli (Leaving With the One Who Brought You, Barron’s Online, Monday 12 October) points to the opportunities and pitfalls provided by a highly receptive market for high grade corporate paper. Santoli observes:
Any CFO of a high-investment-grade large company who reaches for a phone to call his or her banker in the morning will have multiple hundred millions of cheap, no-strings debt financing offered up by bond-fund managers before happy hour. Or so it seems. Companies that really don’t need the money can – and are – selling bonds at will.
While the bond market is highly solicitous of new paper the share market can be very critical of the purposes to which this newly found balance sheet strength is being put.
To quote Santoli:
In the recent wavelet of M&A action, a particular sort of corporate transaction has been applauded. To specify: When large, self-financing, market-leading companies have deployed their balance sheets to opportunistically grab for unique and easily digested assets, investors have celebrated.
Moving from the warmth of the market’s hearth to its chilly woodshed, we can find the would-be acquirers swiftly punished by investors for the transgression of bidding generously for a business in an adjacent market and, in so doing, negating the reasons so many shareholders owned the shares in the first place.
Recent deals that have earned the strong disapproval of the market referred to were the moves made by Kraft Foods and Xerox, for Cadbury and Affiliated Computer Services respectively.
As Santoli opines: “In both cases, a shareholder base that owned the buyers’ stocks for their steady, cash-flow-generating attributes woke up in alarm as management opted to pay large premiums for companies that the shareholders could themselves have owned more cheaply the prior day, and whose integration might not be effortless.”
In other words shareholders have been rudely reminded that they do not control the free cash flow generated by the companies they invest in. These cash flows remain largely at the mercy of management who have their own interests to pursue that are not necessarily consistent with the interests of shareholders.
This reminds us of M&A activity on the JSE and in particular the attempt by MTN to buy a big chunk of Bharti, which was frustrated by regulatory issues. The deal falls decidedly into the category of free cash flows at risk. MTN is a company with a strong balance sheet and one presumably easily able to issue more debt. Its free cash flow from its current operations is growing rapidly and is expected to increase from an estimated R8.6bn at 2009 year end to over R16bn at year end 2011 (by Jonathan Kennedy Good of Investec Securities).
This improvement in free cash flow, absent of acquisitions, is estimated despite an ambitious accelerated programme of capital expenditure over the next few years designed to roll out its network in under serviced Nigeria and Iran. Capital expenditure would then be expected to taper off in the absence of acquisitions or, less likely, to till large new green fields for voice or data transmission.
It should be fully appreciated that MTN in its dealings with Bharti was decidedly on the trail of the utilisation of cash and borrowing facilities. While MTN planned to issue more equity to Bharti (issues of approximately R59bn of equity was proposed) MTN had additionally committed to pay cash of some US$2.9bn (approximately R22bn) for its stake in Bharti. Clearly additional MTN debt would have had to have been issued to this purpose and we understand negotiations had been entered into with banks to this purpose. Bharti, in its turn, proposed to exchange newly issued shares as well as cash with MTN shareholders for part of their stake in MTN.
Presumably shareholders in MTN are not surprised by MTN’s appetite for acquisitions, especially in the light of much improved credit market conditions. Shareholders in MTN would have even less reason than those of Kraft or Xerox for believing that the cash flows that emerge from maturing operations will increasingly flow their way.
The big issue for shareholders in MTN is not whether or not they will control the free cash flow emanating from MTN, but rather how much return on capital they should expect from management exercising their ambitions. Will the assets they buy prove “opportunistically cheap and easily integrated” or will MTN overpay “for businesses in adjacent markets that shareholders could access cheaply on their own”.
MTN’s great value added for its shareholders by rolling out operations in South Africa, Nigeria and Iran could be regarded as of the first kind of investment. But the scope to exploit virgin telecom territory is increasingly limited. The Investcon acquisition, an investment in adjacent markets, might well be regarded as value destroying, judging by the returns so far realised on the extra capital employed.
Shareholders in MTN should seek good answers to this question of prospective return on debt and equity capital when MTN management comes around again, as they are most likely to do, to seek approval for an acquisition that would commit a large proportion of the potential cash flows from operations. Strong balance sheets that comfort debt holders are always a powerful temptation for managers – they allow managers to raise and invest capital both internally and externally derived – with often unfortunate consequences for shareholders.
Growth in earning that comes with the expectation of improved returns on capital at risk is the magic that drives share prices higher. Growth in earnings that promises to reduce the return on shareholders capital below its opportunity cost clearly punishes the value of a company to its shareholders, though not necessarily its managers.
MTN has made great value adding investments that shareholders have applauded. MTN may well be embarking on a growth course through acquisition that will realise below cost of capital rewards. This fear is presumably holding back its share price.
The MTN’s share price does not appear to carry any optimistic forecasts of improved flows of cash to shareholders. What would happily surprise the market would be an indication that MTN would not be making major acquisitions, and or that it intends to be much more demanding of a high return on capital from any acquisition it might make – including that of Bharti shares.
Ideally for shareholders, MTN would announce it is no longer interested in acquiring other established telecom companies and that it intends to focus entirely on realising the organic growth or green field opportunities that still present themselves. Then shareholders could anticipate a very healthy flow of cash over the next few years that they could hope to deploy in cost of capital beating ways should MTN be unable to do so.
The gold price is at record levels when measured in US dollars. When measured in the mighty rand it is however well below its record levels of November 2008. Part of the strength of gold is the weakness of the US dollar.
The gold price in US dollar and rands; Daily data
Source: I-Net Bridge and Investec Private Client Securities
But gold lately is not exceptional
In recent months the gold price in US dollars has not behaved exceptionally: it has closely tracked commodity prices in general as the dollar weakened and the signs of a global economic recovery were read (See below).
Gold Price vs All Commodity Prices CRB Index (January 2009=100), Daily data
Source: I-Net Bridge and Investec Private Client Securities
Gold was very special a year ago
Gold was special when the credit crisis reached its apogee with the failure of Lehmans in September 2008, when it showed admirable defensive qualities and performed very much as a safe haven.
Gold vs Commodity prices 2008-2009 (Jan 2009=100), Daily data
Source: I-Net Bridge and Investec Private Client Securities
History tells us that gold, that barbarous relic (as Keynes described it with characteristic intellectual scorn), is more than just another commodity – it has always been a special store of value and is especially useful when the value of all other assets is threatened by war or financial crises, as has again been proved.
It took very special events to prove that gold is special
But as we show below, a sharp divergence between the trend in gold and other commodity prices, as occurred between September 2008 and March 2009, has been a unique occurrence over the past 30 years. It took the fear of a melt down of the banking and credit system to lead to a rush to gold and a liquidation of other commodities. Mere inflation fears, if that were the driver, would be common to precious and ordinary metals and minerals.
The gold price and the commodity price index (CRB) (Jan 2009=100), month-end data
Source: I-Net Bridge and Investec Private Client Securities
In ordinary times gold is very likely to behave in line with other metals and minerals
The state of the global economy and the balance between the real demand and supply of commodities will be a primary driver of real (after adjusting for inflation) commodity prices. However all asset prices, including especially hard assets in the form of gold and other metals and minerals that can easily be stored, are influenced by inflationary expectations, or more particularly by the prices of these commodities that are expected to prevail in the months and years ahead.
The cost of storing gold and metals is very important for speculators
These price expectations have to be compared with the cost of storing metals and minerals which in the case of precious metals largely comes in the form of financing costs. The cost of storing precious metals – unlike the cases of copper, coal, iron ore or even oil – is almost all financing costs, given the high value to size ratio that determines the cost of storage.
Financing costs rise with inflation too
Financing costs, that is interest rates, however also rise with more inflation expected, so increasing the costs of storage and discouraging the demand to hold commodities. Thus there has to be more to a rising price of gold and other commodity prices than inflationary expectations. The price of gold, to make it worth buying at current spot prices, has to be expected to rise faster than the costs of owning gold in the form of interest rates paid or foregone. Or in other words, the price in the future must be expected to rise faster than the costs of financing that is explicit in the ratio of the spot and future price of gold.
It is real interest rates, not inflationary expectations, that matter
Thus a key determinant of the current price of gold will be the relationship between inflationary expectations and interest rates – that is to say real interest rates. Real interest rates have fallen to very low levels in recent years and months. They are at half the levels prevailing in the early years of this century. These real rates are best measured explicitly in the yields on offer from government bonds that come with complete cover against inflation – the inflation linkers – known as TIPS in the US, for Treasury Inflation Protected Securities (See below).
The purchasing power of the fixed coupon payments to be made to the owner of a conventional bond will be fully diluted by inflation. Thus inflation exposed bonds have to offer compensation for expected inflation. Thus the yield gap between the lower yield on inflation linkers and the higher yields on long dated conventional bonds is explicitly the compensation on offer for bearing inflation risk.
The bond market is very complacent about inflation to come
This compensation currently on offer to the holder of a 30 year US Treasury Bond is but an extra 2% pa. Thus it may be said that investors in 30 year bonds are highly vulnerable to losses should inflation in the US average more than 2% pa over the next 30 years – that is to say there is very little inflation expected or little cover against higher inflation currently on offer in the conventional government bond market as we also show below. Thus there is very little inflation expected in the bond market where the fear of deflation rather than inflation is dominant. That the idea that the gold price is being driven by inflationary expectations that are absent in the bond market, does not seem at all consistent.
US government bond yields and inflation compensation, month-end data
Source: Federal Reserve Bank of St. Louis, I-Net Bridge and Investec Private Client Securities
A consistent explanation for the rising gold and other metal prices
It would be far more consistent to conclude that the gold price, as with other commodity prices, is being driven by a global recovery and low real interest rates, that is abnormally low costs of storing gold and other commodities. The evidence in the relationship between the gold price and real interest rates in the US, represented by the yield on 30 year US TIPS is very supportive of this explanation. The gold price rose consistently with the equally persistent decline in real interest rates after 2000. It may also be seen that the gold price fell away as real yields rose temporarily as deflation fears gripped the markets in 2008 and then recovered as real interest rates fell back again.
Real interest rates and the Gold price 2000-2009; Month end data
Source: Federal Reserve Bank of St. Louis, I-Net Bridge and Investec Private Client Securities
A better case for gold in portfolios
The case for gold cannot be based on inflationary expectations alone. If inflation rises unexpectedly, interest rates and so the financing costs in owning gold will also rise, taking the gloss off gold and other metals. Thus it will take lower real rates – or interest rates lagging well behind actual inflation – to drive the price of gold and other metal prices higher. Unexpectedly strong global growth especially when coupled with relatively low real interest rates will be especially helpful to the gold price as it will be to all commodity prices. Gold may not prove special in a world of rising commodity prices as real demand presses against real supplies but yet well worth holding.
The case for an insurance premium for gold
But the recent evidence that gold can still provide insurance against calamity is surely reason to keep more gold in portfolios than before as insurance against true calamity. The experience of the defensive quality of gold in 2008 when gold held up while the price of all other metals fell away could add to its long term attractions so adding a little special lustre compared to the more prosaic other metals. Global portfolios still contain but a sliver of gold – should portfolio managers decide that a little gold may provide useful insurance as it did in 2008 – the gold price could move permanently higher relative to other metals and minerals and maintain such a premium. Brian Kantor
We remain optimistic about equities generally, yet we do not expect JSE Resources to out- or under -perform the market generally.
JSE performance is often in the mix of resources vs other sectors
South African managers of balanced equity funds usually stand or fall by their judgments about the mix of resources, industrial or financial stocks in their portfolios. Resources can out or under perform by large orders of magnitudes as we show below.
JSE Resources Vs Industrials vs Financials (18 Sept 2008=100)
Source: I-Net Bridge and Investec Private Client Securities
Extreme relative moves were experienced in 2007-2008
Fifteen months ago, by mid 2008 when compared with a year before, the JSE Resource Index had outperformed the Financial Index of the JSE as much as 60% and had gained 40% on Industrials. Within a few short months, when the credit crisis was at its height and commodity prices collapsed, Resources had fallen more than twice as far as Industrials or Financials.
The JSE sectors have moved in line over the past twelve months
Over the past twelve months after the fall and with the strong recovery from March 2009 in commodity prices and emerging equity markets, all the major sub sectors of the JSE have performed more or less in line. The annual return on JSE Financials and Industrials have been about five per cent ahead of Resources and all sectors have moved into positive annual return territory.
Resources/Industrials and Resources/Financials (Sept 2008=100)
Source: I-Net Bridge and Investec Private Client Securities
What matters for relative and absolute JSE performance is not rand strength or weakness – but the causes of rand strength or weakness
The key to the out- or under-performance of the Resource sector is not simply, as many would be inclined to suggest, simply rand weakness or rand strength. Rand weakness will only be especially helpful to Resources and harmful to Financials and Industrials if the cause of rand weakness is South African specific. For example if some SA political development causes investors both locally and abroad to raise their risks of doing business in South Africa causing an outflow of funds and rand weakness, Resources will do better than Financials or Industrials. Vice versa if an improvement in sentiment causes the rand to strengthen, when the rand plays will outperform the rand hedges.
Mid 2006 to mid 2008 was an ideal time to be exposed to JSE resources
A combination of the kind of rand weakness experienced in 2006-08 coupled with stronger commodity markets represents ideal circumstances for JSE resource valuations. We show in the figure below how the rand weakened against the Aussie dollar (another commodity currency) in 2006-07 despite commodity price strength; and so Resources performed well absolutely and in a relative sense, outperforming handsomely the other JSE sectors. We also show how the rand recovered some of its losses and has held its own against the Aussie dollar over the past 15 months. Resource valuations came under particular pressure from the combination of weaker commodity prices and a relatively stable rand.
JSE Resources/Industrials, Commodity Price Index and the ZAR/AUD (Sept 2008=100)
Source: I-Net Bridge and Investec Private Client Securities
Rand strength for fundamental reasons is good for the JSE, but not especially good or bad for JSE Resources
When the source of rand strength or weakness is to be found outside South Africa, in the form of global economic strength which leads to stronger global commodity and emerging equity markets, there will be no reason to expect resources to out- or under-perform other sectors of the JSE. This has been the case recently. The rand has strengthened because of the recovery of the global economy led by emerging economies. The rand is stronger because of much firmer emerging equity and commodity markets.
The recent strength in commodity prices has been helpful for Resource company valuations on the JSE as well as those of the rand hedges (companies with a substantial part of their business outside South Africa). The strength in commodity and emerging equity markets has simultaneously boosted the rand and so the South African economy plays listed on the JSE have kept pace with the JSE generally.
The case for increasing exposure to the JSE equities at the expense of bonds must be based on a belief in rand strength for global reasons. What is good for the rand in the global economy will be good for the JSE, resources included. Rand weakness for global and SA specific reasons would be a reason for seeking less exposure to equities generally even though resources are likely to suffer less than average damage in such unhappy circumstances.
Our view is that the recovery in the global economy will continue to be helpful to JSE equities and the rand and so there are no SA specific reasons for strongly preferring resources over the other sectors or for reducing exposure to them. While continuing to overweight equities we would continue to recommend a broadly neutral mix of Resources, Industrials and Financials.
Brian Kantor, Professor Emeritus, University of Cape Town, Investment Strategist, Investec Private Client Securities.
and
Chris Holdsworth – Analyst, Investec Securities
Abstract
This study demonstrates with the aid of single equation regression analysis the role global capital markets play in determining the behaviour of the Johannesburg Stock Exchange (JSE ALSI) the Rand/ US dollar exchange rate (ZAR) and long term interest rates in South Africa on a daily basis represented by the All Bond Index (ALBI) or long term government bond yields represented by the R157. It will be shown that since 2005 the state of global equity markets, represented in the study by the MSCI Emerging Market Index (EM) has had a very powerful influence on the JSE. The EM Index is shown to have had a less powerful yet statistically significant influence on the ZAR while it is also demonstrated and that conditions in global capital markets, and the ZAR have had some weak but statistically significant influence on the direction of long term interest rates in South Africa. It will be demonstrated that movements in policy influenced short term interest rates, have had very little predictable influence on share prices, the ZAR or long term bond yields. The causes as well as the consequences of the ineffectiveness of policy determined interest rates for monetary policy are further analyse.
Introduction
This study demonstrates the role global capital markets play in determining the behaviour of the Johannesburg Stock Exchange (JSE ALSI) the Rand US dollar exchange rate (ZAR) and long term interest rates in South Africa on a daily basis represented by the All Bond Index (ALBI) or long term government bond yields represented by the R157. It will be shown that since 2005 the state of global equity markets, represented in the study by the MSCI Emerging Market Index (EM) has had a very powerful influence on the JSE.
The EM Index is shown to have had a less powerful yet statistically significant influence on the ZAR while it is also demonstrated and that conditions in global capital markets, and the ZAR have had some weak but statistically significant influence on the direction of long term interest rates in South Africa. It will be demonstrated that movements in policy influenced short term interest rates, represented by daily changes in expected short term interest rates, represented by daily movements in the implicit JIBAR 3 month forward rate (Jib3f3) have had very little predictable influence on share prices, the ZAR or long term bond yields.
The MSCI EM Index may be regarded as a proxy for conditions in global capital markets that affect South Africa. JSE listed shares are included in the EM Index with a current weight of about 7%. The more abundant the capital available for emerging market capital raisers, that is to say the less risk aversion prevailing, the higher would be the level of the EM Index – and vice versa.
Changes in the forward JIBAR rate are used as our proxy for short term interest rates on the presumption that it is interest rates expected, rather than current actual interest rates that drive the value of shares, bonds and currencies and that therefore changes in expected short term rates rather than changes in actual rates- that may well have been anticipated – have significance for the financial markets.[1]
Exchange rates inflation and the implications for monetary policy
The implications of this finding for monetary policy are surely serious ones. It would strongly suggest that policy determined adjustments to short term interest rates, when unexpected, will not influence the exchange rate in any consistent way. If so adjustments to short term interest rates cannot be regarded as a reliable anti-inflationary tool, given the influence exchange rates have on measured inflation rates in SA. The feed back effect of the exchange rate on import export and domestic prices is clearly a very important influence on the measured rate of inflation
The case for interest rate changes as the principle instrument of monetary policy is furthermore not enhanced by the evidence that short term interest rates have not had any consistently important influence on the direction of long term interest rates in South Africa nor on the direction of share prices and therefore on these components of household wealth. However it would seem to be the case that movements in actual short term interest rates can have a significant influence on aggregate demand in South Africa and perhaps also on house prices without necessarily reducing inflation rates. These relationships between interest rates and aggregate demand are not tested here.
Estimation procedures
This study utilises daily data to model and estimate the behaviour of the JSE ALSI the rand/USD exchange rate and the RSA All Bond Index bond index or long dated RSA bond yields (between January 1st 2005 and August 31st 2009. The models using daily data are supplemented with similar models utilising month end data from the mid nineteen nineties to help confirm the strength of the hypotheses tested and to test for structural changes in the economy.
The models are single equation models of daily or monthly percentage movements in the ALSI, the ZAR and the ALBI or as an alternative to the ALBI of daily changes in long term interest rates represented by the long dated RSA 157. The estimation method applied is single equation least squares regression analysis.[2]
The data – represented in figures
The dependent and independent variables of the models are pictured below in level and daily percentage change form. It may be seen that daily changes in all the dependent and independent variables are highly random and that prices, exchange and interest rates they have drifted both higher and lower since 2005. It is also shown below how much more generally volatile share and bond prices and interest rates became during the financial crisis that reached its apogee in September 2008 with the collapse of the large investment bank Lehman Bros. We have measured the volatility of the variables in the form of a 30 day moving average of their Standard Deviations and present this information in graphical form. We demonstrate how similar has been the behaviour of volatility on the different markets. That risks appear so similar in the different markets is further evidence of the globalisation of capital markets. We show that the increased volatility did not materially influence the estimates of the coefficients of the models
Fig1. The JSE All Share Index Daily Levels and % changes 2005 – Aug 2009
Fig2. The ZAR Daily levels and % changes 2005 – Aug 2009
Fig3. The SA All Bond Total Return Index Daily levels and daily % changes data 2005-Aug 2009
We compare in figure 4 below the performance of the rand to both the USD and the AUD to indicate that the rand while holding its own against the weaker US dollar in 2006-07 lost significant ground against what may be considered other commodity and emerging market currencies.
Fig4. The rand Vs the USD and the AUD Daily data (Jan 1st 2009=100)
The independent variables
The explanatory variables considered for inclusion in the models comprise (surprising) daily or monthly movements in forward short term interest rates (JIB3f3) and daily or monthly percentage changes in the MSCI Emerging markets equity index (EM) or in the S&P 500 Index to represent share prices in New York, As shown below the correlation between daily moves in the EM and S&P 500 is very high and other than reporting this correlations with the S&P 500 we did not apply the S&P 500 in the models. Also considered and applied in the various models were percentage movements in global commodity prices in USD, represented by the commodity price index of the Commodity Research Bureau (CRB) and percentage moves in Australian/USD exchange rate (AUD) or (AUS$). The additional explanatory variable applied in the models were changes in US long dated 10 year treasury Bonds.
Fig.5 Emerging equity markets (MSCI EM) and the S&P 500; Daily levels and daily % movement 2005-2009
Fig.6 Expected short term interest rates (Jibar 3 month implicit forward rate) Daily levels and daily changes
Fig7. Commodity Prices and US TB yields. Levels and Daily or daily % changes
Fig8. The Australian/USD exchange rate Daily Levels and % changes. 2005-2009
Representing volatility in graphic form
Fig 9. Volatility of Share and commodity markets. 30 day moving average of the Standard Deviation (SD) of daily % movements
Fig 10. Exchange rate volatilities; 30 day moving average of the Standard Deviation (SD) of daily % movements
We show below the measures of implied option price volatility on the S&P represented by the Vix Index and on the JSE represented by the SAVI
Fig11. Implied volatility – The Vix (on the S&P) and Savi on the JSE Daily data 2005-2009
Volatility and share prices
The increase in the volatility of share prices globally, including on the JSE, that provide indicators of the risks in the markets appears to have had a very negative impact on share prices. The negative correlation between daily percentage moves in the Index of Implied Volatility on the S&P 500, the Vix and daily moves in the S&P 500 itself has been a high negative (-0.76) and between daily moves on the JSE and the SAVI an almost equally negative (-0.73) since May 2005. (See Table 1 below)
Statistics for the SAVI, the implied options price volatility indicator of the JSE, are only available since then. It is surely volatility that drives the share market up and down. It is a much more difficult task to explain and predict volatility. Volatility in share markets may be regarded as abnormally high before 2007 when the global glut of capital was holding down interest rates and encouraging risk tolerance. The financial crisis as we well know reversed all this and produced much higher degrees of risk aversion and volatility as the likelihood of defaults and bankruptcies increased so dramatically, especially after the failure of Lehman Bros.
Table 1. Correlation statistics of daily % changes in volatility indicators with the Share Markets (May 2005- August 2009)
Correlation Statistics and their interpretation
In the tables 2 and 3 below we present correlation statistics for the daily percentage movements in the dependent and independent variables of our models. The correlation statistics that we regard as of particular interest are highlighted in red. The correlation statistics provided a foundation for the model building exercises to be fully reported upon below.
It should be appreciated that these correlations apply to prices, interest and exchange rates at market closing. The different markets however do not share the same closing times. Thus relevant information and the price movements that respond to the “news” can occur after one or the other market is closed and are then only reflected when the closed market opens up again. Were the data collected at the point in time when all the markets were simultaneously open the correlations measured would undoubtedly be higher ones
Table 2. Correlation of daily movements. The dependent variables Shares, Bonds and the ZAR with short term interest rates
Table 3. Correlation of daily movements of the independent variables.
To be noticed are the high correlation between daily moves in the JSE ALSI measured in rands and the EM measured in USD (0.73) The correlation of the JSE with the CRB also measured in USD is lower but significantly positive (0.39) Daily movements in the JSE and the ZAR have been negatively correlated (-0.33) indicating that rand strength rather than rand weakness has been generally helpful to the JSE.
Also to be noted is the very low almost zero correlation of daily moves in the JSE with changes in forward short term interest rates (- 0.07) The correlation of movements in the share and all bond indexes is a low but correctly signed (0.19) The correlation between movements in the EM Index and the ALBI Index (0.27) should also be recognised as a further influence of global capital markets on long term interest rates in SA. Lower or higher interest rates would not appear to have been generally either helpful or harmful to the JSE over this period.
The high correlation between the AUD and the JSE does not have any obvious theoretical explanation and this must be attributed to the high correlation between the AUD with the EM Index (-0.64) shown in the following table. Clearly the global economic forces that drive the EM higher or lower strengthen or weaken the AUD/USD.
It should be noticed that the returns on the ALBI the All Bond Index (the higher the index the lower are interest rates) have been negatively correlated with the moves in the ZAR(-0.34). That is a weaker rand is associated with higher long term rates- presumably because a weaker rand is associated with more inflation to come.
Of further interest is that bond market returns have been only weekly correlated with movements in short rates (-0.16). The correlation, not reported in the tables, between long dated R157 yields and these short rates is a very similar (0.16). The movements in the ALBI Index and R157 yields are very highly negatively correlated as would have been predicted. The correlation of daily returns in the ALBI and daily changes in the R157 (not reported in the tables above) has been (-0.98) over the period.
The high correlations over (0.50) between movements in the ZAR and the global equity markets should be noted as should the positive correlation between moves in the ZAR and the CRB and AUD. He rand has behaved as an emerging equity market and commodity currency. The weak, near zero correlation, between the ZAR and short term interest rates should be worthy of particular notice (.06). The final column of low correlations between short term interest rates and the equity bond and currency markets indicates how little short term interest rate moves seem to matter for the share, bond and currency markets.
The Regression Results and their interpretation
The regression equations reported in the tables below indicate that we are able to find very good estimates for daily moves in the JSE relying on the strength of the EM effect. We back up the models of daily movements in the JSE with models of monthly movements that go back further. These monthly models confirm the growing influence of emerging equity markets on the JSE since 2003.
Table 4 Regression Output
image025
image024
image026
image023
image028
image027
Commentary on regression equations 1- 15
The dominance of the Emerging Market effect on the ALSI is confirmed by the regression equations 1-4. The EM coefficients take values close to 0.70 in all the specifications tested. The influence of the CRB is statistically significant in all the models of the ALSI but is of lesser influence with coefficients that take values of the lesser order of 0.10. In equations 1-4 the returns of the ALSI are measured in rands while the returns of the emerging market index are measured in USD. If the currency had no effect beyond its translation, one would expect the rand beta to have a value of 1. The low rand coefficient (even after adjusting for multicollinearity through orthogonalisation) implies that that the rand has had an independent influence on the share market. For any rand weakness the market has on average increased by less than the rand has weakened. This implies that rand weakness leads to a lower rand value for of the ALSI and similarly a stronger rand leads to a higher rand value for the ALSI. The graphs of the variables revealed an increase in volatility towards the end of the period and after the credit crisis had reached its most serious condition in September 2008. The equations were tested for such volatility clustering in the form of a GARCH process. An examination of the squared residuals reveals a GARCH(1,1) process in the error terms. Including terms for the GARCH process had a minimal influence on the value of the coefficients.
An out of sample test of the ALSI model 1 for the period July 1st to August 31st 2009 estimated over the 1 year period from June 2008 to June 2009 reveals that nearly all of the recent volatility in the ALSI can be explained by the returns in the ALSI, the ZAR and commodity prices. The out of sample exercise is demonstrated in figure 12. The daily average absolute difference between the realised changes in the ALSI, dlog (ALSI) and the changes predicted by the model outside of the sample period was a minimal 0.34 percent.
Including a term for the change in expected short rates to equation (1) only marginally increases the R2 of this equation implying that either the information in short term expectations has already been accounted for (through the rand) or that short term rates are not important for the market as a whole. In equation 6 below we show the weak relationship between short rates and the rand, implying that short rates have little explanatory power for the share market as a whole.
Adding the yield to maturity of 10 year US government bonds to the ALSI models above provides a negligible increase in the R2, justifying its absence from model 1.
Given the problems with daily data (misaligned closing prices amongst others) we examined the influence of the variables above on a monthly basis over the extended period 1995- 2009. It should be noticed that the EM coefficient is very similar to that of the daily model with a value of 0.72. The rand coefficient is however much higher than in the daily model. The model was tested for a structural break in the coefficients in January 2003. The Chow test indicates a significant break in the structure. The test result very strongly rejects the null hypothesis of parameter stability. The break should be attributed to a changing relationship of the JSE with the rand rather than with the Emerging equity Markets. The rand coefficient in the monthly model is very different to that of the daily model while the EM coefficient retains its value.
Modelling the innovations in the ZAR
The short term innovations in the rand can be reasoned to be driven by emerging markets, commodity prices and interest rates. All of these terms are significant. It is interesting to note that the R2 of this relationship is much lower than that of the ALSI, implying greater noise (or the impact of missing variables).
It is important to confirm that the changes in short rates do not appear to have a consistent impact on the currency. The implication is that the link between the currency and interest rates happens at the long end of the yield curve, rather than the short. The low coefficient is not the result of mutlicollinearity; the correlation between changes in short and long end of the yield curve is fairly low.
The currency model can be reduced without adverse effects on the explanatory power The incremental explanation of interest rates once emerging markets, commodity prices and the Australian Dollar have been accounted for is minimal.
An out of sample test reveals that the recent moves of the currency can be nearly fully explained by the changes in EMs, commodity prices and the difference in nominal rates between the US and SA. (See figure 13 ) The absolute average error was 0.7 percent per day. The simple correlation statistics between the actual and predicted values out of sample was 0.56 over this period
Given the problems with daily data (misaligned closing prices amongst others) we examined the influence of the variables above on a monthly basis over the extended period 1995- 2009. It should be noticed that the EM coefficient takes a value of (-0.18) compared to the more negative values of the daily models. The EM coefficient retains its statistical significance in the monthly model.
A longer time period is not necessarily advantageous given the possibility of a structural change in the economy. The changing character of the rand linked to the increased demand for and supply of foreign capital after 2003 (see figure 14 below) led us to test if there was a breakpoint in the coefficients of equation 9 at the beginning of 2003 using a Chow breakpoint test. The test result very strongly rejects the null hypothesis of parameter stability. Re-estimation of the model since 2003 using daily data highlights the greater influence of emerging markets on the rand. In the case of the monthly model of the ZAR we substituted surprising changes in the NCD rates for the JIBAR rates. The two series are very highly correlated.
The variations of the ALBI are more difficult to explain than both the rand and the ALSI. While the emerging equity markets, the rand, short term rates and US rates clearly are important drivers the very low R2 is suggestive of other drivers of bond yields – including expected inflation.
Modelling the variation in long rates as aside from the ALBI results in a similarly low R2.
It appears that the low R2 in 12 can be partly attributable to the frequency of the data. Sampling at a monthly frequency (and increasing the sample period) results in a much improved R2.
The bond market however was also affected by the structural break mentioned in 10. A Chow test reveals a significant break in Jan 2003.
Fig 12. Daily move in ALSI (d log ALSI) Out of sample forecast 1st July 2009- 31st August 2009.
Fig13. ZAR – out of sample actual and predicted values
Further concluding comment on the regression results
Our models of the JSE ALSI may be regarded as very satisfactory with explanations of daily moves with the EM again providing the major impetus for the rand. Our models of monthly movements in the ZAR indicate that the EM influence has also become stronger providing for much better fits for the models in recent years. The goodness of fit of the bond market model is poor though the influence of short term interest rate surprises on long term rates, while of small impact, is statistically significant. The influence of US bond yields on RSA yields is also small but also of statistical significance.
The global flows of capital that move the EM equity index higher or lower also move the SA bond market higher or lower. However the coefficients of these models of the RSA bond market while statistically significant do not provide any thing like a full explanation of movements in long term interest rates in SA. Clearly other forces – especially inflationary expectations are at work in the bond market.
Conclusion;Identifying structural change in SA and drawing the implications for monetary policy
Figure 14. The Current account deficit and capital inflows 1990-2008
It must be asked why the global capital markets have become much more important for the JSE and the ZAR in recent years. The answer must lie in the structural change that occurred in South Africa after 2003 as growth in household consumption spending picked up strongly to drive the growth rates higher. This faster sustained growth was made possible by attracting foreign capital on a scale not earlier available to South Africa- at least not since the early eighties as we show in figure 14 below.
The ability to attract capital to finance growth in SA needs to be fully taken account of when setting interest rates that influence the level of demand in the economy even though they do not have an obvious influence on inflation. The feed back loop from faster growth to more foreign capital provided needs to be well understood and nurtured by the monetary authorities. It offers the rare opportunity to achieve faster growth with less rather than more inflation.
Higher short term interest rates in SA may attract capital through the attractions of a higher carry. They appear just as likely to frighten capital away if higher interest rates are assumed to threaten the growth prospects of the economy. If so higher policy determined interest rates are as likely to bring a weaker rand and more inflation than the opposite. Higher interest rates are however very likely to slow down growth. The instrument of short term interest used to manage inflation in SA appears to have been particularly blunt and potentially dangerous to the health of the economy as they appear to have been lately.
Global share markets have been running hard and in synch this quarter and especially this month as we show below. There is a natural inclination to think that this is all too much too soon and a lightening of equity exposures is called for. The lead steer of the global herd is clearly the S&P 500. Where New York goes other markets follow. However the S&P 500 is much more than a play on the US economy – about 40% of S&P 500 revenues and earnings come form outside the US (just as the JSE ALSI is much more than play on the SA economy). Stock markets list global companies whose fortunes and valuations depend upon the global economy.
The JSE EM and S&P 500 1 July 2009=100
Source: I-Net Bridge and Investec Private Securities
Fundamental analysis of the relationship between dividend yields on the S&P 500 and US Treasury bond yields indicates that the S&P 500 is far from being exuberantly valued. The indication is that the market has moved higher from a position of extreme undervaluation of dividends relative to long term interest rates to less undervalued, but still significantly undervalued.
In the figure below we show the output of a regression equation that explains the level of the S&P 500 with dividends declared (a positive influence on valuations and US T bond yields, though a negative influence normally). The current dividend yield on the S&P 500 is a respectable 2.2% and the 10 year bond yield a low 3.398%.
As may be seen in the difference between the lower actual value of the S&P 500 and its higher value predicted by the model, is still of the order of 30% having been as much as 83% earlier in the year.
Under or overvaluation is indicated in percentage terms in the residual – that is the difference between actual and predicted values in log terms. The value of the S&P 500 Index as predicted by the model is as heady a number of 1435 as we show in a further figure. The model should be treated as no more than an indication of fundamental value – provided dividends are maintained and interest rates do not shoot higher – the New York market does appear to still offer value.
The dividend discount model of the S&P 500
Source: I-Net Bridge and Investec Private Securities
The actual and predicted by dividend discount model of the S&P 500
Source: I-Net Bridge and Investec Private Securities
When a similar modelling technique is applied to the JSE FINDI, the FINDI is explained by the level of the Emerging Market (EM) Index. FINDI reported earnings and short term interest rates in SA show that the FINDI appears fully valued. Or in other words the FINDI, as is readily apparent, has kept pace with its global peers. Further strength in the FINDI therefore depends on further advances in the S&P 500, which the EMs are bound to follow. The chances of further advances in the S&P 500 should not be discounted, as we have suggested.
The model of the JSE Findi – full valuation indicated
Source: I-Net Bridge and Investec Private Securities
Actual Vs Predicted value of the JSE FINDI
Source: I-Net Bridge and Investec Private Securities
A foreign expert, Gabriel Palma of Cambridge University, has advised SA to “curb the inflows of foreign capital to beat recession”, according to a report from Business Day yesterday. Palma was quoted as saying that “capital controls were needed to address the erratic volatile and uncertain capital flows that could be expected in SA and that would bring a great deal of uncertainty into the domestic economy…..”
The new new thing – foreign capital abundance
In fact capital flows to SA since 2003 have flowed in large and highly consistent volume to fund the current account deficit that grew rapidly as the economy picked up momentum. Without the growth the foreign capital would not have been forthcoming – there would have been no demand for foreign capital nor any supply of it. But without supplies of foreign capital the growth could not have materialised. This year SA economic growth unfortunately has slowed down sharply and the capital inflows have more than halved, both in rands and as a percentage of GDP.
The current account deficit is by definition approximately equal to net capital inflows. The small balancing item that equalises capital flows and the current account deficit are flows into or out of foreign exchange reserves held by the banks and the Reserve Bank. These reserves have been increasing, making capital inflows larger than the excess of imports, net debt and dividend service over exports and net foreign income receipts.
Foreign capital sets the limits to growth – the more growth the more capital – the more foreign capital the better
Clearly the SA economy cannot grow at more than a pedestrian 3% rate without infusions of foreign capital. Our domestic savings rate has declined to about 15% of GDP and cannot finance the growth in the capital stock, the real investment that is necessary to support faster growth. And so we come to a very different conclusion. SA must come out of its recession and grow faster to attract the extra foreign capital that has proved to be available to fund our growth. Unless SA is resigned to the 3% or less growth experienced before 2003 that did not require nor attract foreign capital, the case for encouraging as much foreign capital as we can remains as strong as ever.
Ignoring the new more favourable realities does SA a disservice
Palma and those who think like him do South Africans a grave disservice. They would inhibit the growth in living standards and the improved returns on capital invested that come with growth and which provide the essential attractions for foreign investment. The ability to attract capital to fund faster growth in SA is a relatively recent phenomenon as our figure shows. In the uncertain past the very risky SA economy would soon run up against the limits of its foreign credit. And these limits we would suggest were but 3% pa growth, constrained by domestic savings.
Testing the limits
Just how much capital SA could now attract before foreign lenders would be discouraged for fear of a balance of payments crisis is not known – there is too little evidence to make such judgments with any degree of confidence. SA should do all it can to encourage growth and test the limits set by the global capital markets. The economy is far from testing these limits now. The sooner it does so the better. Fear of foreign capital should be the last thing on our collective minds.
SA: Gross Savings Ratio and the Current Account Deficit
Source: I-Net Bridge and Investec Private Client Securities
Moreover the rand has strengthened this year against the US dollar and the euro. It has furthermore maintained its value against the other much stronger emerging and commodity currencies despite the highly unsettled state of global capital markets and the presumed vulnerability of the SA economy given its dependence on capital inflows (see below). This vulnerability is presumed rather than proved and the strength of the rand in potentially very difficult circumstances proves otherwise. However rand strength, to the degree experienced recently, is not especially welcome to our miners and manufacturers. Perhaps if the economy had grown faster and the current account deficits were sustained at their previous levels, the rand might not have been quite as strong as it has been. If we are to worry about rand strength then let us do it for the right rather than wrong reasons, reasons to encourage rather than discourage growth.
The rand vs the US dollar, the Brazilian real and the Australian dollar (Jan 2009=100)
Source: I-Net Bridge and Investec Private Client Securities
The strength of the rand this month has been a case of US dollar weakness and emerging market and commodity currency strength. The rand continues to perform in line with the Brazilian real and the Australian dollar as we show below and as such has gained significantly this year against both the US dollar and the euro. The rand has gained 20% this year vs the US dollar and about 18% vs the euro. The dollar this week also lost some ground against the euro.
The exchange value of the ZAR; Jan 2009=100 (Lower numbers indicate strength)
Source: I-Net Bridge and Investec Private Client Securities
The US dollar vs the euro (Lower numbers indicate strength)
Source: I-Net Bridge and Investec Private Client Securities
The reasons for emerging currency strength is the growing risk tolerance that has accompanied the recovery of credit markets and the evidence that the fastest growing regions of the world are best represented in emerging equity markets. Capital has flowed out of safe havens into emerging equity markets. The JSE has continued to receive its share of these flows, adding strength to the rand and the JSE. The JSE ALSI when measured in US dollar has held its own against the bench market Emerging Market Index as we show below.
The JSE vs the MSCI EM 2009=100
Source: I-Net Bridge and Investec Private Client Securities
This comparable and very strong performance of the JSE in US dollar as well as in stronger emerging market (EM) currencies is despite the fact that the SA economy is lagging well behind its emerging economy peers. Yet it should be appreciated that the JSE – especially its large cap representatives are more exposed to the global economy than they are on the SA economy.
Ordinarily a strong rand would be very encouraging to domestic consumers. The prices of imported goods become ever more attractive in times of rand strength. Also inflation comes down and interest rates follow to further encourage consumption. This encouragement is not yet at all obvious. Also CPI inflation is lagging well behind import price inflation. Households remain reluctant to borrow and banks remain reluctant to lend.
Yet it should be appreciated that the fundamentals for a revival of consumer spending are improving. The strength of the stock market itself should help reverse some of the negative wealth effects on spending that accompanied the collapse in equity prices in 2008. And lower interest rates will help the housing market to stabilise and perhaps even recover. Equity in homes is another important source of wealth for SA households and any recovery in the value of homes to their owners will be helpful to balance sheets as well as confidence and willingness to borrow.
For exporters the strong rand takes away from the recovery in commodity prices and in export volumes. But they should appreciate the rand is strong because of a global recovery reflected in higher spot prices. For domestic manufacturers having to compete with imports, the strong rand means there is little consolation to be found. For them extreme discomfort follows these trends in diminished pricing power that add to the woes caused by still reluctant consumers.
The Reserve Bank continues to leave the rand to be determined by market forces and to stay out of the currency market. It also shows no appetite for quantitative easing to encourage the banks to lend more. The monetary policy committee however will have become more willing in current circumstances to further reduce short term interest rates. This is probably all the domestic producers of goods and services can hope for from monetary policy for now.
The recovery in the domestic economy will depend upon the strength of the global recovery and export led growth. Lower interest rates and improvements in household balance sheets, as well as more favourable prices in the stores, will help spending growth as will the continued buoyancy of government spending. The economy is closer to a recovery in domestic spending given the global trends and the stronger rand. Firms dependent on the SA economy have hunkered down – they have run down their inventories, reduced their borrowings and strengthened their balance sheets. They have probably experienced the worst the economy could throw at them. They should expect gradual improvement in the economic environment.
Professor Emeritus, University of Cape Town, Investment Strategist, Investec Private Client Securities.
Please treat this as a preliminary draft to accompany the Power Point Presentation made to the conference. A version complete with figures and tables properly integrated will be made available for public comment on my blog after the conference. http://zaeconomist.wordpress.com/
This study demonstrates the role global capital markets play in determining the behaviour of the Johannesburg Stock Exchange (JSE Alsi) the Rand US dollar exchange rate (ZAR) and long term interest rates in South Africa on a daily basis (Albi or R157). It will be shown that since 2005 the state of global equity markets, represented in the study by the MSCI Emerging Market Index (EM) has had a very powerful influence on the JSE, a less powerful yet statistically significant influence on the ZAR and that the ZAR has had some consistent influence on the direction of long term interest rates in South Africa.
The EM may be regarded as a proxy for conditions in global capital markets that affect South Africa. JSE listed shares are included in the EM Index with a current weight of about 7%. The more abundant the capital available for emerging market capital raisers, that is to say the less risk aversion prevailing, the higher would be the level of the EM Index – and of course vice versa.
It will be shown moreover that movements in policy influenced short term interest rates, represented by daily changes in expected short term interest rates, represented by daily movements in the implicit JIBAR 3 month forward rate (Jib3f3) have had very little predictable influence on share prices, the ZAR or long term bond yields. Changes in the forward JIBAR rate are used as our proxy for short term interest rates on the presumption that it is interest rates expected, rather than current actual interest rates that drive the value of shares, bonds and currencies and that therefore changes in expected short term rates rather than changes in actual rates- that may well have been anticipated – have significance for the financial markets.1
The implications of this finding for monetary policy are surely serious ones. It would strongly suggest that policy determined adjustments to short term interest rates, when unexpected, because they do not influence the exchange rate in any consistent way, cannot therefore be regarded as a reliable anti-inflationary tool. We will attempt to explain why higher short term rates have not generally added rand strength and why lower interest rates have not meant rand weakness. The feed back effect of the exchange rate on import export and domestic prices is clearly a very important influence on the measured rate of inflation.
The case for interest rate changes as the principle instrument of monetary policy is furthermore not enhanced by the evidence that short term interest rates have not had any consistently important influence on the direction of long term interest rates in South Africa nor on the direction of share prices. However it would seem to be the case that movements in actual short term interest rates can have a significant influence on aggregate demand in South Africa and perhaps also on house prices. These relationships are not tested here and daily data would not be readily useful in such tests.
This study utilises daily data to model and estimate the behaviour of the JSE All Share Index (ALSI) the rand/USD exchange rate (ZAR) and the RSA bond index or long dated RSA bond yields (ALBI or R157) between January 1st 2005 and August 31st 2009 . The models are single equation models of daily percentage movements in the ALSI, the ZAR and the ALBI or of daily changes in long term interest rates in the case of the R157 The estimation method is single equation least squares regression analysis.2 A few additional equations using monthly data, going back to 1995 in some instances, were run for evidence of structural change in the economy.
The explanatory variables considered for inclusion in the models in addition to the movements in forward short term interest rates (JIB3f3) and the emerging markets (EM) are daily moves in the S&P 500 Index representing share prices in New York, The daily percentage movements in global commodity prices in USD (CRB) the daily moves in Australian/USD exchange rate (AUD) or AUS$) and the changes in US long dated 10 year treasury Bonds.
The character of the dependent variables is demonstrated in figures three to six. We compare the performance of the rand to both the USD and the AUD to indicate that the rand lost significant ground against what may be considered other commodity and emerging market currencies in 2006 as the USD weakened against most currencies in 2006 – 2007.
The exogenous variables of the modelling exercise are shown in figures 9 to 12. It may be seen that daily changes in the variables are highly random and that they have drifted both higher and lower since 2005. We also measure the volatility of the variables in the form of a 30 day moving average of their Standard Deviations. It is shown how much more generally volatile price and interest rate became during the financial crisis and also how similar has been the behaviour of volatility on the different markets. That risks appear so similar in the different markets is further evidence of the globalisation of capital markets. ( See figures 7, 13, 14, 15 and 16)
The increase in the volatility of share prices globally, including on the JSE , has had a very negative impact on share prices. The negative correlation between daily percentage moves in the Index of Implied Volatility on the S&P 500, the Vix and daily moves in the S&P 500 itself has been a high negative (-0.76) and between daily moves on the JSE and the SAVI an almost equally negative (-0.73) since May 2005.
Statistics for the SAVI, the implied volatility indicator of the JSE, are only available since then. It is surely volatility that drives the share market up and down. It is a much more difficult task to explain and predict volatility. Volatility in share markets may be regarded as abnormally high before 2007 when the global glut of capital was holding down interest rates and encouraging risk tolerance. The financial crisis as we well know reversed all this and produced much higher degrees of risk aversion and volatility as the likelihood of defaults and bankruptcies increased so dramatically, especially after the failure of Lehman Bros in September 2008. (See figure 17)
In figures 18 and 19 we present two tables of simple correlation statistics for the daily percentage movements in the dependent and independent variables of our models. The correlation statistics that we regard as of particular interest are highlighted in red. The correlation statistics provide essential support for the statements made earlier. To be noticed are the high correlation between the JSE in rands and the EM in USD (0.73) The correlation of the JSE with the CRB also in USD is lower but significantly positive (0.39) Daily movements in the JSE and the ZAR have been negatively correlated (-0.33) indicating that rand strength rather than rand weakness is generally helpful to the JSE.
Also to be noted is the very low almost zero correlation of daily moves in the JSE with changes in forward short term interest rates (- 0.07) The correlation of movements in the share and all bond indexes is a low but correctly signed (0.19) Lower or higher interest rates generally would not appear to have been especially helpful or harmful to the JSE over this period.
The high correlation between the AUD and the JSE does not have any obvious theoretical explanation and this must be attributed to the high correlation between the AUD with the EM Index (-0.64) shown in the following table. Clearly the global economic forces that drive the EM higher or lower strengthen or weaken the AUD/USD.
It should be noticed that the returns on the ALBI the All Bond Index (the higher the index the lower are interest rates) have been negatively correlated with the moves in the ZAR(-0.34). That is a weaker rand is associated with higher long term rates- presumably because a weaker rand is associated with more inflation to come. Of further interest is that bond market returns have been only weekly correlated with movements in short rates (-0.16). The correlation, not reported in the tables, between long dated R157 yields and these short rates is a very similar (0.16).
The high correlations over (0.50) between movements in the ZAR and the global equity markets should be noted as should the positive correlation between moves in the ZAR and the CRB and AUD. He rand has behaved as an emerging equity market and commodity currency. The weak, near zero correlation, between the ZAR and short term interest rates should be of particularly concern (.06). The final column of low correlations between short term interest rates and the equity bond and currency markets indicates how little short term interest rate moves seem to matter for the markets generally.
The regression equations reported indicate that we are able to find very good estimates for daily moves in the JSE relying on the strength of the EM effect. We back up the models of daily movements in the JSE with models of monthly movements that go back further. These monthly models confirm the growing influence of emerging equity markets on the JSE since 2003.
Our models of the rand may be regarded as very satisfactory with explanations of daily moves with the EM again providing the major impetus for the rand. Our models of monthly movements in the ZAR indicate that the EM influence has also become stronger providing for much better fits for the models in recent years.
The regression estimates for the bond market confirm the observations made before. The most consistent influence on changes in long term interest rates are movements in the ZAR. Movements in the ZAR are negatively related to moves in interest rates in an apparently statistically significant way – the weaker the rand the higher are interest rates. However the sign on the ZAR co-efficient on interest rates is reversed as the ZAR is made orthogonal to the EM influence on the ZAR. In other words the EM influence on the ZAR is first extracted to leave a pure net of EM ZAR.
The goodness of fit of the bond market model is poor though the influence of short term interest rate surprises on long term rates, while of small impact, is statistically significant. The influence of US bond yields on RSA yields is also small but also of statistical significance. Clearly other forces – especially inflationary expectations are at work in the bond market.
It must be asked why the global capital markets have become much more important for the JSE and the ZAR in recent years. The answer must lie in the structural change that occurred in South Africa after 2003 as growth in household consumption spending picked up strongly to drive the growth rates higher. This faster sustained growth was made possible by attracting foreign capital on a scale not earlier available to South Africa- at least not since the early eighties as we show in figures 38 to 40. The ability to attract capital to finance growth in SA needs to be fully taken account of when setting interest rates. The feed back loop from faster growth to more foreign capital provided needs to be well understood and nurtured. It offers the rare opportunity to achieve faster growth with less rather than more inflation.
Higher short term interest rates in SA may attract capital through the attractions of a higher carry. They appear just as likely to frighten capital away if higher interest rates are assumed to threaten the growth prospects of the economy. If so higher policy determined interest rates are as likely to bring a weaker rand and more inflation than the opposite. Higher interest rates are however very likely to slow down growth. The instrument of short term interest used to manage inflation in SA appears to have been particularly blunt and potentially dangerous to the health of the economy as they appear to have been lately.
What we already knew about the depressed state of the economy in Q2 2009.
We had been informed earlier by Stats SA that GDP, that is to say output growth, had declined further at a seasonally adjusted (-3.0%) annual rate in Q2 2009 for the third consecutive quarter making this a particularly severe recession. We also knew that the agriculture and particularly the manufacturing sector had suffered severe declines in production while mining sector output recovered showing positive growth for the first time in many quarters (See below). [Unless otherwise indicated all growth rates referred to in this report will be seasonally adjusted annual equivalent growth rates. All statistics and figures reproduced here are sourced from the Reserve Bank Quarterly Bulletin September 2009.]
The new bad news
Not at all surprisingly we are now informed that aggregate spending on goods and services by households declined at a further very depressing (-5.8%) rate in Q2. The weakest component of household spending remained spending on durable consumer goods, including new cars (down -18.8% pa in Q2), which had suffered so much at the hands of the increase in interest rates through 2006, 2007 and 2008 that had continued long after such interest rate sensitive spending was in precipitate decline (See below).
Does income drive spending or spending drive incomes?
It will be said that the severe decline in personal incomes caused the decline in household spending. Both decline at about a negative 6% rate in Q2 (see below).
The reality is that the decline in household spending that constitutes such a large part (well over 60% of GDP) caused the decline in incomes. Expenditure in aggregate drives income and output as much as the other way round. The problem for the SA economy, as it has been the problem almost everywhere, has been a lack of demand, especially for exports, as global spending collapsed in the face of the financial crisis. Almost everywhere else very active attempts have been made to stimulate domestic spending and its corollary bank lending to compensate for the weakness of foreign demand.
SA had led itself into recession with severe monetary policy settings that undermined household spending and left the economy especially vulnerable to the weakness of exports after the crisis broke. And SA is surely almost unique in the reluctance of its central bank to reduce interest rates and ease quantitatively to encourage domestic spending. The obsession of SA monetary policy with inflation and inflationary expectations, over which monetary policy has little influence, has left the SA economy well behind in the economic recovery stakes.
The failure of monetary policy revealed
The failures of monetary policy are well revealed by trends in broader money supply and credit growth. Both are now in absolute damaging retreat.
This is a most unsatisfactory state of affairs which the authorities should be addressing urgently with all the means at their disposal, including purchases of foreign exchange to add cash to the system and generous and extended terms on which cash can be offered to the banks. Without a recovery in bank lending the weakness of household spending and the economy must persist. None of this central bank action has been forthcoming. As far as we can observe of foreign exchange reserves held by the Reserve Bank, little attempt has been made so far to inhibit unwanted rand strength. The very strong rand has been draining the competitive strength of domestic manufacturing, which is facing a large deflation of the prices of imported goods with which they compete and of export prices and volumes realised in weaker offshore markets.
It is the corporate sector that has become debt shy
The weakest part of bank lending has in fact proved to be lending to the corporate sector though lending to households remains weak with mortgage lending growing very slowly (See below).
Clearly the decline in corporate borrowing is the result more of a lack of demand by business for capital to expand output than an unwillingness of banks to lend.
The sort of good news
We can explain why SA business has so little demand for bank credit in current circumstances and why in part this may be regarded as good news in that it does portend a recovery in the economy. Spending on inventories in Q2 particularly by manufacturers of motor vehicles declined at an extraordinarily rapid rate in Q2. Real inventories are estimated to have declined by an annual equivalent volume of R52bn in Q2. This is equivalent to a 10% reduction in Gross Domestic Expenditure (GDE), which is defined as the sum of Consumption and Investment Spending plus the change in the level of inventories held by the business sector. GDE is estimated to have declined at an extraordinary -14.5% pa rate in Q2. Final demands (spending net of inventory changes) declined by only -3.5% pa helped by relative stability in capital formation (see below).
Capital formation by business is demand derived from household spending- both are very weak
Gross fixed capital formation held up supported by further strong growth in capital formation by public corporations and despite a sharp further decline in capex by the private sector (See below). The weakness in household spending has naturally undermined the willingness of businesses to add capacity. The decline in private sector investment spending together with the sharp run down in inventories has clearly reduced the demands for bank finance. Only a revival in household spending helped by increases in the supply of bank credit can get capital formation going again.
Slower growth has led to a surprising reduction in the current account deficit
That GDE (-14.5% pa) declined as much as it did relative to GDP (-3.0%), allowed total output (GDP) to exceed total expenditure (GDE) for the first time since the economy took off in 2003.
By definition the difference between GDP and GDE is the difference between exports and imports. For the first time since the economy took off in 2003 the economy ran a trade account surplus in Q2 2009 and surprised many (including the currency market) with a significantly reduced current account deficit. This more than halved in Q2 and declined from the equivalent of 7% of GDP in Q1 to 3.2% in Q2.
This deficit is about equal to foreign capital inflows. The current account deficit is the sum of the trade balance and the balance of interest and dividend receipts from abroad. SA is a net remitter of interest and dividends equivalent to about 3% of GDP (See below).
The good news, if it can be regarded as good news, is that exports declined by less than imports in Q2 2009 as we show below.
Less invested=less imported
The cut back in investment in capital goods and finished goods on the shelves and in the production progress took a full toll of imports. The good news about inventories is that they cannot continue this rate of decline and that a smaller rate of decline will add to growth rates to come.
Hoping for better news about faster growth and larger capital inflows
It would have been much better news had both exports and imports demonstrated the strong positive growth rates of much of the period since 2003. The growth in the SA economy since 2003 was willingly supported by net inflows of foreign capital, hence the debt service payments (See below).
As may be seen the capital continued to flow through the global financial crisis when they might have been thought particularly vulnerable to this heightened risk aversion. However the inflows have slowed down with the slower growth currently under way.
The current account deficit that rise with growth rates and the capital inflows that finance the sum of the trade and debt service accounts of the balance of payments are two sides of almost the same thing. The almost part is the usually very minor change positive or negative in foreign exchange reserves held by the banks, which solves the balance of payments equation. Therefore without the capital inflows the current account deficit would have to be smaller and the growth rates constrained. Without foreign capital inflows, growth would have been slower; however without the growth the capital flows would not have been forthcoming.
Growth self evidently leads capital inflows – fear of the balance of payments is harmful to the economy
The dependence of capital inflows to SA on growth in SA is now very apparent. The growth slowed down and the current account deficit and the capital inflows declined accordingly. It cannot be argued that it was withdrawals of foreign capital that forced a slowdown in the economy. The contrary is surely true: the self inflicted slowdown in the economy was accompanied by less foreign capital demanded and so supplied to SA borrowers. This was the case through the worst global financial crisis since the great depression of the 1930s.
Much less fear of the economic future called for
Thus it can surely be argued that if SA growth picks up, foreign capital will be forthcoming to help fund the growth. There is surely no reason to fear growth on the basis that it makes the economy vulnerable to the dictates of foreign capital markets. It was such fears that led to the excesses of monetary contraction in 2006-7 that eventually produced the recession of 2008. A more sanguine attitude to the balance of payments would have avoided such excesses of monetary policy zeal.
There is every reason to encourage growth in SA because it will lead to capital inflows. As has been pointed out by Governor Tito Mboweni, a current account deficit is not inflationary. Or in other words capital inflows fund imports that add to the supply of goods and support the rand and so help hold down prices. Hopefully such an understanding will help the monetary authorities engage actively in helping the economy recover. But even if the positive feed back loop between growth and inflation is not recognised the desperate state of the economy revealed by Q2 expenditure will surely bring the Reserve Bank in from the sidelines.
Doug Short has attracted enormous attention to his website http://www.dshort.com/ with his “Four Bad Bear Market Analysis” (shown below and updated to Friday 28 August by its originator). The natural bears took great satisfaction from the apparently severe regularity of past bear markets, especially that of the crash of 1929. The problem for the bear lovers, as may be seen in the accompanying diagrams is that the relationship, especially with the bad bear of 1929-32, appears to have broken down in the face of the rally in stock markets that began in March 2009. The recent recovery appears by now to have extended for too long and too far to be identified as a bear market rally or a bear trap.
This break in the data led the inventive Doug Short (his real name assuredly) to realign the starting point for the analysis and the apparent regularities from the top of the markets before they collapsed to the following bottom, when the markets began their recovery. This new version of the analysis provided by Mr Short that demonstrates that the bottom after the crash of 1929 “failed” eleven months later, no doubt provided renewed comfort to the bears. However as may also be seen the recent rally has also by now taken the Dow beyond its gains of 1929. A new attempt to find regularities in the stock market patterns may (bulls hope) soon be called for.
Bull and bear markets are only revealed with hindsight
The reality is that bear and bull markets are only identified after the event. Daily share market movements are a random walk and recent events prove no exception to this as we show below. A bear market is one when the random drift proves, well after the events, to have been generally lower and a bull market is identified after the event as a period of time when the drift was mostly higher.
In the figure below we show the pattern of daily percentage movements in the S&P 500 and the JSE All Share Indexes since the lows in the market on 9 March 2009 until the market close of Friday 28 August 2009. In the further figure we show the distribution of these daily moves about its daily average of a positive 0.02% per day with a large standard deviation of as much as 1.6% per day. The equivalent statistics for the S&P 500 are an average move of .03% per day with an even larger standard deviation of 1.7% per day. If we take the period back to the peak of the markets in May 2008 the average daily price move for the S&P 500 since then is a negative .09% per day and -0.06% per day for the JSE.
Daily percentage moves in the S&P 500 and the JSE ALSI since 9 March 2009
Source: I-net Bridge and Investec Private Client Securities
Histogram and Descriptive statistics for daily moves in the JSE ALSI March-August 2009
Source: I-net Bridge and Investec Private Client Securities
Beating the market demands careful judgment about the forces that will drive and surprise the markets
Predicting whether the continuous random drift in market indexes and share prices will be higher or lower calls for fundamental judgments about the information flows that will move the market over the following twelve or more months. The past provides us with our theories about the forces that drive markets – our theories then lead us to anticipate and predict the direction of the economic fundamentals that we believe will surprise market participants and lead the market to drift higher or lower in the course of the next twelve months or so. We have to make these predictions with humility about the difficult nature of the task of beating the well informed market.
Mining past moves in stock market indices for patterns that will repeat themselves in the future is often attempted, but in our judgment such attempts are unlikely to prove reliable in a consistent way.
Inflation in South Africa (6.7% in July down marginally from 6.9% in June 2009) might well be regarded as stubbornly high given the weakness of the SA economy and especially of aggregate demand. The Consumer Price Index (CPI) actually increased by as much as 1.1% in the month that if sustained would lead to an annual rate of inflation about 14%. However it hopefully will be noticed by the monetary authorities that almost all of the increase in prices in July can be attributed to increases in the charge for electricity to households and the increase in the costs of private transport.
Supply side shocks continue to drive the CPI higher
These are areas of the economy where prices are set by officials and regulators rather than market forces and are therefore not susceptible to monetary policy. These administered or regulated prices, especially electricity and water charges, are playing rapid catch up with the costs of adding to capacity to supply more such essential services. This adjustment has come after years of excess capacity and prices being regulated by reference to historic rather than replacement costs. Hopefully these supply side shocks to prices are temporary ones that end when replacement cost pricing is established. In the market place, if firms cannot realise prices that cover replacement costs – and provide a satisfactory return on capital invested – they go out of business. Publicly owned utilities with monopoly power do not go out of business – they charge higher tariffs and are infused with additional capital supplied by the tax payer.
Higher charges lead to less spending – not more inflation
Households cannot avoid paying these higher charges and this makes them less rather than more capable of spending on other goods and services. This adds to the deflationary pressure currently acting on prices that are market determined. Such forces would normally – absent of inflexible inflation targets – call for lower rather than higher interest rates to encourage more spending so badly needed to lift the economy out of recession. These deflationary forces will be revealed in gory detail when lower prices realised at the farm, factory and port gates come through in the Producer Price Index (PPI) for July, to be updated today. PPI is expected to be more than 4% lower than twelve months ago. The threat to the SA economy as most economies world wide has been and remains deflation and recession not an inflationary boom.
Looking at the CPI in detail
In the calculation of the CPI the largest weight by far (22.7%) is given to the broad category Housing and Utilities. The prices of Food and non-alcoholic beverage that account for 15.68% of the Index actually fell 0.4% in July reducing the year on year change in Food and Beverage prices (Food Inflation) to a still above average 8.3% pa. Yet it has now become clear that lower prices at producer level are feeding into lower prices for consumers. The weight attached to the electricity and other fuels account is but 1.87% and to water and other services 3.31%. However the increases in electricity and water charges in July were extraordinarily high – as much as 21.5% for electricity and 8.8% for water.
Thus the monthly increase in electricity charges contributed 0.4% of the July month increase of 1.1% and higher water charges contributed another 0.29%. The increase in Private transport costs – mostly fuel – contributed 0.20% leaving all other items with an average monthly rate of increase of 0.11% – a very low rate of inflation. Thus almost all of the increase in prices in July can be attributed to prices that are beyond the influence of consumer spending and beyond the direct influence of monetary policy and interest rates.
Whither owners equivalent rent – the key to inflation to come
The largest component in the important housing cost category is Owners Equivalent Rent with a weight of 12.21% of the CPI. This item has replaced mortgage interest in the CPI and takes its cue form average house prices of which implicit rents are some assumed fraction. Owner equivalent rent is the statistician’s equivalent of the accountant’s mark to market adjustments that has no direct impact on cash flow but can be just as confusing in its implications.
Unlike when mortgage interest rates rise or fall and add or reduce measured inflation, as used to be the case in the calculation of headline CPI, households are likely to spend more when their wealth increases with higher house prices and a higher CPI and vice versa: spend less when house prices and owners equivalent rent is falling. The task of dealing with asset price inflation – especially house price inflation – has proved beyond the capabilities of central bankers. Asset prices are now a direct influence on the SA inflation rate and will need especially careful treatment when inflation targets are being aimed at.
Owner equivalent rent did not change in July – presumably because (declining) house prices were not sampled in the month. Actual rentals (weight 3.49%) also recorded a zero change for presumably the same reason. Presumably lower house prices when surveyed will help lower owner equivalent rents and measured CPI inflation.
The problem is recession and deflation – not inflation. Will the Reserve Bank act accordingly?
The direction of prices that have been influenced by monetary policy and interest rates is decidedly downwards and is currently still adding to the recessionary pressures acting on the economy. What is required is a full recognition by the Reserve Bank of these facts of SA economic life. The Reserve Bank needs to take a leaf from the play book of most other central banks that cut interest rates sooner and much more aggressively and eased quantitatively – that is printed more money – because they recognised the immediate deflationary and recessionary dangers to the well being of their economies posed by the global credit crisis. This recognition in SA has been far too long in coming – confused as it should not have been by very different signals emanating from the direction of consumer and producer prices. Hopefully the epiphany is upon us.