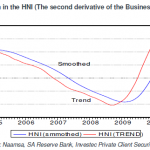
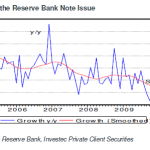
In this report we update our hard number indicator of the current state of the SA economy to September 2018. Following that is the announcement of new vehicle sales by Naamsa and of its notes issued SA Reserve Bank (SARB) note issue. We attach equal weights to new vehicle sales and the note issue adjusted for consumer prices to establish our timely Hard Number Indicator (HNI) The demand for notes can be regarded as an indicator of spending intentions by households while new vehicles sold that include commercial vehicles of all sizes, may be regarded as an up to date indicator of capital formation by firms.
The HNI is compared to the SARB coinciding business cycle below. One that has only been updated to June 2018 making it of limited use as an indicator of the current state of the economy. Estimates of GDP itself in Q2 have been available since early September. Ideally the coinciding indicator would serve as a leading indicator of the state of the economy – to be revealed in due course by updated GDP estimates. As may be seen the HNI is now trending higher at a slow pace, a pace similar to that of the Reserve Bank coinciding indicator to June 2018. A time series extrapolation of both indicators of the current state of the SA economy predicts similar growth rates of the order of 3% per annum over the next twelve months. (See figures 1 and 2 below) Such growth, if it materialized, would be well above consensus estimates of GDP growth in 2019.
Fig. 1; The Investec Hard Number Indicator (to September 2018) and the Reserve Bank Coinciding Business Cycle Indicator (to June 2018) (2015=100)
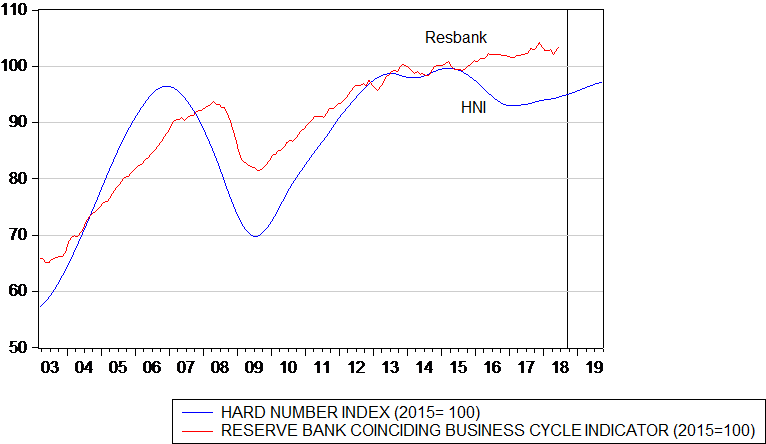
Source; Stats SA, SA Reserve Bank, Naamsa and Investec Wealth and Investment
Fig.2; Growth in the Hard Number Indicator and the Reserve Bank Business Cycle Indicator
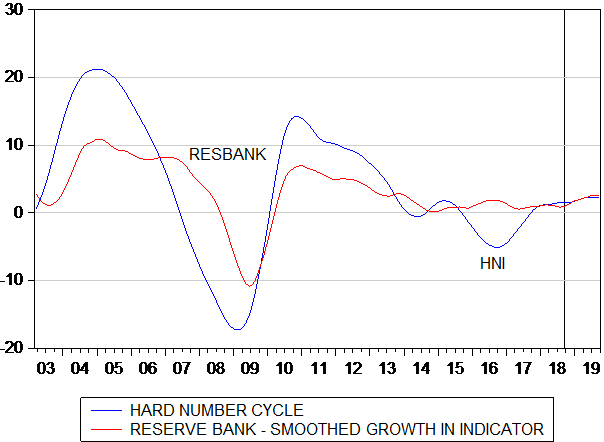
Source; Stats SA, SA Reserve Bank, Naamsa and Investec Wealth and Investment
The SARB coinciding business cycle indicator (provided on a monthly basis) provides a good proxy for GDP, as may be seen below, when converted into a quarterly series to compare with quarterly estimates of GDP. A comparison of the cyclical indicator with the GDP estimates is made in figure 3 below. The Hard Number Indicator is intended to act as a leading indicator of both series and, as may be seen, has succeeded in doing so. The HNI turned lower in 2007- before the peak in the growth rates was reached in 2008, and turned higher in 2009 ahead of the recovery of the economy from the Global Financial Crisis. The HNI fell back relatively to the Reserve Bank indicator in 2016, because of a short lived downturn in new vehicle sales, but is now moving very much in line with the SARB cyclical indicator as is shown in figures 2 and 3.
Fig. 3; A comparison of GDP at constant prices with the Reserve Bank Coinciding Business Cycle Indicator
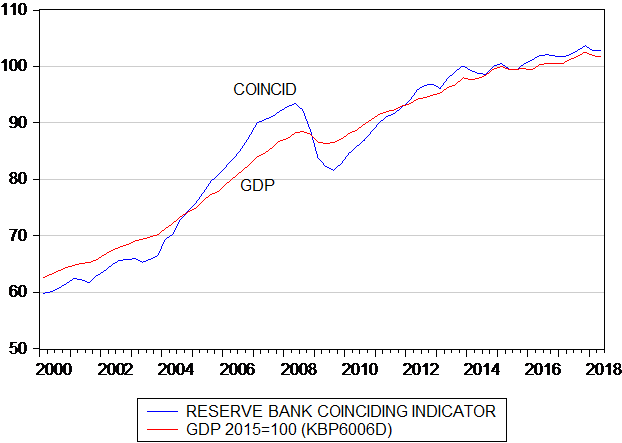
Source; Stats SA, SA Reserve Bank and Investec Wealth and Investment
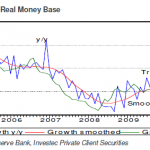
The underlying components of the HNI are shown in figure 4 below. As may be seen the new vehicle cycle, having fallen away in 2016, recovered in 2017 and is now on a slightly positive growth trend. Current sales of new vehicles are running at an annual rate of 551,000 new units sold, a rate of sales that is forecast to rise modestly to an annual equivalent of 570,000 units in twelve months. The cash cycle, adjusted for inflation, is recovering consistently and is forecast to grow by about four per cent per annum in 2019. (See figure 4)
Fig.4; The components of the Hard Number Indicator. Smoothed annual growth rates
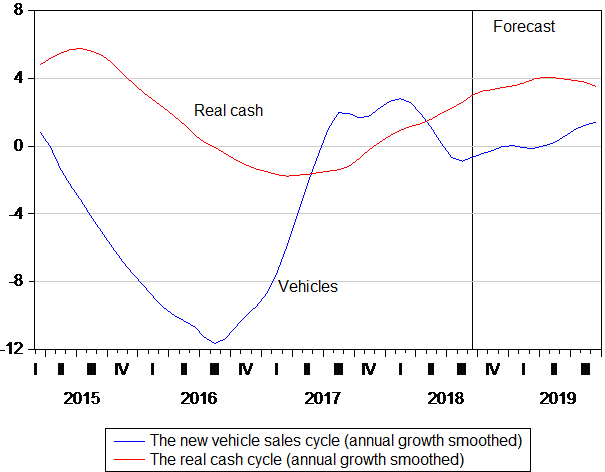
Source; Stats SA, SA Reserve Bank, Naamsa and Investec Wealth and Investment
The real cash cycle is benefitting from an increase in the demand for and supply of cash from the SARB that is now growing at a 7% annual rate and slightly lower inflation. We may hope for the sake of economic activity in SA that this growth rate continues to run ahead of inflation, as the time series forecast suggests it may. It is forecast to continue to grow at its current pace of about five per cent per annum. (See figure 5) The exchange rate and the global oil price, little influenced by what happens in SA, however will have a big say in how inflation turns out and so how stimulating an increase in the supply of cash will be.
Fig.5: Growth rates in real cash and consumer prices
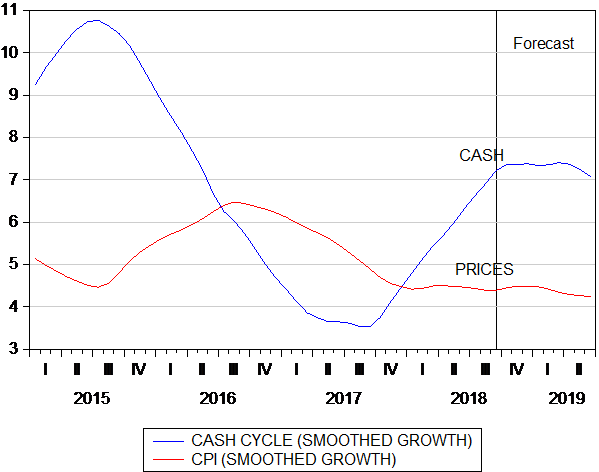
Source; Stats SA, SA Reserve Bank and Investec Wealth and Investment
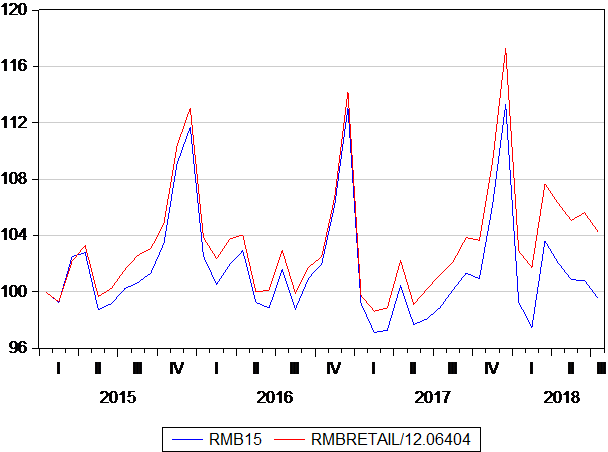
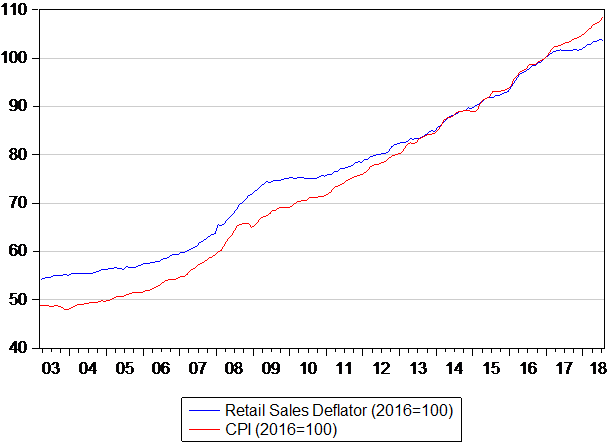
A striking feature of current price trends in SA is that price increases at retail level are running well below headline inflation and are forecast to remain so. (See figure 6 below)
Fig.6: Consumer and retail price inflation
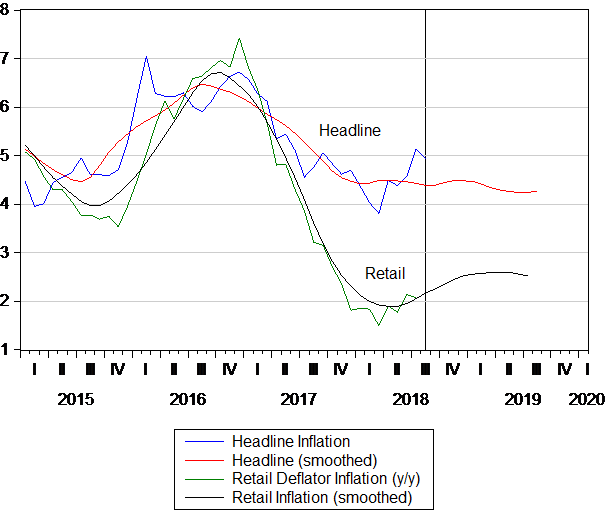
Source; Stats SA, SA Reserve Bank and Investec Wealth and Investment
Clearly retailers and their suppliers have had very little pricing power and operating profit margins and remain under pressure given the weak growth in volumes of goods and services sold to households. No doubt the higher charges for petrol and diesel in the wake of a weaker rand and higher oil price in US dollars have contributed further to currently weak demand at retail level and may continue to do so.
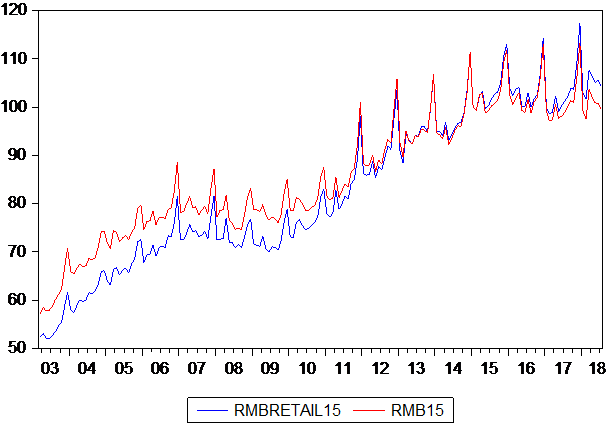
The growth in the supply of cash – adjusted for inflation – has proved a very good predictor of retail spending in South Africa. The real cash cycle has consistently led the retail sales cycle as we show below. Though, as should also be noted, these trends parted company in late 2017. They continue to point in an opposite direction- with the cash cycle showing a pick up while retail sales volumes continue on a declining path. These opposing trends may well reverse, given no further shocks to the confidence of households in their income earning prospects- and subdued inflation. Hopefully too, higher interest rates will be avoided that could depress household demands further.
Fig. 7: The real cash and real retail sales volume cycles
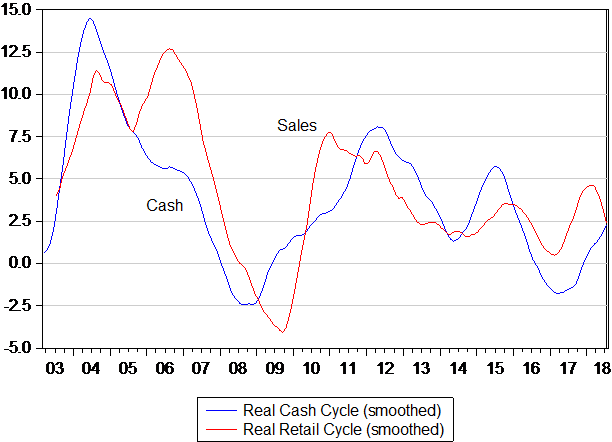
Source; Stats SA, SA Reserve Bank and Investec Wealth and Investment
The indicators point to a positive rate of growth in spending and output over the next twelve months. Rand strength and lower interest rates and less inflation would help stimulate the economy further. Rand weakness will do the opposite. The outlook (hopefully an improving one) for emerging market economies and especially the Chinese economy could move emerging market exchange rates and the rand in a direction, helpful to household spending. Less political risk attached to investing in South African assets would be an additional source of stimulus.