Living with risk

South African savers dependent ontheir pension and retirement plans will have become aware that the actions of the Chinese Communist Party are sometimes more important than the actions or non-actions of the ANC. This is because of their likely large stake in a Chinese Internet giant, Tencent, held through their shares they own in JSE listed Naspers, (NPN) and via its controlling stake in Amsterdam and JSE secondarily listed, Prosus. (PRX)

Because of the much greater uncertainty about the policies the Chinese will apply to the Tencents, the Alibabas and Baidus and their like, a share in NPN or PRX has become much more risky to hold and therefore less valuable. Shareholders taking on more risk require compensation in the form of higher expected returns, this almost always means a lower entry price, a lower current share price.

The risk to any asset holder is simply the risk that the price of the asset they hold may rise or fall from its current level, should they have to or be forced to cash in their investment at some perhaps unknown point in time. The chances of a rise or fall from the current market determined price, assuming a well-informed active market in them, will be about the same 50% on any one day. Market prices follow a random walk, rising and falling in an irregular sequence. Hopefully these random movements come with an upward drift to bring actual returns in line with the higher expected returns, that make holding risky assets a rational choice for the long-term investor.

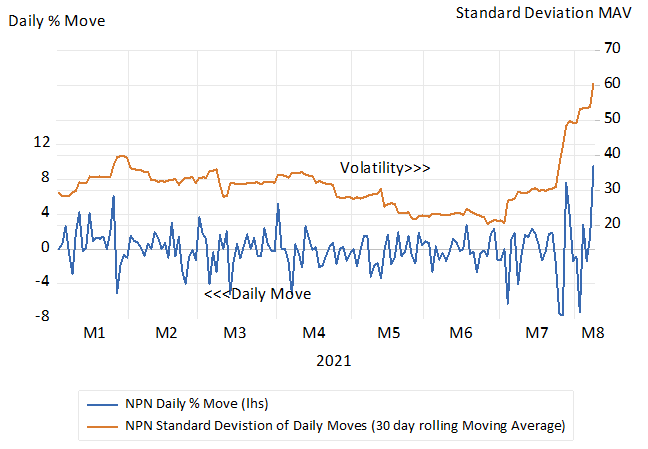
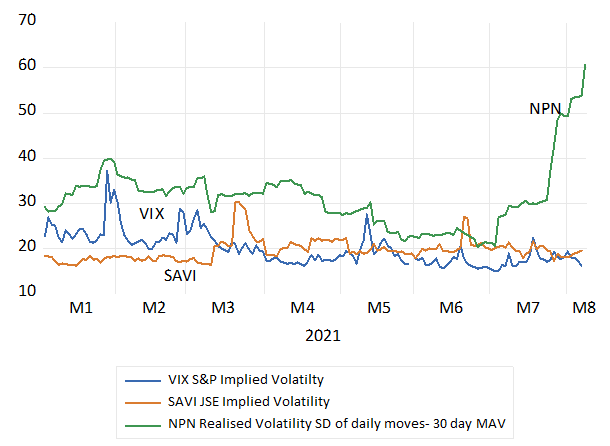
In riskier times the daily or hourly moves in both directions, up and down, become significantly wider, while the average move over any extended period will still stay close to zero. When the sense of the future becomes less certain, volatility of share prices increase, the standard deviation of daily moves about the average of almost zero widens, and the cost of insuring against such changes in market prices in the form of an option to buy or sell an option on the share or Index inevitably increases. As it has done in the case of NPN.

The recent increase in the daily volatility of NPN has been of extraordinary dimensions. Daily share price declines of 7% and then an increases of 10% on August 10th are truly exceptional and reveal how difficult it has been for well informed investors to make up their minds about what the future will hold for Tencent, NPN and PRX. The standard deviation of daily moves in the NPN share price (30 day moving average) has almost trebled since June 2021.

Daily % Moves in NPN and their Volatility Standard Deviation of Daily price Moves (30 day moving average of the Daily SD) to August 9 2021

 f1

Volatility compared;  S&P 500 (VIX) JSE Top 40 SAVI and NPN Standard Deviation of Daily price Moves (30 day moving average of the daily SD) to August 9 2021

f2

The rewards for holding on to your NPN or PRX shares remain to be seen. The China risks may decline to help add value. NPN management also hopes that the value of an NPN or PRX will be enhanced by the shares trading more closely to the market value of their Tencent Holdings. They are rejigging the allocation of its Tencent holding between Johannesburg and Amsterdam to attract stronger investor interest to reduce this discount to the sum of its parts, mostly Tencent.

My theory is that the value lost by shareholders is mostly because of scepticism about the value of the acquisitions and investments made by NPN/PRX. They are expected to return much less that the investors could earn for themselves taking on similar risks and so investors and analysts write down the value of this expensive investment programme when they estimate the value of NPN or PRX. The more invested, the more value destruction expected, the lower the value of an NPN or PRX share and the larger the discount. With the completion of the latest restructuring in sight we will see the alternative theories of the discount put to the market test.

The one possible for shareholders – if my theory holds – though it would be a bitter consolation, is that the lower the Tencent share price and the weaker the NPN and PRX balance sheets, the more disciplined and constrained will be their investment and borrowing programmes. And the lower the discount.

Book chapter: The theory and practice of investment strategy

In this chapter I reflect on the role of the economist/strategist in the business of managing wealth. It is a role I have played since my first involvement with the financial markets in the early nineteen-nineties.
I share the ideas about financial markets and their relationship to the economy that have informed my work as an investment strategist and economist in the financial markets. I say a little about my personal involvement in the financial markets.
I explain the importance of a well-considered investment strategy, for not only the wealth owner or their agents, the portfolio managers, but for the greater good.
These thoughts are followed by a case study of how I go about my work reading the financial markets that I hope will be of interest and helpful to those with a close interest in financial markets. The analysis offered is an example of pattern recognition that analysts and indeed all businesses  rely upon to improve their predictions. This recognition has become so much easier over my years with the ready availability of low-cost computing power, most helpful software, and abundant data, easily downloaded. Exhausting the data, testing a theory, looking for evidence to support a  theory, becomes a matter of minutes rather than the years it took when I first took an interest in financial markets. Theory and observation run together, observations lead to theory and theory is tested by observation. My attempts to understand and explain the links between the financial markets and the economy and the economy and financial markets remains a work in progress that I hope to continue for as long as it makes sense for me to do so and worthwhile for those who engage with me.

Read the full chapter here: Chapter 10 – The theory and practice of investment strategy

More order – less law

The recent willingness of communities in South Africa to defend the property of others, their shopping malls, is of deep significance. At great danger to themselves they established a line that the looters and vandals feared to cross. They did so because what they were protecting was of great value to them. What was at stake was convenient access to the great variety of goods and services, necessities, and luxuries the shopping malls and their retail tenants supply them.

They were defending the market based economic system of which the last step in a supply chain is the well-stocked shop around the corner from which they benefit in a practical and important way, as they well understand.

hey are unlikely to be able to explain that the market delivers via a highly complicated well informed supply chain that reaches across the globe. One that is held together through the discipline of required returns on their owner’s capital put to risk in all the different enterprises that link producers and their customers. Or appreciate that the feed-back loops that keep the system going are not designed or directed by any leader issuing orders. That the process evolves continuously in response to the essential knowledge of how it works best that is highly diffused among many millions of decision makers. Who are required to respond to the preferences of their customers that are signalled when they make their selections at the malls. That it is indeed in large measure a consumer led system.

These are the abstractions used to make the case for free markets and privately held property. Abstractions that are not easily grasped and compete with the other, more easily grasped, abstraction of a centrally planned economy. One led by a presumably all-knowing and equality minded, selfless and highly competent bureaucracy.

But the market system delivers the goods in abundance as SA the communities know very well – and they do not need to know more than the practice. They should be aware that the alternative to the market-consumer led system, whenever tried, has failed to deliver, other than to its powerful elites, who maintain their power and very unequal living standards by their ability to brutally repress any opposition that might dare to challenge their interests.

While the mob was attacking our system, Cubans were also protesting politely on their streets. Protesting for more economic freedom, more access to the goods and services and higher incomes that they know a market system could provide them with. It was most unusual protest in Cuba because it will be severely punished as the protestors must expect to be. The well-heeled Cuban establishment has one of the most effective surveillance systems to keep their citizens in line.

The market system however does depend critically on the provision of law and order- to protect property and wealth. Without it the incentive to save and invest and to take risks with savings, that is capital, falls away and economic progress is stunted.

The priority for the SA government, is to not only restore order but to provide every confidence that it will be able to provide protection against disorder in the future. This is the essential reform agenda. South Africans and their ability to take full advantage of what the malls could offer them needs not so much more law and order, but rather more order itself. The economy could do with much less law, of fewer rules and regulations, and obstructions of freedoms to engage and contract freely and usefully with each other.

The signals from the financial markets indicate that the global investors have not changed their view of the SA economy this month. That all is by no means lost. The cost of insuring RSA dollar denominated debt this month has increased by 20 b.p. while the yield on a five-year RSA dollar bond is barely changed.


f1


Long term interest rates in SA are largely unchanged as are inflation expectations.


f2

The rand weakened against the dollar this month by 2.4% but so have most other EM exchange rates- on average by about a per cent. And EM equity markets have underperformed the JSE this month- in USD- by about 6%

f3


f4

What remains very helpful to the SA are high metal prices. They have had a welcome pick-up since July 19th


f5

The investor opinion of SA remains un-flattering yet one of wait to see. Correctly so.

Anatomy of a crisis: lessons from 2008 and 2020

There are regularities of economic crises and their aftermaths that can help us to plot the way ahead.

Life has returned to normal in the US and UK – judged by the crowds attending Wimbledon, Wembley and Whistling Straits. With only the occasional mask to remind us of a crisis passed. The normal is once again guiding our expectations and economic actions, and is determining the value of the assets we own.

Normal for now, that is, and until the next crisis again moves the markets. Its timing, causes and consequences will remain one of the great known-unknowns, or perhaps it will even be an unknown- unknown (in the words of the recently passed Donald Rumsfeld). However, the successes of recent crisis management may help put us in a better position to cope.

We can define an economic crisis as a serious disruption of economic activity, leading to the severe loss of income and the benefits gained from producing and consuming goods and services. A crisis is therefore destructive of the value of the assets we own, which depend on such incomes.

A crisis is worse than your average recession, when GDP declines by a percent or two below trend for a year or so. The failures of the banks and insurance companies in 2008-2009 resulted in the Global Financial Crisis (GFC), which threatened to implode the real economy with them. In 2020, economies were shut down summarily to escape the pandemic, resulting in the loss of as much as a quarter of potential GDP, a large sacrifice of potential incomes and output.

Overcoming these two crises relied essentially on governments and their central banks. In the case of the GFC, it required central banks to shore up the global financial system buying assets from banks and financial institutions on a vast scale, in exchange for central bank money.

The responses to the crisis of 2020, at least in the developed world, were more immediate, less equivocal and on a larger scale than after 2008. They added much direct income relief to the monetary injections. They have surely succeeded not only in reducing the pain of lockdowns, but also in ensuring that demand for goods and services would recover with the supply of goods, that a return normality makes possible.

Judged by the signals provided by the markets in shares, bonds and commodities, the economic crisis is now well behind the developed world. US, emerging market (EM) and therefore South African companies are now worth significantly more than they were when the lockdowns became a reality in March 2020, when the US Index lost 13%, the EM Index 17% and the JSE gave up 27% of its US dollar value. The JSE had lost 14% of its value the month before.

The JSE from these lows has been a distinct outperformer, in dollars and in rands. The JSE has gained 50% compared to a 30% gain for the S&P and EM indices, when converted to rands. In dollars, the gains since the trough are even more impressive. The JSE is up 86% compared to the 66% and 61% gains for the S&P and EM since the crisis lows.

Regularities of a crisis
This indicates one of the crisis regularities for SA. South African assets and incomes are highly exposed to changes in global risk, losing more during a crisis and then gaining more than the average EM equity or bond when the crisis is over. It is also worth noting that the JSE has not moved much since March this year – another sign of normality. If only we had the gumption not to waste a good crisis.

The JSE compared to the S&P 500 and the MSCI EM in rands (January 2020=100) chart

This illustrates another regularity when an economic crisis is not of South African making. The rand is what we call a high beta EM currency – it does worse than its EM peers when risks are elevated and better when global risks decline, as has been the case with the JSE. During the height of the present crisis the rand/US dollar exchange rate and the JSE were 30% weaker compared with EM peers. They are now back to the normal long-term relationship of an average of one to one.

The rand and the JSE – Ratios to EM currencies and equity indices (2008 to 2010 and 2018 to July 2021) charts


Global market risks are easily identified by the volatility of the S&P 500 index, as represented by the well-known volatility index, the VIX. When these daily moves become more pronounced and share prices bounce around abnormally, the cost of insuring against market moves becomes ever more elevated – shares lose value when the future appears much less certain. Higher expected returns, and hence lower share prices, compensate for increased risks. In short, the VIX goes up and share prices go down in a crisis.

Volatility and the S&P 500 (2007 to 2010 and 2018 to July 2021) charts

The daily average for the VIX in the two years before the pandemic was 19 – it was over 80 at the height of both crises. It has recently moved back to 19.

The S&P 500 index is now in record territory in nominal and real terms. In inflation-adjusted terms, the S&P 500 is up about 7.4% a year since the low point of the financial crisis. Real earnings over the same period have grown at an annual average rate of 5.9% since 2009, an above average performance.

Looking for cover
Another regular feature of a crisis is the behaviour of the cover ratio – the normally very close relationship between earnings and dividends. The more cash retained (the less paid out) the more value that is added for shareholders.


The S&P 500 and the cover ratio (earnings/dividends)  (2008 to 2010 and 2018 to July 2021) chart


We make the presumption that the extra cash retained is invested well and earns above its opportunity cost. S&P earnings are again rising much more rapidly than dividends (which held up better during the crises). Indeed, analysts, absent the usual guidance from the managers of the companies they report on, are still struggling to catch up with the buoyant earnings recovery now under way. Earnings surprises are the order of the day.

The cover ratio for the JSE follows a similar pattern in times of crisis and has a similarly negative impact on share valuations. The more companies pay out dividends relative to earnings, the less these companies are generally worth. The recent recovery in cover ratios to something like their longer-term averages is another sign of normality, as well as a support for share prices. Ideally, the JSE cover ratio declines in line with the increase in opportunities to invest in ways that would add value.

SA shows its metal
A further regular feature of the economic crises of recent times and the recovery from them has been the behaviour of commodity and metal prices that make up the bulk of SA’s exports. They fall during a crisis and they recover strongly as the crisis passes by as they are doing now. Metal and mineral prices lead the South African business cycle in a very regular way. Commodity prices lead, the rand follows, inflation is then contained and interest rates, at worst, do not rise. And the money and credit cycles accommodate the rising incomes that emanate initially from the mining sector.

We are far from the super cycle we benefitted from in the lead up to the GFC of 2008. But we can hope that above normal demand for metals will continue to impress itself on below normal supply responses, translating into higher prices.

Industrial commodity prices (2008 to 2010 and 2018 to July 2021) (January 2008=100) chart


While long-term interest rates in SA have recovered from their crisis-driven extremes, they remain discouragingly elevated. Discouraging because they imply high hurdles for capital expenditure budgets to leap over and hence low cover ratios and less cash retained for capex. The gap between short and long-term interest rates, the slope of the yield curve, has moreover remained at crisis levels.

The yield curve implies that short-term interest rates will double within three years. This is a prospect that seems completely out of line with the outlook for the SA economy. We can only hope that the market has got this badly wrong.

The crisis-driven SA economy should not be forced to adjust to higher interest rates. It would be inconsistent with the economic and financial stability that the Reserve Bank is constitutionally charged to secure. It takes much more than low inflation to overcome an economic crisis, as South Africa may still come to recognise.


SA long and short-term interest chart