The problem with much of the data that makes up the GDP is that it is out of date. Knowing how well or badly the economy is now doing becomes a matter of judgment and estimation rather than fact. For example the SA GDP estimates for the second quarter of 2018 (to June) became available only on the 3rd September 2018. Nevertheless despite being after the event they came in less than expected and moved significantly the markets in the rand and RSA debt- and the JSE more generally- sending the rand weaker and bond yields higher and the JSE lower.
The quarterly GDP is but an estimate of total national output and expenditure, based upon sample surveys of the value added by business enterprises, of income earned producing goods and services and expenditure on them. That is when delivered by retailers and others in the supply and demand chains of the economy. These estimates are then revised, sometimes significantly, and often more than once, as more complete estimates become available.
Much of the data that is used to estimate and re-estimate GDP is made available by Stats SA on a monthly basis. For example retail sales or vehicle sales or credit and debt account transactions. But again such important indicators about what has gone on in the economy may also be based on sample surveys that take time to collect that make them out of date. For example the recently released retail sales statistics issued by Stats SA date back to July 2018.
The Reserve Bank in its Monthly Release of Selected Data available on its Web site https://www.resbank.co.za/Publications provides a large number of economic indicators, including leading, lagging and coincident indicators of the Business Cycle. Its coinciding business cycle indicator, based on approximately twelve time series, is highly correlated, as intended, with GDP (converted by ourselves into a monthly equivalent of the quarterly series as we show below) However the latest estimate of this coinciding indicator is for May 2018 and lags behind the GDP data itself making it less than very useful as a guide to the current state of the economy.
Figure 1; Comparing SA GDP with the Reserve Bank Business Cycle Indicator
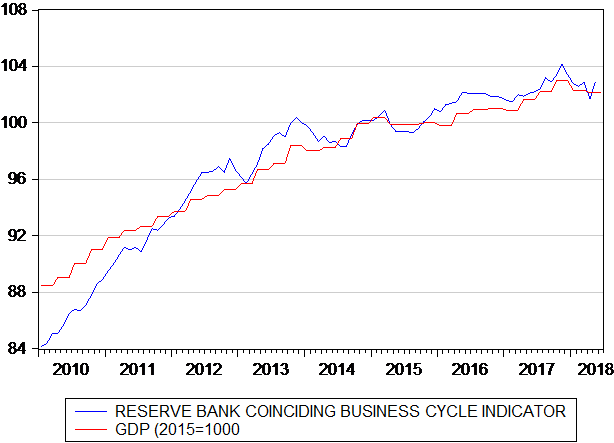
Source: Stats SA, SA Reserve Bank and Investec Wealth and Investment
There are however two very up to date and important economic time series that help reveal the current state of the SA economy. Moreover they are actual hard numbers and not based on sample surveys. These are new vehicle sold to SA buyers – released by Naamsa, the vehicle manufacturers, and the notes and coins issued by the SA Reserve Bank, revealed on the Reserve Bank balance sheet published within seven days of each month end on its web site.
Vehicle sales can be regarded as highly representative of the appetite for durable goods exercised by households and for capex by firms and for the credit used to fund purchases of new vehicles – not only cars that may be rented or leased, but commercial vehicles of all kinds. Cash issued on demand for it by the Reserve Bank is demanded by households to fund their intended expenditure. These demands have a strong seasonal component rising strongly in December and before Easter holidays- that unfortunately for the statistician can come earlier or later complicating the seasonal adjustments. Despite the fast growing exchanges facilitated by credit and debit cards and on-line the demand for cash (and its supply) continues to grow closely in line with economic activity. This makes it very useful as an up to date indicator of current spending that will only be revealed officially much later.
We combine vehicle sales and the real note issue, real cash, giving both equal weight to form our Hard Number Index of the current state of the SA economy. We deflate the note issue by the Consumer Price Index to establish the real supply of cash. This Hard Number Index (HNI) updated to August 2018 is shown below where it is compared with the Reserve Bank Coinciding Business Cycle Indicator (to May 2018)
As may be seen in figure 2 and 3 the two series compare very well. The HNI may be seen to have stabilized with values in the mid 90’s (2015=100) with a slight upward trend. The HNI suggests that economic activity in SA is growing but very slowly and is to some extent recovering from weaker growth of 2016.
No acceleration of growth rates can be inferred from the pace of vehicle sales and real cash in August 2018. The economy appears to be stuck in an extended phase of marginally positive growth. No lift off appears under way a conclusion that would not surprise may observers and participants in the SA economy
Figure 2. The Hard Number Index and the Reserve Bank Coinciding Indicator (2015=100)
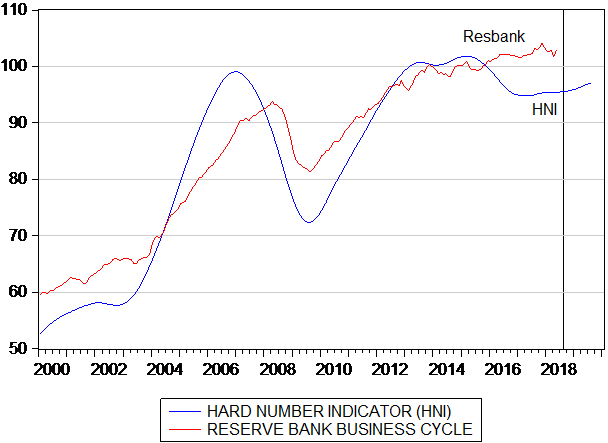
Source: Stats SA, SA Reserve Bank and Investec Wealth and Investment
Figure3: The Hard Number Index and the Reserve Bank Coinciding Indicator 2014-2019 (2015=100)
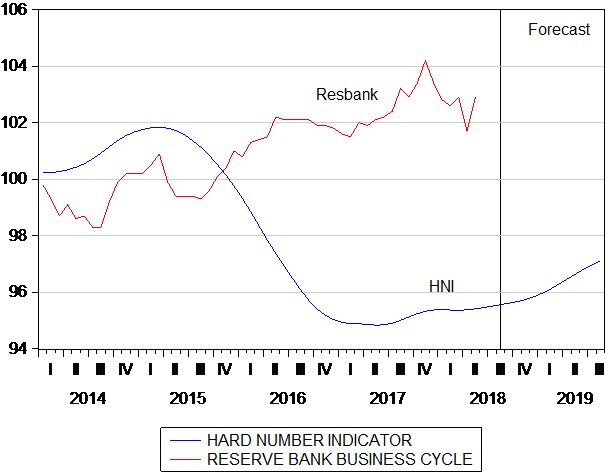
Source: Stats SA, SA Reserve Bank and Investec Wealth and Investment
We show the components of the HNI in figure 4 below and compare the growth in the HNI and the Reserve Bank Business Cycle Indicator in a further chart.
Figure 4; Components of the Hard Number Index (2015=100)
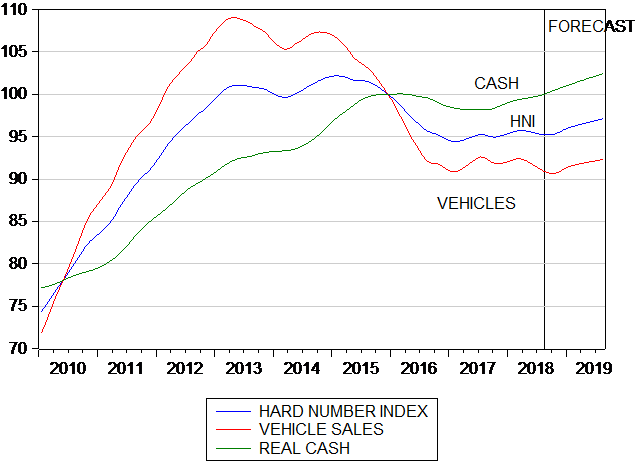 Source: Stats SA, SA Reserve Bank and Investec Wealth and Investment
Figure 5; Growth in the Hard Number Index and the Reserve Bank Business Cycle Indicator
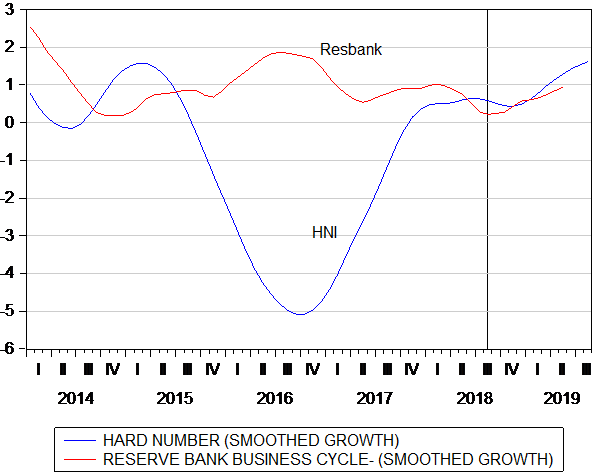 Source: Stats SA, SA Reserve Bank and Investec Wealth and Investment
The retail sales cycle as did the HNI, recovered strongly in late 2017 and have both fallen away since. Retail sales in SA exclude sales of vehicles- new and used as well as of the petrol or diesel used to drive them. This retail recovery was well correlated with a strong pick up (from negative rates) in the real cash cycle. It was lower inflation (particularly of retail prices) rather than an acceleration in the supply of notes that was responsible for this stimulation of demand. It is perhaps encouraging to note that while the retail sales volume cycle has turned sharply down- the real supply of cash continues to grow at a faster rate. (See figure 6 below)
Figure 6; The real retail sales and real cash cycles (smoothed growth)
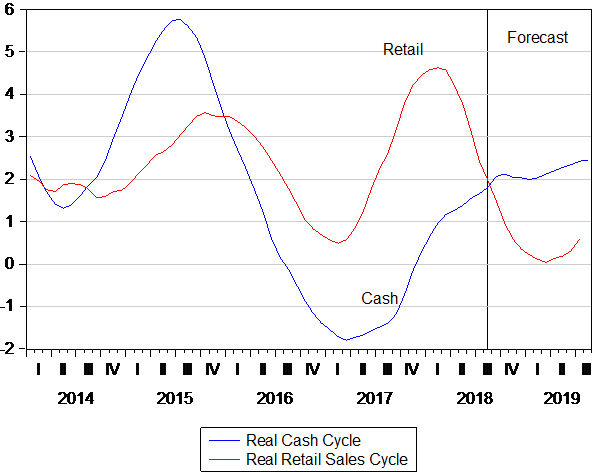
Source: Stats SA, SA Reserve Bank and Investec Wealth and Investment
Were the note issue to be deflated by prices at retail level rather than by Consumer Prices- that include a large measure for administered prices- the real supply of cash would be seen to be growing faster and helping to further encourage sales at retail level. Clearly retailers and their local suppliers are not enjoying much power to raise prices and to pass on cost increases. This pressure on margins is however better news for consumers than firms and helps to sustain their willingness to spend more. We compare headline and much lower retail or what may be described as business inflation in figure 7 below.
Fig 7: Headline and retail price inflation compared
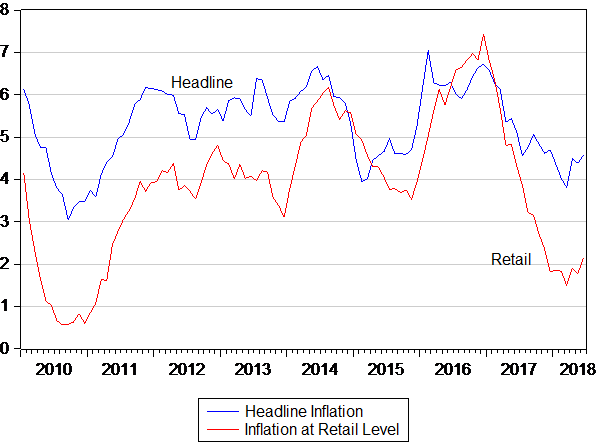 Source: Stats SA, SA Reserve Bank and Investec Wealth and Investment
The outlook for household spending will depend as always on their incomes and their buying power and on the confidence household have in the employment and income prospects. The stronger rand in 2016-2017 helped hold down price increases and encouraged a revival of spending at retail level – especially of durable goods with high import content. But the weaker rand in 2018 has put upward pressure on prices and on operating margins. Hopefully it will not bring higher interest rates with it.
Consumers and the business that serve them must hope for a recovery in the rand to help hold down inflation – even should pressure on margins are relieved to some extent. And hope that lower inflation will bring in due course lower interest rates to add to the disposable incomes (after mortgage payments) of households and their willingness to spend more and borrow more. This is the path to a recovery of demand and supply and to faster growth in GDP.
The exchange value of the rand is only very partially dependent on actions taken in SA. The expected state of emerging economies generally – and so the exchange value of emerging market currencies with the US dollar – will remain decisive for the rand, interest rates and inflation in SA . Should SA come to be seen as more investor friendly than it is now regarded, it would to a degree help the exchange value of the rand and boost the confidence of SA businesses and households in their income prospects and so their willingness to spend and borrow more. As always the Hard Number Index will provide us with advance warning of hopefully improving times for the SA economy. To date the Index indicates that the SA economy is still but marking time