Published Business Day March 10th 2023
Makawber’s principles apply to National as well as household budgets. Expenditure less than revenue equals happiness. Expenditure that consistently exceeds income brings misery. Iin the form of ever rising and more expensive levels of debt, the service of which takes an ever-larger share of the revenue collected and of all expenditure. Paying interest and repaying capital maintains your credit rating -more or less- it does not buy votes.
South Africa has been on this spendthrift path, without pause, ever since the Global Financial Crisis. Since fiscal year 2008-09 to date real government expenditure has grown by an average 3.2% p.a. Government revenues have lagged, growing by an average 2% p.a. after inflation. This extra 1.2% of spending makes a large difference to debt levels over time. Real GDP has grown by an immiserating 1.2% p.a. average since 2009.
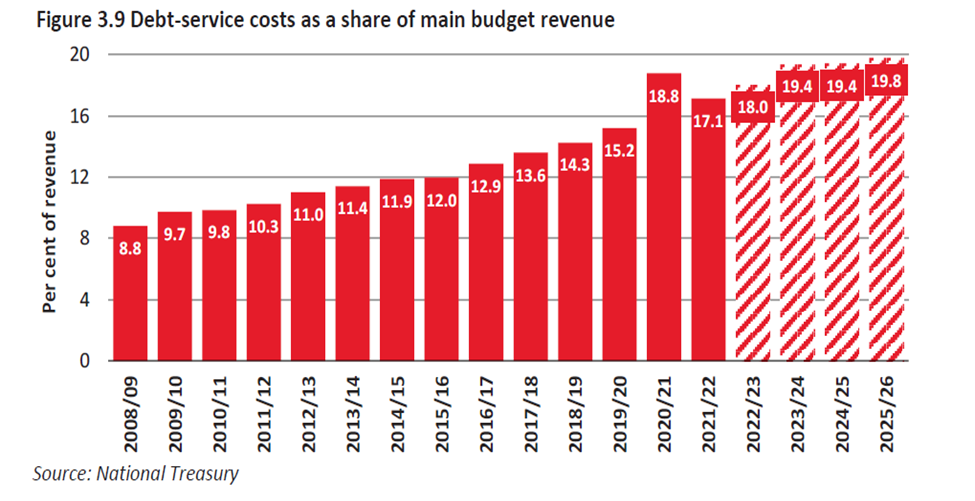
Government debt net of cash was a manageable R483.2b in 2007/8 and equivalent to 20% of GDP. The net debt this past financial year is nearly ten times higher at R4483b and equivalent to over 67% of GDP. Servicing this debt took 8.8% of all government revenue in 2008-09. This share of revenue grew consistently to 18.8% in Covid year 2021 as revenues collapsed with the lockdowns. This depressing ratio fell back to 17.1% in 2021/22 as the inflationary comeback from Covid brought hundreds of billions of extra unexpected taxes from SA mining companies. A mixed blessing as these companies remained reluctant to invest more in SA and so paid more tax.
Not only did the volume of debt incurred rise, but interest rates both paid by the government and by private borrowers also rose well ahead of inflation to compensate investors in SA government and private debt for the dangerous trajectory of our debt. Such trends could easily be extrapolated into a debt crisis and be expected to do so. That if not corrected could lead to a desperate eventual resort to the central bank as a lender of last resort and its money printing press. That is to a default by inflating away the real value of the debts incurred. A not uncommon event in monetary history of the world.
The 2023-04 Budget has made an essential, praiseworthy attempt to reverse the direction of spending and revenue. Over the next three years all government spending is planned to grow by 8.5%, and more slowly than government revenue which is expected to increase by 10.4%. The extra borrowing, the fiscal deficit would then decline from the current 4.2% of GDP to 3.2% by 2025/06 despite very modest expected growth in GDP. If the plans materialize, the debt to GDP ratio will stabilize in the low 70% range and the debt service ratio will be contained below 20% of all revenues. A path to fiscal sustainability has been opened.
The issue of how well or badly the government spends the money collected or borrowed and then allocated across the spending departments and state sponsored enterprises, and how onerous is the tax regime, clearly influence economic growth. Fiscal responsibility of the kind, hopefully to be demonstrated, almost balancing the books, is vitally necessary for economic stability but is not sufficient to the purpose of faster economic growth. It is the larger task for government to get value for taxpayers income it extracts.
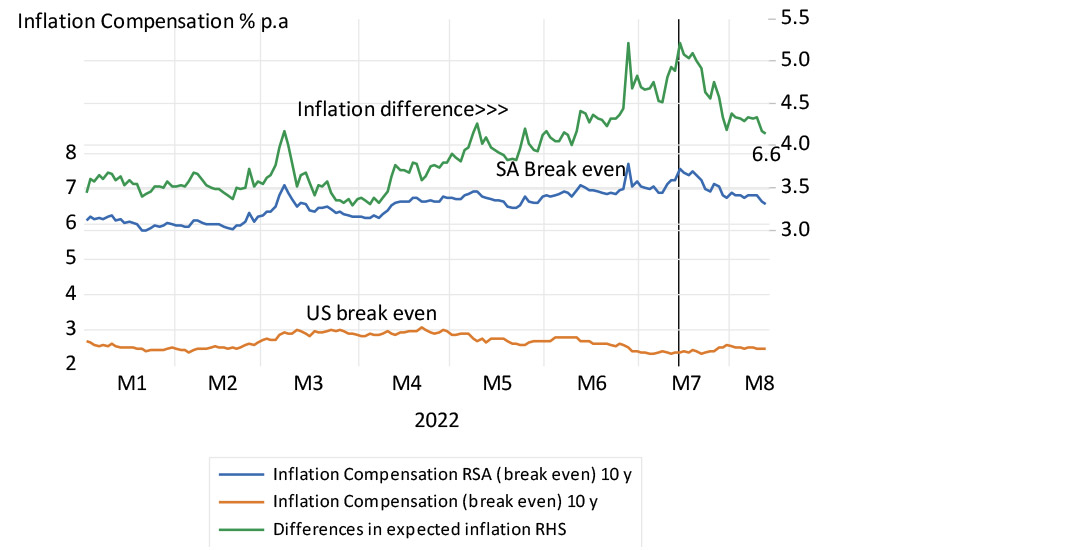
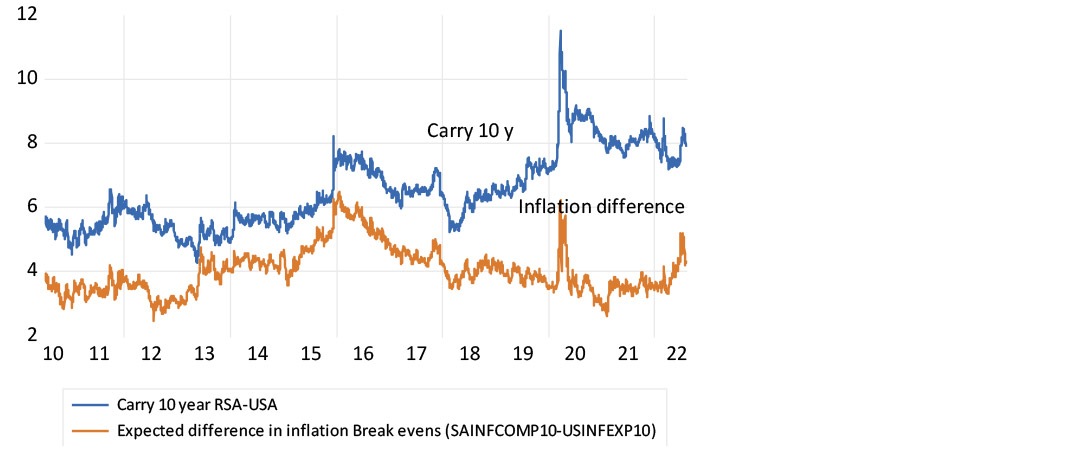
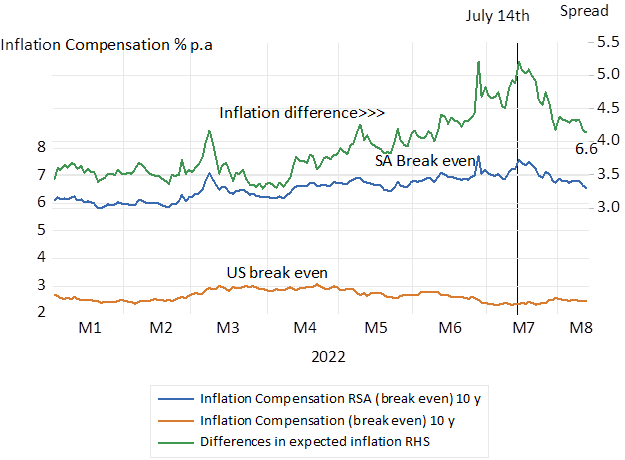
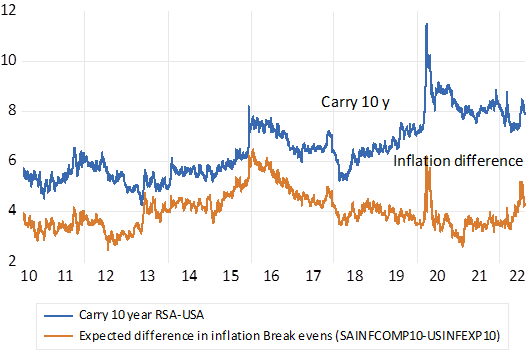
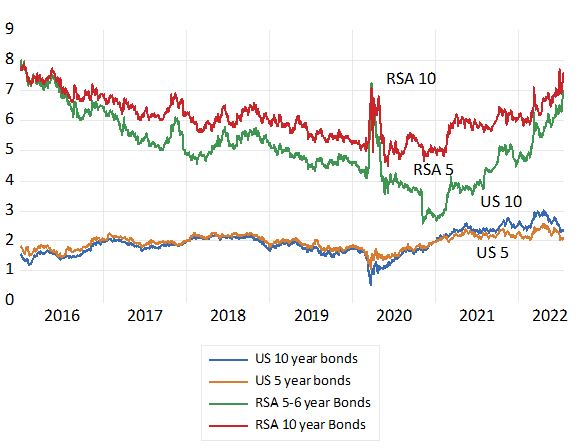
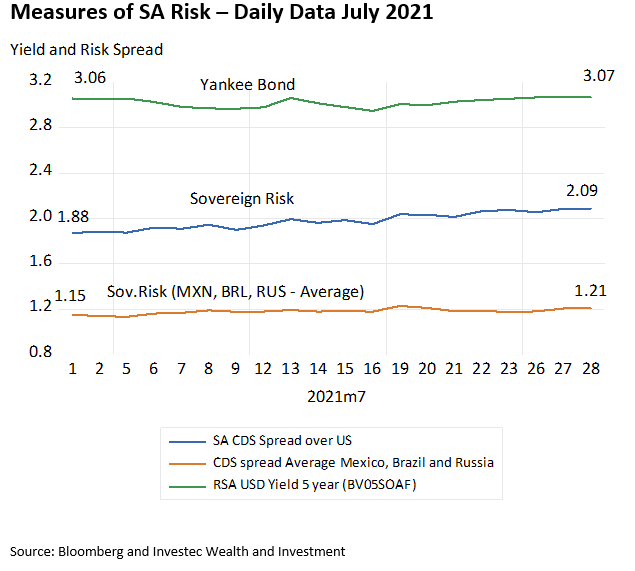
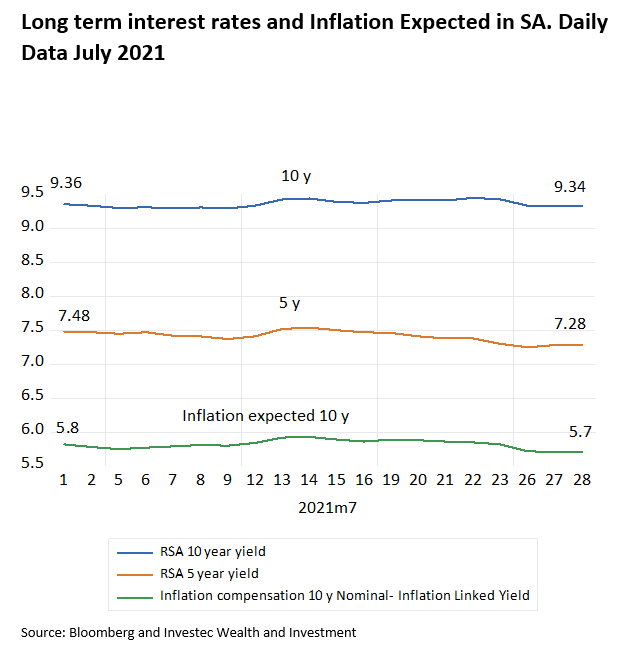
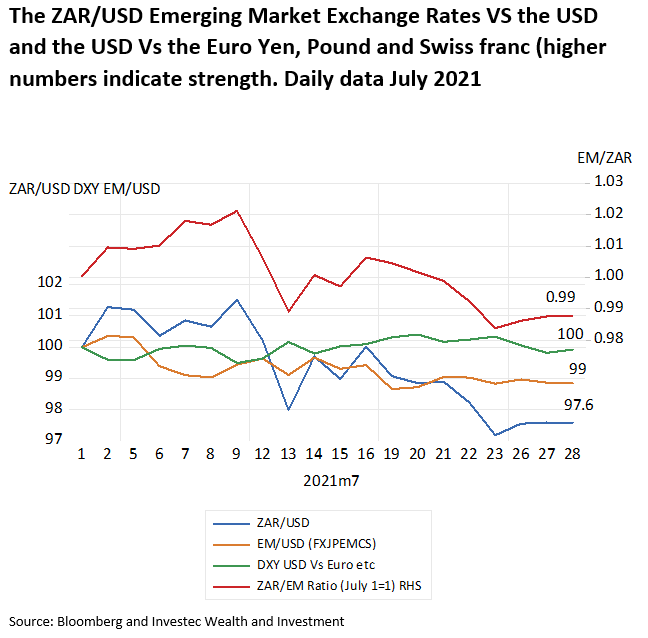
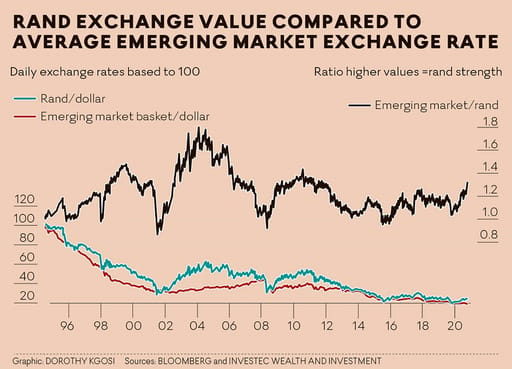
The economic dust seldom settles in South Africa. The Budget was soon overtaken by De Ruyter’s last stand. Yet judged by the muted reactions in the financial markets the Budget did little to change what we pay to raise capital, public and private. RSA 5 year bonds still yield well over 9% p.a. or a very expensive real 5% p.a. after expected inflation of 5.5% p.a. Judged by the difference between RSA and USA Bonds, the rand is still expected to weaken – by a punishing 5% p.a. over the next five years and about 7% a year on average over the next 10 years. SA dollar denominated, 5 year debt, now yields 6.56% p.a. representing a default risk premium of 2.3% p.a. and more than double investors in Mexican debt pay for the same insurance. Clearly the market and the economy need much more convincing that we have permanently changed our ways.
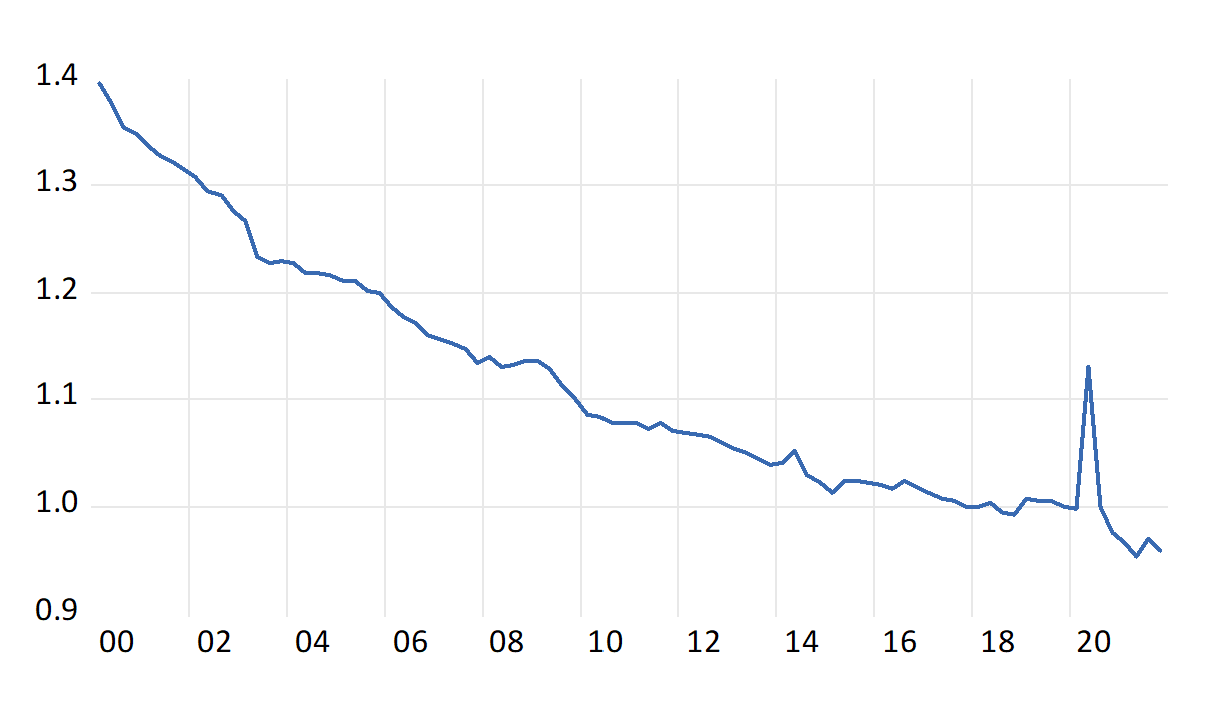
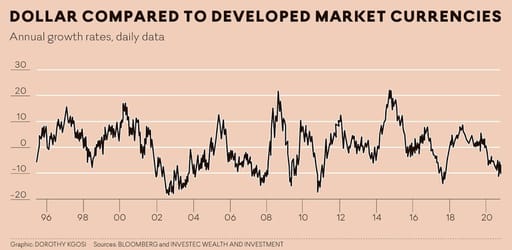
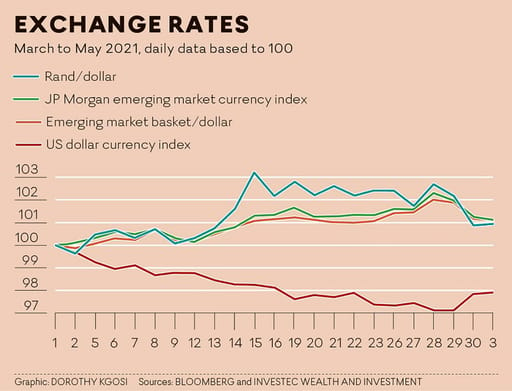
Measures of SA Risk; Daily Data 2022- 2023.
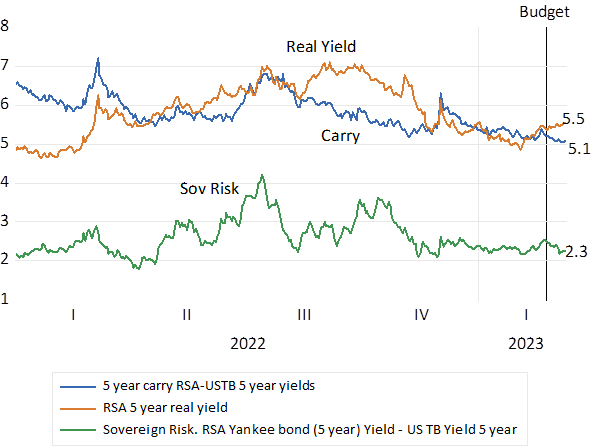
Source; Bloomberg and Investec Wealth and Investment