Distinct Aptitudes for Creative Contribution in a Complex World
by Etienne van der Walt
with an introduction by Brian Kantor
Introduction- the Nature of the Business Enterprise
by Brian Kantor
The behaviour of the modern firm can be understood in the simplest of terms: every enterprise competes for a share of the household budget. Out of this struggle for consumer attention and limited spending power flows the entire logic of business decision-making—investment, research, marketing, training, and the perpetual search for efficiency.
Firms that succeed are those able to learn quickly which practices work, and to abandon those that do not. They thrive on pattern recognition, on imitation of what proves profitable, and on the courage to innovate when established methods falter. Competition, whether between shops on a high street or among global technology giants, ensures that the search for better methods never ceases.
Some of these improvements are incremental: a more efficient supply chain, better training for staff, sharper marketing. Others are revolutionary, altering not just the fortunes of one firm but the very way households live and spend. The Industrial Revolution provides a clear illustration. The contributions of James Watt to the steam engine, George Stephenson and Richard Trevithick to locomotive power, or Henry Cort to iron production were not simply scientific advances. They were practical, applied innovations that reshaped an economy and a society. Thomas Edison in the United States epitomised the same principle: a relentless adapter who turned available science into usable systems, transforming electricity from a curiosity into a foundation of modern life.
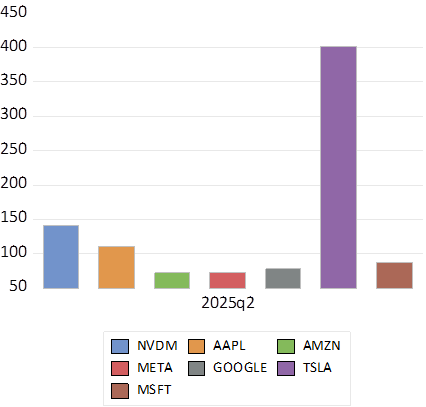
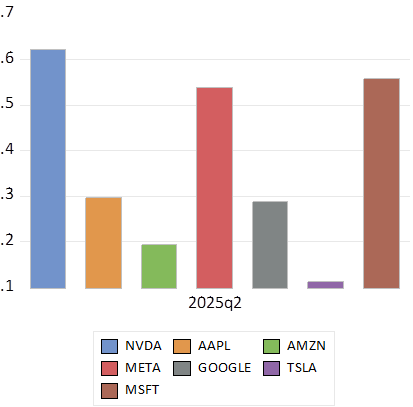
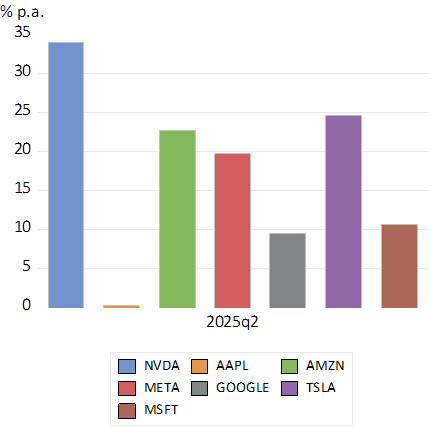
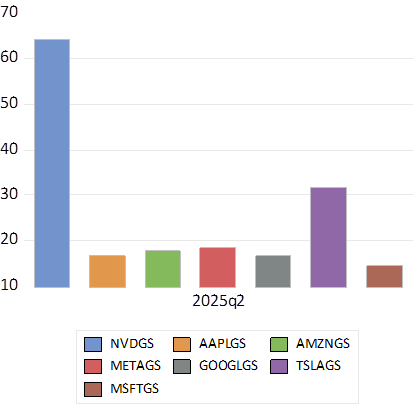
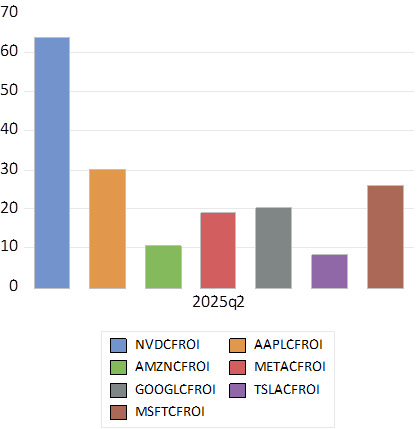
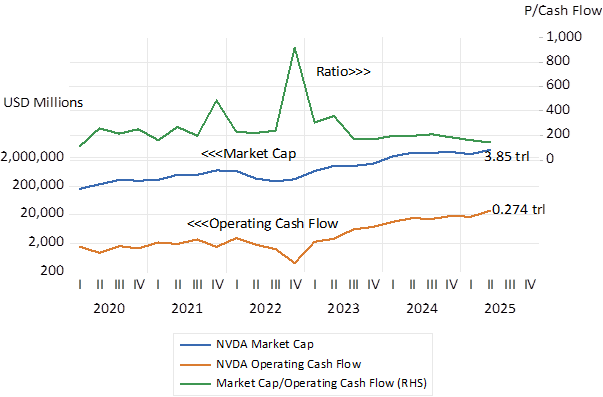
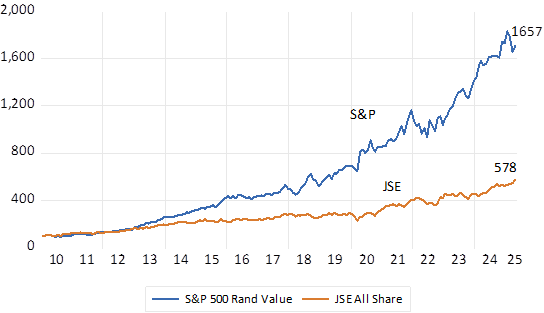
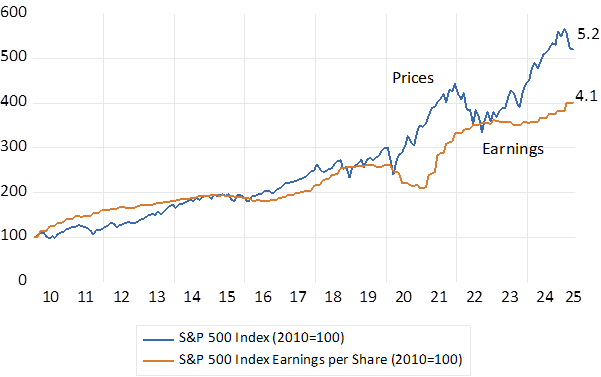
We live through an equally striking transformation today. The so-called “Magnificent Seven” firms—Microsoft, Amazon, Apple, Nvidia, Google, Meta, and Tesla/SpaceX—
began as fragile startups with little more than ideas about how to compete in the digital age. They now account for over 30% of the S&P 500 Index and collectively represent trillions of dollars of market value. Their founders—Gates, Bezos, Jobs, Cook, Huang, Page and Brin, Zuckerberg, Musk—have joined the pantheon of history’s most influential entrepreneurs. Their success illustrates not only the power of entrepreneurship but also the extraordinary returns available to those who anticipate the future needs of households and businesses.
Such stories rightly inspire admiration, but they should not obscure the reality that most startups fail. Entrepreneurship carries risk, often at great cost to founders and investors. The United States has been especially well served by a culture of risk-taking and angel investment, where deep pools of capital are available to back bold ideas. This willingness to accept failure as part of progress is a distinctive advantage of the American economy.
Can entrepreneurship be taught? I have always been sceptical. The entrepreneur is more often born than manufactured. Yet education can play a vital role in preparing minds to see possibilities, to ask the right questions, and to imagine lives that would otherwise remain closed. Innovation is not only the province of heroic founders; it is equally the work of competent managers, motivated employees, and adaptive organisations that encourage creativity at every level.
In the end, the system benefits from both types of contribution: the revolutionary breakthrough and the steady flow of incremental improvements. Together, they sustain the great process of adaptation that drives economic growth.
It is in this larger story that Dr. Etienne van der Walt’s reflections should be read. He shifts our gaze from the balance sheet to the biology, from the competitive firm to the adaptive human mind. His essay explores inventors, innovators, and entrepreneurs not only as economic actors but as expressions of human adaptive intelligence. By situating entrepreneurship within the broader logic of living systems, he offers a perspective that complements economic history with biological depth.
The economy, after all, is a living system of its own. Its vitality rests on the creativity of individuals, the resilience of organisations, and the constant adaptation to an ever-changing world
Distinct Aptitudes for Creative Contribution in a Complex World
Etienne van der Walt
The Misunderstood Triad of Contribution
We live in an era where innovation has become a sacred word.
From boardrooms to classrooms, the message is clear: be agile, be disruptive, think outside the box, start something. Entrepreneurship is celebrated as one of the highest forms of economic and creative expression. Governments build accelerators, schools run pitch competitions, and social media rewards founders who hustle harder and fail faster.
But beneath this glossy narrative lies a quieter truth, one that many people feel but few articulate:
Not everyone is wired to be an entrepreneur.
Not all creativity takes the form of startups.
And not all contribution begins with disruption.
I believe that in our rush to democratize innovation, we may well have flattened three profoundly different ways of creating value. The inventor, the creative innovator, and the entrepreneur are not interchangeable roles. They may sometimes co-exist within one individual, but more often they live in distinct people, each with their own cognitive architecture, motivational signature, and innate aptitudes.
To confuse these roles is more than a semantic mistake, it’s a systemic one.
It leads to misaligned career paths, increased chronic stress and burnout, dysfunctional teams, and education systems that try to train people for roles they were never built to play. Worse, it dilutes the unique contribution of those whose gifts lie elsewhere, people who might invent quietly in solitude, or recombine ideas across disciplines without ever launching a product, or who might master execution without the need to originate anything new.
This paper is a call to restore nuance.
It’s a call to understand the biology of contribution, to recognize that while skills can be taught, gifts matter. And those gifts, when honoured and aligned with the right context, lead to exponential outcomes, for individuals, teams, and systems.
We propose a simple but powerful distinction between three archetypes of high-value contribution:
- The Inventor – the deep specialist who generates novel mechanisms or ideas, often from within a specific domain
- The Creative Innovator – the sense maker who recombines across disciplines to solve meaningful problems
- The Entrepreneur – the executor who brings solutions to market with scale, structure, and speed
These three roles overlap in places, but their roots, trajectories, and energetic expressions are distinct. By examining them closely, and by exploring the innate aptitudes that underpin them, we can begin to design a more intelligent approach to talent development, team formation, and education for the future.
Because the future doesn’t need more generalized pressure to “innovate.”
It needs more people doing what they were born to do, at the intersection of their natural gifts and cultivated strengths.
The Problem with the “Everyone is an Entrepreneur” Myth
There is a seductive narrative alive in our culture, one that says anyone can be an entrepreneur, and everyone should try. It’s told in classrooms, in keynote speeches, in startup incubators, and increasingly in the minds of young people trying to prove their worth through disruption.
This message is often well-intentioned. It aims to democratize opportunity, to foster resilience and creativity, to equip people with agency in a volatile world. In truth, there is real value in teaching the skills of entrepreneurship, opportunity recognition, problem framing, prototyping, storytelling, execution. These are powerful tools for any life path.
But somewhere along the way, the tool became the identity.
Entrepreneurship was no longer something you could do, it became something you were expected to be.
The result is a kind of ideological pressure: a cultural insistence that everyone must think like a founder, act like a builder, and pursue scalable ventures as the ultimate form of success. Even institutions that once honoured diverse kinds of contribution, universities, research institutes, public health bodies, now frame impact almost exclusively through the lens of entrepreneurial scale.
But there’s a hidden cost to this flattening.
It misrepresents the diversity of human creative potential. It pressures people with non-executive temperaments, those who thrive in deep focus, solitude, or quiet integration, to perform in roles that are unnatural to them. It fuels burnout, imposter syndrome, and wasted effort when individuals are coached to run a race that doesn’t match their stride. And it distracts teams from the deeper intelligence of complementarity, the reality that great ventures are built not by uniform founders, but by diverse minds playing different parts.
This problem is especially acute in education.
When entrepreneurship is treated as a universal prescription, we begin misdiagnosing the developmental needs of young people. Not every child is a born hustler or market-scaler. Some are quiet recombiners. Some are deep thinkers. Some are systems stewards. When these archetypes are ignored, students begin to believe that unless they can “found something,” they have failed to contribute.
But biology doesn’t work that way.
Nature favours specialization within systems. In every living organism, and in every intelligent team, different cells, roles, and intelligences co-exist. The neuron doesn’t envy the immune cell. The liver doesn’t try to become the brain. Each plays its part in service of a larger intelligence.
The same is true of contribution in human systems.
We need inventors who go deep, innovators who connect across, and entrepreneurs who bring the vision to life.
To pretend these are all the same person is to commit a category error.
To build systems that force everyone into the same mould is to commit a moral one.
The Three Archetypes – A Distinction That Matters
It is tempting to view invention, innovation, and entrepreneurship as steps in a linear process: invent something new, innovate a use for it, then build a business to scale it. But this linearity oversimplifies the deeply distinct nature of the minds behind each role. These are not stages of a project. They are archetypes of contribution, each with its own gifts, motivations, and natural modes of cognition.
By understanding the differences, we gain clarity not only about the creative process, but about how to align people with roles where they are most likely to thrive.
1. The Inventor – The Deep Specialist of the Hidden Layer
The inventor is the one who descends into the vertical shafts of knowledge and returns with something never seen before. They are not always solving a problem, they are often solving a puzzle, one that only becomes apparent as they deepen into a specific field or phenomenon.
Their intelligence is focused, recursive, and structurally generative. It is not breadth they seek, it is depth. They may move across multiple domains, but only after mastering the logic of each. Their breakthroughs come from technical decomposition, not broad recombination. In many cases, the inventor works alone, not by preference, but by necessity. Their work often demands solitude, immersion, and an internal rhythm that resists interruption.
The inventor’s gift is vertical pattern recognition.
They see what others miss by looking longer and deeper.
Innate Aptitudes:
- Persistent focus
- Tolerance for ambiguity and failure
- Internal reward sensitivity (curiosity > external validation)
- Depth-memory and recursive abstraction
- High need for solitude and self-direction
Cognitive Structure:
The inventor builds within domains, assembling mental models like intricate machines. Their neural bias favours within-network depth, less reliant on horizontal integration across systems. This makes them brilliant in closed loops of understanding but sometimes disconnected from broader application.
Typical Shadows:
- May struggle to communicate value
- Can become stuck in perfection loops
- Risk of under-valuing timing, relevance, or usability
- Disconnection from market or team logic
Representative Examples:
- Nikola Tesla
- Tim Berners-Lee
- Barbara McClintock
- Marie Curie
The inventor’s contribution is often years, or decades, ahead of its time. But without the right collaborators or context, it may remain a brilliant whisper rather than a resounding change.
2. The Creative Innovator – The Sense maker at the Edges
If the inventor descends, the creative innovator moves laterally, from silo to silo, weaving meaning at the margins. Innovation happens not through depth alone, but through connection. These individuals are alert to resonance: between ideas, disciplines, metaphors, and moments in time. They thrive in borderlands, where two ideas meet, clash, or reveal something new.
Unlike the inventor, the creative innovator is not always interested in origin. They are interested in integration. Their contribution is often invisible at first, it arrives through reframing, bridging, or combining existing elements in a way that makes something feel inevitable in hindsight. This is not technical novelty, it is contextual creativity.
The creative innovator’s gift is pattern recombination.
They see what others miss by sensing what matters now and weaving it into something new.
Innate Aptitudes:
- High salience sensitivity
- Conceptual flexibility
- Narrative cognition and metaphorical thinking
- Empathic resonance across disciplines
- Tolerance for ambiguity and complexity
Cognitive Structure:
Their brain acts like a network bridge, flexibly switching between the Default Mode Network (imagination, abstraction), the Salience Network (what matters now), and the Executive Control Network (goal setting, framing). Innovation emerges not from sustained focus, but from sensitive navigation of relevance and meaning.
Typical Shadows:
- Can over-index on conceptual elegance at the expense of delivery
- May lack executional patience
- Risk of being misunderstood in highly linear or hierarchical environments
- Vulnerable to burnout from overstimulation or constant integration
Representative Examples:
- Leonardo da Vinci
- Maya Angelou
- Steve Jobs
- Brené Brown
Creative innovators are often mistaken for generalists. But in truth, they are specialists in interconnection. Their genius lies in reconfiguring the world so that others can see its meaning more clearly.
3. The Entrepreneur – The Orchestrator of Action and Scale
The entrepreneur is not defined by what they invent or reframe. They are defined by what they build. This is the person who takes a seed, an idea, a prototype, a flash of insight, and turns it into a vehicle that moves through the world. Entrepreneurs are not only motivated by value, but they are also wired to deliver it. They see potential in things, but they also see paths, obstacles, timing, and opportunity.
Their gift is not simply execution. It is orchestration under uncertainty. While others may hesitate, the entrepreneur moves. While others wait for clarity, the entrepreneur tests, adapts, and scales. Their energy is contagious, their momentum, catalytic. And they are at their best when leading people toward a shared outcome, not just through vision, but through structure.
The entrepreneur’s gift is applied systems design.
They see what others miss by moving faster, testing earlier, and executing more persistently than most could tolerate.
Innate Aptitudes:
- High goal orientation
- Dopaminergic drive and tolerance for risk
- Fast decision-making under uncertainty
- Energy throughput and social pattern recognition
- Adaptive leadership and strategic focus
Cognitive Structure:
The entrepreneur’s cognition privileges applied relevance over abstract elegance. Their mind naturally integrates salience, strategy, and reward feedback. They’re less concerned with whether something is novel or beautiful, more concerned with whether it works and can scale. Their networks fire toward action.
Typical Shadows:
- Can devalue depth or nuance
- May neglect internal sustainability (their own or their team’s)
- Risk of confusing speed with substance
- Vulnerable to founder over-identification or burnout
Representative Examples:
- Elon Musk
- Oprah Winfrey
- Richard Branson
- Melanie Perkins
Entrepreneurs bring ideas to life, and then ensure they stay alive. Without them, innovation dies in the lab. Without their complementary partners, it may scale too quickly and burn out. Their genius is motion, energy, and alignment with need.
Together, these three archetypes form a living system of contribution.
None is superior. Each is vital. And in the world we’re building, marked by increasing complexity, interdependence, and rapid change, we need to move beyond the myth of the solo genius. We need to understand how these distinct roles can be seen, honoured, and supported within individuals and teams alike.
The Role of Aptitude – What Can Be Trained, What Must Be Honoured
If the previous section clarified the difference between inventors, creative innovators, and entrepreneurs, this section addresses the natural next question: Can anyone become any of these things with the right training?
The short answer is: yes, but not equally, not easily, and not always wisely.
We live in a world where the line between potential and pressure has blurred. We are told that with enough grit, exposure, and instruction, anyone can become anything. While this may be motivationally useful, it is biologically incomplete.
The truth is that skills can be taught, but gifts must be honoured.
In the realm of invention, innovation, and entrepreneurship, this distinction is critical. Each of these archetypes draws on a different constellation of innate aptitudes, neurobiological, psychological, and motivational traits that shape how a person naturally processes information, tolerates ambiguity, manages energy, and responds to feedback.
These aptitudes aren’t fixed like destiny, but neither are they neutral.
They set the stage for natural ease of development, for how quickly and deeply a person can enter the mode of contribution that each archetype demands.
Aptitude ≠ Skill
Let’s be clear: aptitude is not skill.
Aptitude is potential energy, the inherent capacity to grow in a certain direction with less friction and greater flow. Skill is applied competence, what someone can do reliably and effectively through learning and experience.
A person can have aptitude without skill (early talent, undeveloped), and they can develop skill without aptitude (through grit, structure, or necessity). But the most sustainable, high-performance contribution happens when the two align, when talent is cultivated in the direction of gift.
This is the difference between performing and thriving.
Why Aptitude Matters in High-Stakes Roles
When the demands of a role are high, when the complexity is nonlinear, the pace is intense, and the outcomes are uncertain, aptitude becomes the limiting factor. You can teach the steps of a pitch deck or a design sprint. But you can’t teach someone to feel instinctively energized by ambiguity, or to tolerate prolonged solitude in a mental tunnel, or to see emerging patterns across disciplines under pressure.
These are neurobiological endowments. They live in the architecture of personality, motivation, attention, and salience processing. They can be nurtured, yes, but not manufactured wholesale.
Ignoring aptitude leads to:
- Misaligned career trajectories
- Burnout from role–person mismatch
- Team breakdowns due to hidden assumption gaps
- Wasted development efforts chasing the wrong kind of excellence
From Talent Cultivation to Contribution Matching
A more intelligent system doesn’t try to turn every student into an entrepreneur, or every team member into an innovator. It asks:
Where does this person’s innate potential lie?
How can we cultivate that into mastery, without forcing them into someone else’s template?
This is what we call contribution matching:
The art of aligning a person’s energetic design to a domain of value creation that fits.
This means:
- Placing a high-aptitude inventor in an R&D setting with long feedback loops
- Giving a creative innovator space to connect silos, reframe problems, and advise across functions
- Allowing an entrepreneur to build systems, respond to need, and drive toward value without being shackled to perfectionism
It’s not about limiting people. It’s about liberating them, into the roles where their gifts create the greatest yield, with the least unnecessary suffering.
Why the Aptitude Matters Now More Than Ever
In complex adaptive systems, from organizations to societies, we do not thrive by standardizing minds. We thrive by differentiating contribution and weaving it into collective value.
The future will require not just more entrepreneurs, but also:
- Inventors who go deeper
- Innovators who integrate more wisely
- Collaborators who know how to play their part with pride and precision
Through emphasizing aptitude, we attempt to honour this logic, to make contribution visible, measurable, and integrated. It helps shift us away from the question, “How can I be like them?”
And toward the more vital question:
“Where does my energy belong, and how do I build the skills to bring it fully to life?”
Implications for Education, Leadership, and Policy
If we accept that invention, innovation, and entrepreneurship require different aptitudes, and that these aptitudes can be observed, cultivated, and mapped, then the implications stretch far beyond individual coaching or team design.
They touch the foundations of how we educate, how we build organizations, and how we structure incentives and support systems at scale.
1. Education: Teach Broadly, Develop Precisely
Education systems are increasingly embracing “entrepreneurial thinking” as a blanket goal, from grade school through to university. While this exposes students to valuable skills, it risks conflating exposure with identity. Not every student is a builder, and that’s not a flaw.
What we need instead is:
- Early exposure to all three archetypes, so students can explore which energies resonate
- Tools to measure aptitude helping students self-identify their natural leanings
- Custom development tracks that support:
- Inventive depth for domain specialists and technical thinkers
- Integrative thinking and sensemaking for cross-disciplinary students
- Applied venture-building for action-oriented leaders
By doing so, we move from one-size-fits-all to one-purpose-fits-you.
2. Leadership: Design Teams Around Complementary Aptitude
Leadership today requires more than charisma or decisiveness. It requires systems literacy, energetic awareness, and talent orchestration. The best leaders know how to:
- Identify what kind of contribution a person is wired to give
- Design roles that fit natural architecture, not arbitrary job descriptions
- Build teams where each person’s genius makes the others better
This means moving away from performance models that measure output without understanding orientation.
Leaders who measure aptitude can:
- Spot invisible friction between roles and people
- Reduce misalignment that causes burnout or stagnation
- Create cultures where everyone feels useful, and seen
In this model, leadership becomes not a position of power, but a function of biological intelligence in action.
3. Policy and Public Investment: Fund the System, Not the Stereotype
Public funding for innovation often leans toward visible entrepreneurs, pitch decks, MVPs, and venture-readiness. But true innovation ecosystems thrive when all three archetypes are supported.
This calls for:
- Long-cycle investment in deep invention and research, even without immediate marketability
- Cross-sector hubs that allow creative innovators to reframe and integrate across silos
- Seed-stage support that includes mental health, coaching, and capacity-building for entrepreneurs, not just capital
Imagine if startup ecosystems were designed not as winner-take-all contests, but as living systems of complementary minds.
Imagine policy frameworks that rewarded not only scale, but precision of contribution.
In such a world, we would stop trying to turn inventors into hustlers or innovators into founders and instead build bridges of mutual empowerment.
A Word for Startups – Building the Fleet Before You Burn Out
The startup world is rich in energy but often poor in design. Founders are expected to be visionaries, inventors, operators, marketers, and therapists, all in one. And while resource constraints may make this multitasking unavoidable at first, it is a dangerous myth to believe it’s sustainable.
Too many early-stage ventures fail not because the idea is weak, but because the founder is stretched across roles they were never designed to play. They try to drive innovation, generate product–market fit, and build scalable systems, alone or with ill-fitting support. It feels like a focus problem. In truth, it’s a structure problem.
Founders often say, “I just need someone to help me focus.” But this request can be misleading. It’s not about focus, it’s about alignment of function to innate contribution. What they’re really saying is: “I’m trying to carry the entrepreneurial function, but I’m wired more like an innovator or inventor.”
This is where measuring aptitude may offer its most practical guidance.
As early as viably possible, founders should build their core team around differentiated aptitudes, not just skill sets, but energetic architectures.
In other words:
- Don’t hire clones of yourself.
- Don’t outsource critical roles to people who are merely available.
- Instead, structure your venture like a fleet.
The Startup Fleet Model
Every high-functioning early-stage venture is not one ship, it’s a fleet of smaller ships, each captained by a different archetype:
- The Inventor ship dives deep, exploring the mechanism, refining the model, building the underlying system.
- The Creative Innovator ship moves laterally, reframing, integrating, and making meaning across silos and markets.
- The Entrepreneurial ship sails outward, navigating risk, validating fit, and orchestrating execution at speed.
If all three ships are captained by one person, the fleet will eventually stall, or worse, break apart.
Instead, we call on startups to:
- Use the first viable capital infusion not just to hire more hands, but to build the full cognitive and energetic spectrum of the venture
- Identify which of the three aptitudes the founder naturally leads from
- Then deliberately bring in partners or leads who can carry the other two roles as captains, not as subordinates
This is not a luxury. It is a design principle.
Too many startups fail because they believe execution is the only success function. Or because the founder, brilliant in one domain, keeps being told to “just focus” when their mind is built for conceptual navigation, not constraint repetition.
This article aims to provide a diagnostic language to build smart from the start, to anticipate where burnout will emerge, where misalignment will erode performance, and where synergy will allow the fleet to move as one.
This doesn’t mean that every startup will have a full archetypal team on Day 1. But it does mean that:
- Founders can lead with clarity, knowing their strengths and where they will need reinforcement
- Investors and advisors can support constructively, by scaffolding around aptitude gaps instead of pushing founders into unnatural roles
- Teams can be designed to scale with integrity, not just urgency
In a world where everyone is told to be everything, the smartest founders are now learning to ask:
What am I naturally gifted at, and who do I need beside me to complete the system?
Because startups are not solo journeys. They are fleets of differentiated minds, navigating uncertainty toward shared value.
The sooner we acknowledge that, the sooner we build ventures that last, not just in scale, but in soul.
Conclusion – Contribution with Clarity, Ventures with Integrity
Invention, innovation, and entrepreneurship are not interchangeable terms. They are distinct expressions of human intelligence, shaped by different aptitudes, driven by different forms of curiosity, and brought to life through different patterns of work and energy.
In this article, we’ve offered a new framing:
The Triadic Aptitude Matrix, a model to identify and align the natural architecture of contribution across three core archetypes:
- The Inventor: deep, recursive, focused on novel mechanisms
- The Creative Innovator: integrative, reframing, tuned to timing and context
- The Entrepreneur: action-oriented, scalable, execution-driven
What we’ve argued is simple but often forgotten:
People thrive not when they are told what to become, but when they are empowered to become what they already are, more fully.
This shift, from uniform expectation to differentiated design, has far-reaching implications. For education, it invites us to teach for clarity of contribution, not just for general skill acquisition. For leadership, it opens the door to complementarity over conformity. For policy and investment, it encourages us to build ecosystems that support the full value chain of creativity, not just its most visible expressions.
And for startups, where energy is precious and failure is unforgiving, it offers a simple but profound correction:
Don’t try to be the entire system.
Build the system.
Find the others.
Create the fleet.
Because in a world of increasing complexity, we don’t just need more entrepreneurs.
We need inventors with space, innovators with trust, and builders with direction.
We need teams designed from the inside out, ventures that scale without distortion, and futures built on the deep integrity of matching what we are with what we do.
When we get this right, we don’t just accelerate success.
We liberate it, into its most beautiful, useful, and sustainable form.