If not now, then when?

We have heard the same story before from the Reserve Bank MPC. With every reason to cut rates to improve the growth outlook and to alleviate the risks of slow growth (as highlighted recently by Moody’s), the MPC again stood pat as it has done since November 2010, when it last cut rates in surely very different and less propitious circumstances.

Yes, as we are constantly reminded, the inflation rate remains stubbornly high despite the recognised weakness of domestic demand. But what is not acknowledged is that the inflation rate is beyond any predictable influence of the Reserve Bank. This fact of economic life is simply ignored by the MPC which employs a highly flawed theory (that enjoys no empirical support whatsoever from the SA evidence) of the forces that have driven inflation in SA over the past 10 years. The MPC appears simply not up to the intellectually demanding task of adapting its highly conventional theory of inflation to recognise its anti-inflationary impotence or the seriousness of the slow growth outlook. Its responsibility is to do what it can for growth (which is all the Reserve Bank can realistically hope to do), that is, influence the domestic growth rate with its interest rate settings so that it may better fall in line with potential growth.

The fact is that the exchange rate drives inflation in SA and the exchange rate is dominated by highly unpredictable global forces beyond the influence of SA monetary policy. Inflationary expectations have remained highly stable in SA and only modestly influenced by inflation itself. Any possible feedback from more inflation expected to more inflation has clearly not been in evidence. Moreover there has been no predictable impact of changes in policy determined interest rates on the exchange value of the rand. Therefore it should be recognised that while interest rate settings influence the level of aggregate demand in SA, the links between changes in aggregate demand and inflation have been overwhelmed by exchange rate changes (and will continue to be so overwhelmed). In the same way, any possible influence on the inflation rate of inflationary expectations will be overwhelmed by unpredictable exchange rate developments and to a lesser extent by global food and commodity prices. The so called second round effects on inflation are but an article of faith for the members of the MPC. Good monetary policy takes more than faith in conventional and also flawed theories of inflation.

This is a disappointment. We had hoped for better from Governor Marcus – but we are inclined to the view that we should not now expect a more growth sensitive approach from her and her committee.

It is very hard to anticipate the change in circumstances that could lead to a rate cut anytime soon. If not now then when? The inflation outlook will remain unchanged (absent of any important reversal in the rand) that can only come with an improved global growth outlook that in itself would reduce the argument for lower rates. And so we can anticipate an extended period of sub-optimal growth, inflation at or about the upper band of the target range – and thus an extended period of interest rates at current levels. Brian Kantor
SA economy: Moody’s can do some good

The mood may have changed even if the SA economic facts have not. But the Moody’s negative watch can do SA good without doing any harm.

Moody’s has raised legitimate concerns about the risks facing economic policy makers in SA that will resonate strongly with observers not only outside but also inside government circles. The question one would have to ask is what is especially new about these threats to SA political and economic stability. Perhaps the Moody’s decision to put SA’s credit rating on negative watch tells us more about the changing world of credit and especially for credit rating agencies than it is does about the direction of SA economic policy. What is clearly especially galling to the Treasury is that Moody’s appears to have been unimpressed by the strong affirmation of the conservative fiscal policy settings outlined by Finance Minister Gordhan in his speech to Parliament in October backed up in his recently issued Medium Term Budget Policy Statement. The government has planned to maintain the ratios of government revenue and government expenditure to GDP, to reduce debt to GDP ratios and to give greater impetus to capital formation rather than improved benefits for those who work for or depend on government.

The populist threats to the conservative setting of fiscal policy or the all-important role played in the economy by privately owned businesses, both domestic and foreign, are not new and will remain an ever present in SA, as they will almost everywhere else (Switzerland perhaps excepted and Wall Street Masters of the Universe not excluded) . The greatest risk to stability in SA is slow rates of economic growth that frustrate ambitions of individuals and firms and the financial capacity of the public and private sectors. This can lead to attempts at quick fixes by politicians.

The rating agencies have long been very well aware of these dangers to the impressive conservative fiscal and monetary policy directions taken by the new SA. Aware enough, that is, to have made SA’s ascent to an investment grade credit status a long hard ride. It is this status that has now been put on negative watch by Moody’s (though not by Standard and Poor’s). But Moody’s was not entirely negative in its judgment. It did not derate RSA credit, for the following reasons as we quote below from its statement:

“To date, South Africa’s fiscal picture and economic policy parameters have remained generally in line with Moody’s expectations, hence the continued A3 rating. The South African authorities’ economic stewardship has been effective for more than a decade, during which time they brought public finances and inflation under control and significantly bolstered the country’s external liquidity position. In addition, meaningful progress has been made in raising living standards, expanding social services and physical infrastructure, and putting in place a financial support mechanism for the most underprivileged. Finally, the outlook for South Africa’s public finances has not diverged significantly from Moody’s projections when the country entered into recession in 2009, roughly the time of Moody’s last sovereign rating action, despite the rather sluggish economic recovery over the past two years….”

The Moody’s rationale for a negative watch on RSA credit went as follows and is highly deserving of serious attention especially by those in the tripartite alliance inclined to believe in quick fixes or the magic wands that are meant to provide well paid jobs for all (that current policies applied to regulate the SA labour market have so singularly And conspicuously failed to do), a fact of SA economic life well recognized incidentally by Minister Gordhan in his policy review.

To quote the rationale:

“The primary driver behind Moody’s decision to change the outlook on South Africa’s government ratings to negative is the rising pressure from society at large, as well as from within the ANC and its political partners, to ease fiscal policy in order to address South Africa’s high levels of poverty and unemployment. In Moody’s view, spending beyond the substantial amounts already budgeted in response to such demands could push debt to levels more commensurate with lower-rated sovereigns. South Africa’s direct debt and guarantees for state-owned companies’ obligations currently approach or exceed 50% of GDP. Moreover, a substantial proportion of the government budget is already absorbed by wages, social support and debt service, limiting the room for new growth-supportive spending.

“Secondly, Moody’s is concerned that economic growth will be somewhat slower than previously expected in the years ahead due to a weaker global economy, depressing any rebound in South African employment levels over the coming years. This would in turn aggravate existing frustrations over the lack of economic opportunities. Moreover, job creation in this environment would not be enough to absorb new entrants to the labour force nor reduce the already high levels of unemployment. In Moody’s opinion, this situation poses risks to political stability over the longer term. Thirdly, Moody’s believes that the political leadership’s unwillingness to definitively reject demands from certain segments of the political spectrum for more activist policy interventions is harmful to South Africa’s economic prospects, in particular private investment. The agency also says that nationalisation of the mines and/or other sectors — however unlikely to happen — would not achieve the stated aim of accelerating progress on black economic transformation. Instead, such moves are more likely to do the opposite, reducing the country’s attractiveness to both local and foreign investors, and encouraging the outward migration of citizens and businesses. Such actions would in turn raise the risk premium on government debt, further inflating the already-rising costs of debt service. Overall, Moody’s believes that the next two years will be especially challenging for South Africa’s political system, with the potential for further pressures emerging for the established economic policy framework during this period.”

The most important factor restraining growth in SA over the next 12 months are not the structural weaknesses of the SA economy or the populist threat to property rights and fiscal policy settings. It is the European government debt crisis and the threat it poses to global growth and sothe demand for SA goods and services, including services supplied to tourists. The behaviour of the rand and so the outlook for inflation and its impact on interest rates paid on debt issued by the RSA is completely dominated by these global forces. RSA specific political or monetary policy influences on these important influences on the growth outlook and the willingness of SA firms and households to invest or spend are conspicuously absent. It is not the Moody’s watch that moved the rand yesterday but higher yields on Italian government debt.

Hopefully these facts of economic life have been well appreciated at the Reserve Bank sitting today to decide on the repo rate. As the Monetary Policy Committee (MPC) of the Bank pointed out in its latest statement, the SA economy is being held back by a lack of foreign and domestic demand. The short term outlook for the global economy has deteriorated. The outlook for the domestic economy is not conspicuously improved, at least according to Moody’s. The Reserve Bank can only hope to stimulate domestic demand by lowering interest rates. It cannot expect to have any predictable influence on foreign demand or the value of the rand (and so on the outlook for inflation) with its interest rate settings.

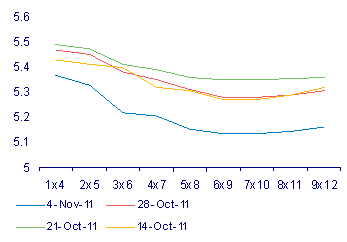
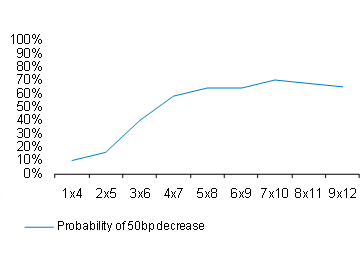
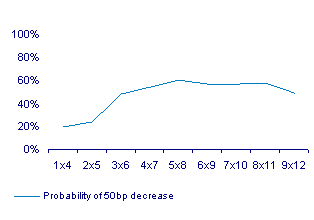
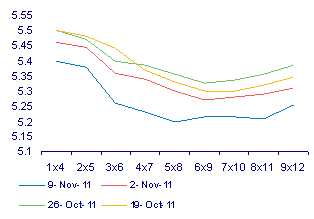
That lowering interest rates might do some good in promoting essential economic growth and so reducing SA risks (without doing any harm in the form of more inflation) should make a decision to cut interest rates an obvious one. If it was not altogether obvious at its last September meeting, it should be obvious today. And the Moody report would, it may be hoped, have made it even more obvious: the risks to the SA economy are not inflation (over which the Reserve Bank has no influence in the short term) but to growth, over which interest rate settings may have some influence. However the market place yesterday was not expecting a 50bps cut. This is despite the short term Forward Rate Agreements having shifted significantly lower over the past week, raising the probability of a 50bps cut to over 50% within three months. The probability of a cut today was still only about 20%.

We can hope the Reserve Bank will get it right and that the market has misread its better intentions. Brian Kantor
The probability of a 50bps cut in the Repo Rate
SA Banks’ Forward Rate Agreements

Hard Number Index: Noteworthy change

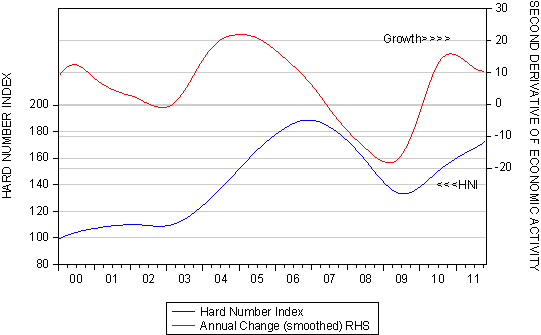
The economic signs from the Hard Numbers in October (vehicle sales and the note issue) provide some encouraging confirmation of the improving state of the SA economy.

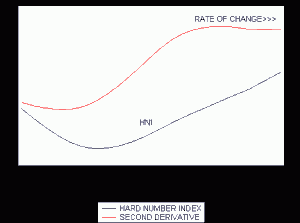
The Hard Number Index of Economic Activity in South Africa (HNI) continued its upward trajectory in October. This indicates that the economy – based on two hard numbers for October, unit vehicle sales and notes in circulation – maintained a positive rate of growth in October. The direction of the economy (forwards or backwards) is shown by the HNI: when it moves higher the economy is moving ahead; when lower it is going in reverse. The economy, according to these up to date and hard numbers, is clearly moving ahead. The speed at which the economy moved ahead in October may however have slowed down, as we show below.

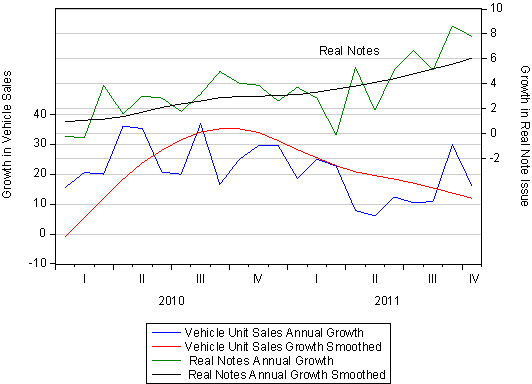
The changing speed at which it moves forward is indicated by the growth in the HNI. The speed of the economy slowed because vehicle sales in October 2011, while very strong compared to a year before, were down on September sales that were extraordinarily strong that month. However the other half of the HNI is made up of the notes issued by the Reserve Bank. These are issued in response to the demand for notes by banks and the public adjusted for the CPI. These growth rates have picked up very strongly in recent months. (See Below)

The Hard Number Index (HNI) of the State of the SA economy in October 2011 and its rate of change
The vehicle and real note cycle

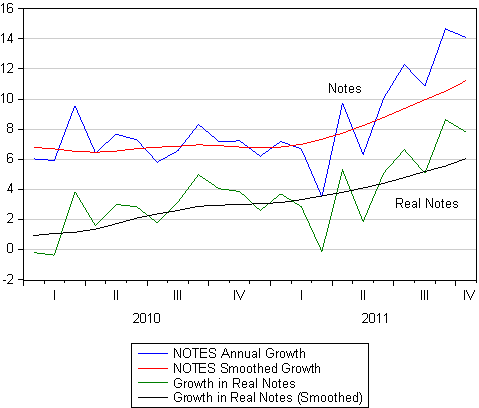
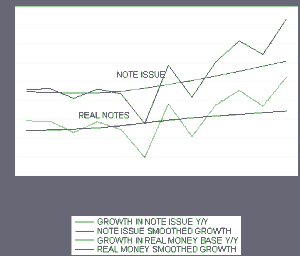
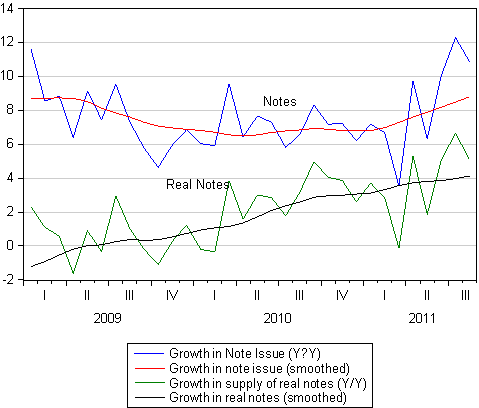
It may be seen below that the demand for and supply of notes has picked up significant momentum this year and that the pace at which notes are being issued is accelerating. Notes are held by banks in their branches and ATM machines and by the public in their wallets and purses to facilitate their spending intentions. It would therefore appear that at month end October, spending was gaining momentum. These trends will have to be confirmed but only much later by official estimates of retail activity. The most recent statistic of this kind for the retail sector is only for August 2011. These latest indicators confirm for us that the economy, after a slower patch in the second quarter, has picked up momentum.

The Reserve Bank however has never seemed to regard the narrow or broader definitions of the money supply and its growth as an objective of policy or of interest rate settings. Its decisions to lower short term interest rates at its meeting this week not are unlikely to be influenced by the accelerating growth in the note issue. Furthermore the growth in broader money (to September 2011) remained rather modest when viewed on a year on year basis. This may be so, but if interest rates are cut this week, this may add some pro-cyclical impetus to monetary policy. Brian Kantor
Growth in the Note Issue- A close up

Interest rates: Inflation now and into the future


The SA chances of an interest rate cut have improved markedly. Insuring against the risks of more inflation has also become more expensive. What does this mean for equities?

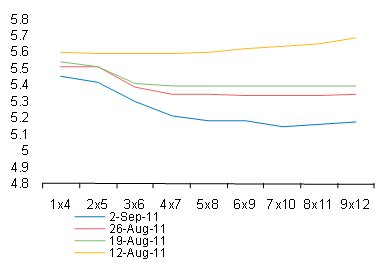
This week the Monetary Policy Committee (MPC) of the Reserve Bank will meet to set the Bank’s repurchase (repo) rate. Their deliberations were preceded last week by a very sharp downward shift in the Forward Rate Agreements (FRAs) set by the commercial banks. These rates, at which the banks are willing to lend for three months in three months’ time and beyond, indicate the direction of the repo rate to be set by the MPC.

South Africa – forward rate agreements
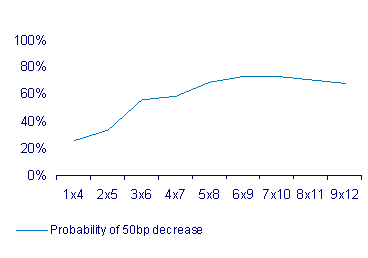
The probability of a 50bps cut in the repo rate

With the bodily shift of the FRA curve lower and the negative tilt of the FRAs, the SA banks have significantly raised the prospect of a cut in short term interest rates in the near future. This probability can be inferred from the level and direction of the forward rates. As we show below the probability of a 50bps reduction in short term interest rates is about 20% this week, rising to over a 70% chance of a cut within six months.

We had judged that the MPC had come very close to cutting rates at its last meeting, having every good reason to do so, given that the economy had been operating well below its potential. But the MPC then blinked and passed on the opportunity. Since then the MPC would have noticed how the Australians and the Europeans have cut rates with a deteriorating global and European growth outlook.

However the rand has not regained the ground it was losing at the time of its last meeting and so the SA inflation outlook will not have improved. Our sense as we have reported from retail and vehicle sales and the growth in cash, is that the local economy has picked up some momentum, even as the global outlook has deteriorated. But any incipient recovery has not been rapid enough to suggest that the gap between actual and potential GDP growth will have closed in any significant way. The housing market in SA has not shown any signs of a recovery in demand or house prices – meaning accompanying weakness in bank lending and, more important, construction activity and the employment that comes with construction and the renovation of homes.

Thus the case for lowering the repo rate is as strong as it was. The question is whether the MPC have had time to gain courage and take the leap to lower interest rates. As indicated such a leap will not come as a complete surprise to the market place.

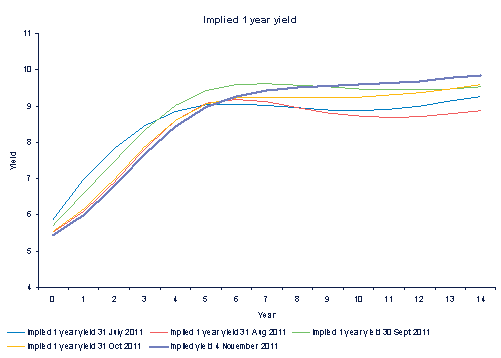
The outlook for interest rates over the longer term has also changed to a degree. Implicit in the term structure of interest rates is that one year rates will now be lower than previously thought until year five and to be higher thereafter. The yield curve is accordingly steeper – lower interest rates for now but higher over the long term.

Implied 1 year yield

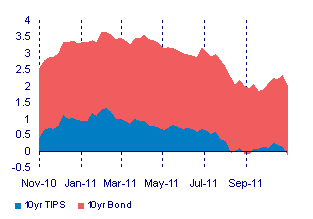
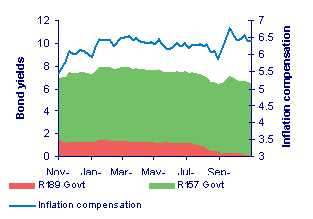
This also indicates that the market expects inflation to rise rather than fall over the next 10 years. And so investors in SA, as elsewhere, are prepared to pay up for insurance against higher inflation in the form of accepting much lower (even negative) yields on medium dated inflation linked bonds. The yield on the key 10 year inflation linked US bonds (TIPS) has turned negative again while the benchmark inflation linked RSA bond (the R189) that matures in March 2013 now offers a minimal 5bps yield – meaning that investors are being offered an extra and seemingly attractive 6.5% a year to carry inflation risk over the next few years. The bond market in the US is indicating that over the long term inflation will average about 2% a year. Given all the cash pumped into the US monetary system, but now idle on the balance sheets of banks, and all the cash pumped into and still to be pumped into the European banks, there must be a wide distribution of possible inflation outcomes about this benign 2% average. Hence the low inflation linked yields and the high price of gold (and also by comparison with lower interest rates, both real and nominal, the relatively low costs of entry into equity markets).

The USA- Vanilla and Inflation Linked Bond Yields
RSA- Vanilla and Inflation Linked Bonds

Money supply and credit growth: Confirming a more positive picture

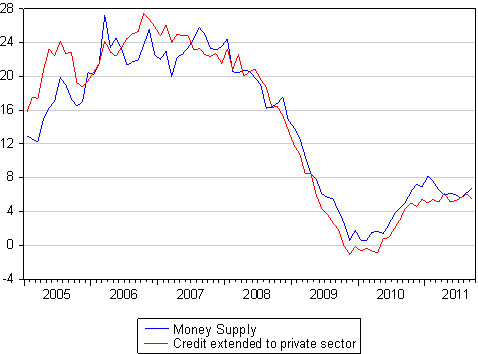
Money supply and bank credit numbers have been updated to September 2011. The year on year growth rates have recovered from their cyclical lows of late 2009 but appear to have stabilised in the 6% range. Broadly defined money supply covers almost all of the liabilities side of the balance sheets of the banks; while credit extended to the private sector accounts for almost all of the assets held by banks and so the growth rates are bound to be almost identical.

Growth in broad money supply (M3) and bank credit extended to the private sector

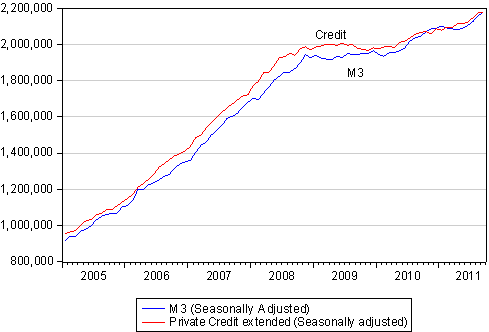
A closer look at the bank statistics over the past three months reveals a somewhat more encouraging picture. On a seasonally adjusted basis both money supply (M3) and bank credit have picked up momentum.

Money supply and bank credit extended to the private sector (R millions SA)

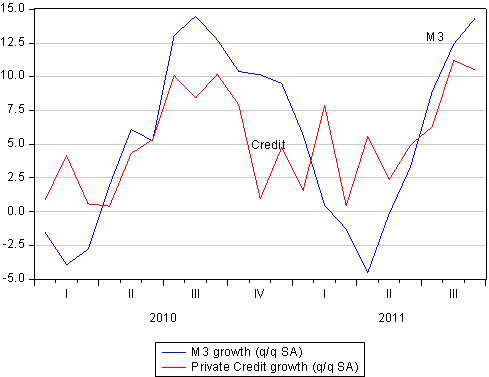
When these statistics are converted into a rolling quarter to quarter annualised rate of growth we observe a strong recovery to growth rates of +10% from the slower rates of growth realised earlier in the year.

Mortgage credit: Annual and quarterly growth rates (seasonally adjusted)

Mortgage credit demanded and supplied (accounting for about half all bank lending) however remains highly subdued, with growth rates tending lower rather than higher. House price inflation leads mortgage credit supplied and it would appear that the housing market remains in the doldrums.

Money and credit growth rates, seasonally-adjusted quarter to quarter annual rates of growth

The money supply and credit trends confirm our impression from vehicle sales, activity at retail level and the growth in the narrowly defined money supply (notes in circulation) that the SA economy has rather more life in it than is perhaps generally recognised. We await data on the note issue and vehicle sales in October, due to be released this week to give us a more up to date impression of the current state of the economy.

The world economy: When fears prove exaggerated, markets respond

Of the US economy

The US economy in the third quarter of 2011 grew at a 2.5% annual rate according to the first estimates released yesterday. Thus earlier fears of a recession have proved much exaggerated. Inventories rose at a slower rate in the quarter, enough to reduce the estimated growth rate by 1.1%. This must be regarded as good news – investment in inventories grew more slowly because final demand was unexpectedly high, implying that output and orders to come will be augmented by planned restocking. Final demands were hugely boosted by a 17.4% surge in spending on equipment and soft ware and spending on non-residential structures that were up by a 13.3% per annum rate in the quarter. US companies are drawing on their piles of cash to add capacity and competitiveness but remain reluctant to add to their numbers of employees.

Of banks everywhere

Banks in Europe were required to write off €100bn of Greek government debt. The banks, against their own wishes, have also been required to boost their impaired capital to 9% of the assets on their balance sheets. Where this capital is to be sourced is not fully known but the much augmented European Stability Facility may well be called upon in addition to shareholders. The upshot of the weekend action taken by European governments (still lacking in detail) was an enthusiastic response recorded in the markets, and in particular in the market for bank shares (and not only in Europe). By the close in New York the Bank of America share price was up 9.6%, Citibank had gained 9.7% and JPMorgan was up 8.3%.

European banks

The losses that banks have had to take on their books has been more than made up for in gains in market value. Which again indicates an important point, that raising equity capital (and diluting existing shareholders) can add to the market value of a banking (or any other) share when it serves to reduce meaningful bankruptcy risks. Private shareholders in banks, when called upon to subscribe additional capital in due course, might bear this win-win prospect in mind.

The Eurostoxx Index of Banking Stocks that had fallen by more than 50% between March and September is now about 16% up from these lows. Of the leading French banks, BNP gained 16.93% on the day, SocGen was up 22.5% and Barclays in London gained 17.6%, while our own Investec shares in London were up a more modest 6.4%.

European debt: Concentrating the minds

The prospect of being hanged is said to concentrate the mind. Clearly the European leaders were concentrated very hard over the weekend to find a clear way out of the European debt and banking crisis. Also on hand were the leaders of the IMF and ECB. Full details of the plan to revive the credit of European governments and the banks threatened by the possibility of default will be released on Wednesday. But so far so good as far as the equity and bond markets are concerned. Investors understandably have great difficulty in valuing assets given a small probability of a catastrophic event (particularly when nothing like it has ever occurred), such as the failure of the euro experiment and all the financial commitments and contracts associated with the Euro. The markets before and after a fateful weekend in Brussels appear to have reduced the likelihood of catastrophe.

As we show below, some of the upward pressure on the yields of Spanish and Italian bonds has been relieved. When the market is convinced that 6% in euros from the Italian government is a good deal the crisis will be over and the Italians and Spanish governments can then come up with credible long term plans to further reduce their costs of finance.

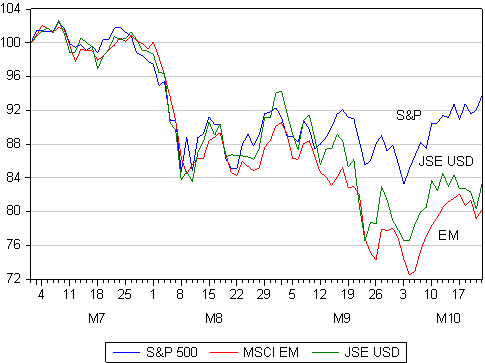
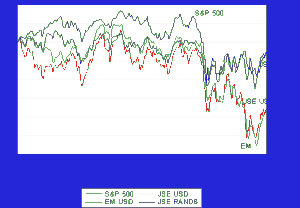
The equity markets are well off their recent lows, with the S&P 500 leading the pack and up 10.6% off its recent low of 3 October. The JSE in US dollars (despite a weaker rand), has gained 7.8% since 3 October and the MSCI EM is up 8.8% from its low of 4 October.

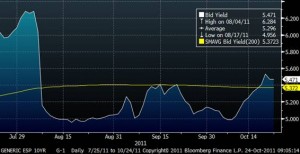
Spanish 10 year euro debt yields
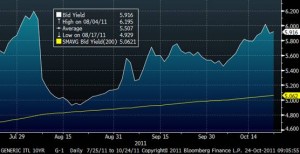
Italian 10 year euro debt yields
Equity Markets, 1 July 2011 = 100 (daily data in US dollars)

The very much revised plans (from July 2011) to avoid disaster appear to have a few essential elements. Firstly a much larger write down of Greek debt (from a 30% write down to something more than 50%) appears to be in the wings. The banks suffering these losses therefore will need significant infusions of fresh capital. Clearly European governments – especially governments with fiscal strength – will be an important source for additional capital. However shareholders and sovereign wealth funds will also be called upon; though to what degree and will have to be revealed.

The market in all other vulnerable European government debt will be encouraged by the utilisation of the European Stability Fund. How best to leverage this fund of €440bn has been the subject of particularly intense debate between the French and the Germans. The French have been calling for what in broad terms would amount to unconstrained support (by European taxpayers in one way or another including interventions by the ECB) for all euro denominated European government debt. The Germans, while emotionally strongly committed to the symbolism of the euro have been reluctant to sign a blank cheque.

According to the Online addition of the Wall Street Journal this morning (24 October 2011):

Options for the fund, the European Financial Stability Facility, were narrowed to two after a meeting of euro-zone finance ministers Friday. One is an insurance plan that foresees the fund’s setting aside a pool of money that could be used to offset part of any losses suffered by purchasers of the debt of weak countries, such as Italy. That could entice buyers and keep Italy financed.

The other would be to create a special, separate fund. That fund would raise money from private investors and others, like sovereign-wealth funds, to buy debt of weak countries. The EFSF would also participate in the fund—but would suffer the first losses. Officials said the two options could be combined.

Meanwhile, in other parts of the world …

The markets woke up today on their good side following a strong close in New York. However not all the good news may have emanated from Brussels. It seems very clear now that the US economy grew satisfactorily in the third quarter with the initial growth estimate, to be released, expected to be at about a 3% rate. The US third quarter earnings updates are by now well in hand and the results appear highly satisfactory, with earnings per share estimates for calendar 2011 in the process of being revised upwards again to above $100 per share. According to the FT, reported third quarter earnings from US companies have been ‘remarkably upbeat’. The FT, quoting S&P Capital expects a “blended average of actual and forecast earnings for the S&P 500 to rise 14.6 per cent for the quarter from a year ago…That figure is up from 12.4 per cent a week ago but below the mid July estimate of 16.94 per cent..”

The outlook for the Chinese economy also appeared to have improved over the weekend with official statements indicating no need for additional stimulus or any change in the policy tack. Should the market decide that a solution for the European debt and banking crisis has been found (even as the outlook for minimal European growth remains largely unchanged) the focus of market concerns will revert to the outlook for Chinese and Emerging market growth, helped or hindered (as the case may be) by the outlook for US growth. Brian Kantor

Retail sales: Share prices may be telling us more than retail sales

The volume of retail sales in August 2011, reported yesterday, was over 7% ahead of August a year before. This would seem to represent quite robust real growth in the top lines of SA retailers. However a year is a long time in economic life and especially in the retail business for making sales comparisons. Even a week and especially a week around Easter or more so Christmas when sales are highly concentrated may prove to be a very anxious and long period to wait for reports from the tills.

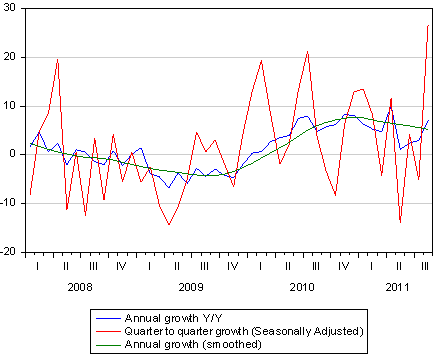
In the figure below we show annual and smoothed annual growth in retail sales volumes. As may be seen, these trends appear to be pointing lower. However when we seasonally adjust sales on a moving three month period these quarterly growth rates spiked significantly higher in August – providing a much more encouraging signal about sales growth.

Retail sales growth (constant prices)

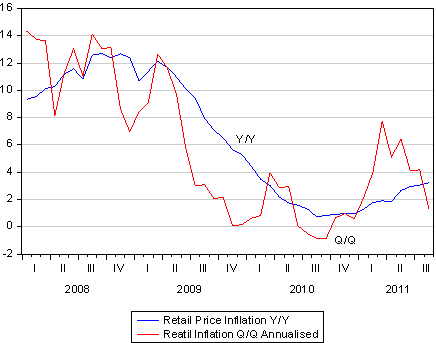
This growth in sales may well have been assisted by a low rate of retail inflation. Retail prices are 3.25% higher than a year before while on a seasonally adjusted basis retail prices have risen by only 1.33% over the past three months. The annual rate of retail price inflation has ticked up while the quarter to quarter rate has slowed down.

Retail price Inflation

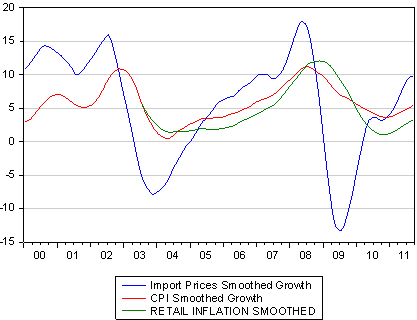
We show below that retail prices have been rising at a significantly slower rate than prices in general, the inflation of which has been much augmented by higher administered prices, that are taxes on consumers by another name. In a real sense these price trends have made retailers more competitive for the household budgets strained by higher charges for electricity and petrol.

However as we also show prices in general, including at retail level, follow the trends in the prices of imported goods. Imported goods represent the cutting edge of competition in SA and so the prices of imports lead prices lower and higher as the exchange rate strengthens or weakens. The state of global supply and demand is also reflected in the US dollar prices paid for imported goods. Lately the rand has weakened as have commodity prices on expectations of slower global growth.

The net effect has been a rising trend in the prices of imported goods that may not reverse until the rand recovers some of its lost ground. The outlook for inflation in SA has deteriorated accordingly but it is not an inflation rate that the SA Reserve Bank or higher interest rates can have any influence over. The case for higher interest rates can only be made when the upward pressure on prices emanates from excess domestic spending rather than temporarily higher prices driven by a weaker rand.

Despite a satisfactory state of demand at retail level, the SA economy deserves encouragement rather than discouragement from monetary policy settings. It would appear that the Reserve Bank remains of this mind, despite the usual genuflection to the inflationary dangers of inflationary expectations (for which there is simply no SA evidence).

Annual change in prices (smoothed)

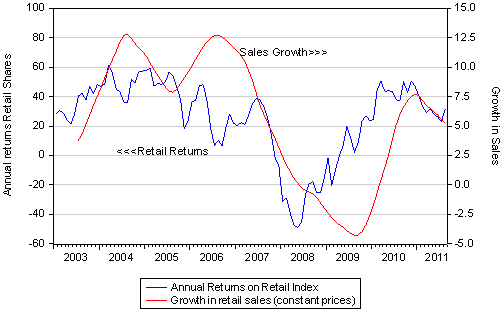
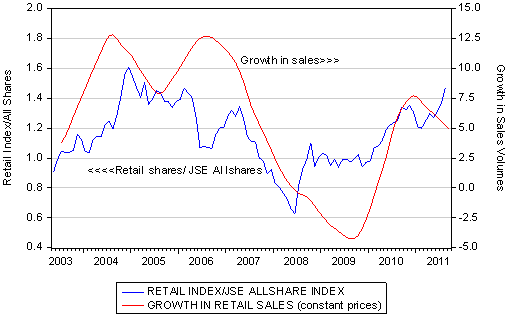
A further source of encouragement for the view that retail sales are growing consistently well is the performance of the SA retailers on the JSE. As we show below the returns on the JSE General Retail Index have provided a very good leading indicator of retail sales volumes. Returns have picked up recently, as may be seen below. As may also be seen, such positive signals of retail sales volumes and the earnings to follow are provided by the outperformance of retail shares. Retailers have been doing significantly better than the JSE as a whole. Thus the prices attached to the shares of retailers (especially relative to share prices in general) may tell us more about the state of retailing in South Africa, and in a much more up to date way, than the retail sales statistics themselves.

Returns on the JSE General retail Index and Growth in Retail Volumes
Retail Index:JSE ALSI Index and Retail sales growth

World markets: Giving approval to the G20

The equity markets have reacted favourably to the G20 meeting over the weekend that promised a comprehensive solution to the European debt and banking crises. Stabilise the debt markets, recapitalise the banks and finally deal with Greece: these are all necessary to calm the markets and are now fully recognised in the highest European circles.

The equity markets over the past two weeks have recovered some of the ground lost in late August, so much so that (including dividend income), the S&P 500 is now about flat for the year. The emerging equity markets, including the JSE when valued in US dollars, continue to lag well behind the S&P 500.

Daily moves in the markets (1 January 2011 = 100 )

When it strikes, risk aversion appears to infect emerging markets regardless of the sources of the dangers to the global economy that emanate from the developed world. Nonetheless, if the tolerance for risk improves further, the value implicit in emerging market companies and government bonds will attract renewed attention.

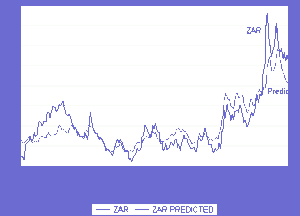
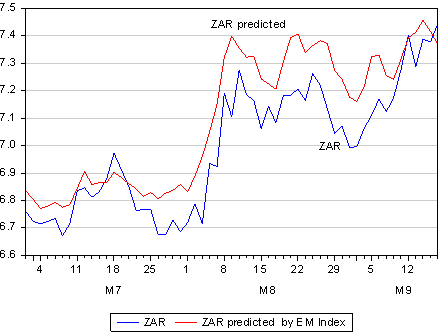
The US dollar value of the rand continued to follow the direction of the emerging market (EM) Index and the JSE (which are so closely connected). As we show below, the rand/US dollar exchange rate, while it continues to track the EM Index on a day to day basis may be regarded as somewhat undervalued relative to the EM Index. Fair value for the rand/US dollar (given the level of the EM Index on Friday 14 October) would have been close to R7.50 rather than the R7.80 at which the rand traded. Where the S&P 500 goes the EM Index, the JSE and the rand will follow if the recent past is anything of a guide to the future.

The rand:US dollar daily values and as predicted by the EM equity Index

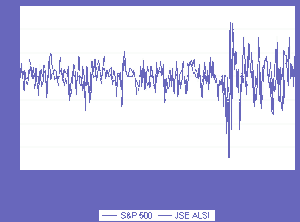
One of the features of the equity markets in recent months has been the extreme daily movements in the indices. It has been reported by the Wall Street Journal that the S&P 500 moved by more than 1% on 56 of the past 57 trading days.

Daily percentage moves in the S&P 500 and the JSE ALSI

As risks rise and fall, as reflected in daily price moves and the price of options, share prices move consistently in the opposite directions. Volatility is good for the bears but not the bulls in the market: we show below the strong negative relationship between daily percentage moves in the JSE All Share Index and daily moves in the SAVI (the volatility Index priced into options on the JSE). The correlation is -0.710 for the period since 1 July.

Scatter Plot of daily moves in the JSE ALSI and the volatility measure (SAVI)

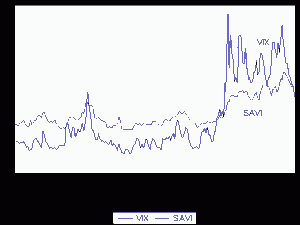
The SAVI and the VIX (the volatility Index for the S&P 500) show a similar pattern. The recent decline in the VIX and the SAVI to below 30 must be regarded as encouraging for equity investors. If this declining trend persists (consequent on any gathering belief that the Europeans will sort out their problems) the share markets will move higher. It is not risks that determine returns or returns that determine risk. It is degrees of uncertainty about the future that simultaneously drives risks and returns in the opposite direction as may be clearly seen in the markets on a daily basis.

The volatility Indicators- the VIX and the SAVI

The Hard Number Index: Better than might have been expected

The official numbers for notes in circulation at 30 September, as well as new vehicle sales for September 2011 have been reported, allowing us to update our Hard Number Index (HNI) of the state of the SA economy. According to the HNI, economic activity in SA maintained its faster momentum in last month, at more or less a satisfactory constant speed as we show below. Given that many commentators had been expecting decelerating growth, this outcome must be regarded as good and encouraging economic news. The SA economy has, according to our HNI, headed in the direction of faster rather than slower growth in the third quarter.

The Hard Number Index (HNI) of SA economic activity and rate of change to the HNI – activity growing at a good constant speed

We had noted in our previous report that the supply of and demand for notes had picked up momentum in August. The note issue is a very good indicator of spending intentions by consumers and one that is particularly useful as an economic indicator because it is so up to date. The growth in demand for notes continued to increase in September with actual growth rates now well above 10% p.a with the growth trend accelerating rather than decelerating. These growth numbers, when adjusted for inflation, are also revealing a marked upward bias. SA households would appear to be willing to increase rather than rein in their spending.

Growth in the supply of notes – a pick up well under way

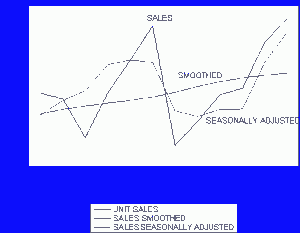
New vehicle sales in September also revealed a robust growth trend. The growth trend in new unit sales, which had weakened in the second quarter, has reversed course very decisively. On both an actual and seasonally adjusted basis, new vehicle sales have headed higher. Also encouraging is that export sales have remained very strong at nearly 26 000 units sold while the demand for commercial vehicles, particularly heavy vehicles, is showing especially strong growth. This indicates a willingness of SA business to add to its capacity to produce goods and services. Brian Kantor
New Unit Vehicle Sales

MPC rates decision: Testing the waters but not jumping in

The MPC yesterday downplayed the risks to inflation correctly, while the risks to the domestic economy received full attention. Listening to the litany of economic problems facing the SA economy referred to by Governor Gill Marcus during her speech (quoted below*) I had a moment of near exhilaration that the MPC would in fact surprise the market by cutting rates. The economy is clearly screaming out for them as it has been doing for some time.

But then caution prevailed. We can blame global risk aversion and its impact on the rand for the predictable pusillanimity in Pretoria. But the case for an interest rate cut was debated and the Governor provided every indication that a cut next time round is now very much more likely (if the economy stays on its present sub-optimal course) and especially if the rand recovers some of its losses, which it will if the global risk appetite recovers to a degree. Brian Kantor
Extracts from the MPC statement that pointed to interest rate action, not inaction:


The depreciation of the rand poses a potential upside risk to the inflation outlook. However the degree of this risk will depend on the extent and persistence of the depreciation trend, which in turn will be influenced by the duration and intensity of global risk aversion. The rand tends to be more sensitive to changes in global risk perceptions than most of its emerging market peers. At this stage the MPC still considers the upside risk to the inflation outlook from this source to be relatively moderate, but rising.

Domestic economic growth remains disappointing, with the negative output gap widening to around 3 per cent in the second quarter of 2011 and gross domestic product growing by 1,3 per cent, following the 4,5 per cent increase recorded in the first quarter. Both the primary and secondary sectors contracted in the second quarter, while real value added by the tertiary sector increased only marginally. Wide-spread industrial action, which continued into the third quarter, contributed to this subdued outcome, and is expected to weigh negatively on third quarter prospects as well.
Recent high frequency indicators are also not very favourable. Mining production contracted at a year-on-year rate of 5,1 per cent in July, and by 4,3 per cent on a month-on-month basis. Manufacturing output declined at a month-on-month and year-on-year rate of 6,0 per cent in July, confirming the sharp decline to 44,2 index points observed in the Kagiso/BER Purchasing Managers Index (PMI) in July. Despite a modest recovery in August to 46,7 index points, the PMI remained below the neutral 50 level, pointing to a further possible contraction in the sector. The construction sector also remains subdued with both the FNB Building Confidence Index and the FNB Civil Construction Index remaining at very low levels, while there was a further decline in the number of building plans passed in the third quarter.
Overall business confidence, as reflected in the RMB/BER Business Confidence Index, has declined for two consecutive quarters, and at 39 index points is well below the neutral level of 50. The Bank has lowered its forecast for average growth in 2011 to 3,2 per cent, down from 3,7 per cent, while the forecast for 2012 has been reduced from 3,9 per cent to 3,6 per cent. The forecast for 2013 remains unchanged at 4,4 per cent. The lower forecast is a result of the lower-than-expected outcome in the second quarter, as well as a downward adjustment to the global growth assumption. The risks to this outlook are seen to be on the downside.

The lower growth trajectory does not bode well for employment creation, which has been relatively muted. According to Statistics South Africa, employment in the formal non-agricultural business sector increased by 0,1 per cent or 5,701 people in this second quarter of 2011. The outcome was, however, negatively affected by the decline in public sector employment associated with the termination of contracts of temporary employees hired for the municipal elections.

Consistent with the moderation in domestic production, growth in real gross domestic expenditure also declined, from an annualised growth rate of 7,9 per cent in the first quarter of 2011, to 1,3 per cent in the second quarter. A positive development was the further acceleration in the growth of real gross fixed capital formation, albeit off a low base, from an annualised rate of 2,7 per cent in the first quarter to 4,0 per cent in the second quarter. Nevertheless the ratio of gross fixed capital formation to GDP, at 18,9 per cent, is still well below the peak of 24,6 per cent measured in the fourth quarter of 2008.

Consumption expenditure by households has to date been the main driver of growth. However, in the second quarter of 2011, growth in consumption expenditure moderated to an annualised rate of 3,8 per cent, compared with an increase of 5,2 per cent in the first quarter. Real retail trade sales increased at a year-on-year rate of 2,8 per cent in July, but declined by 0,7 per cent in the three months to July compared with the previous three months. Growth in motor vehicle sales, while still positive, has also declined. Consumption patterns may have been distorted somewhat by the high base effects arising from the 2010 World Cup, and a clearer picture should emerge in August. The RMB/BER Consumer Confidence Index has declined for two consecutive quarters, underlying the fragility of the outlook.

Consumption expenditure is expected to remain constrained to some extent by low rates of credit extension and continued debt deleveraging by households. The ratio of household debt to disposable income declined further to 75,9 per cent in the second quarter of 2011 from a peak of 82,0 per cent in the first two quarters of 2008. Twelve-month growth in total loans and advances extended by banks to the private sector has fluctuated around 6 per cent in the three months to July. Mortgage advances, which is the largest category of credit, grew at a year-on-year rate of 2,9 per cent, consistent with the slow pace of recovery in the domestic property market. The main driver of growth in credit extension was the category of other loans and advances, in particular general loans which reflect primarily corporate sector borrowing. This category grew by almost 15 per cent in the year to end of July.

Source: MPC statement, 22 September

The Eurozone crisis: Thanks for coming – but no thanks

The European central bankers and finance ministers invited Timothy Geithner, the Secretary of the US Treasury to their weekend meeting in Poland, but did not take that kindly to the sense of urgency he tried to convey. Jean Claude Trichet, head of the ECB, was ungracious enough to indicate that the outlook for European governments’ fiscal deficits at a 4.5% average was significantly better than that of the US. This average however conceals a wide standard deviation about the average which is the European problem and especially the problem of European banks. The Europeans in turn urged the US to adopt its tax on financial transactions proposals that seem like an invisible way to raise revenue – but only if all financial regimes cooperate (something the Americans and British seem unwilling to do).

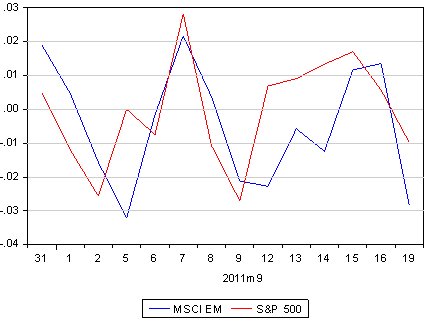
The markets did not at all like the news flow from across the Vistula River. Increased risk aversion drove equity markets lower. Emerging market equities were especially vulnerable and took the rand predictably lower with them.

Daily moves in the S&P 500 and the Emerging market benchmark, September 2011

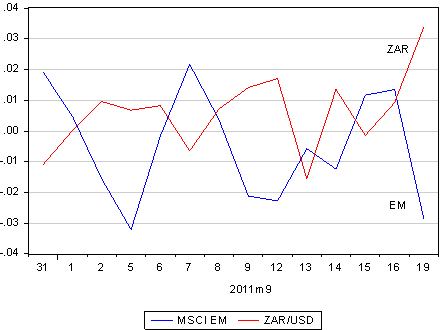
As we show below the benchmark MSCI EM Index lost 3% by the close and the rand/US dollar was a little more than 3% weaker as investors hedged their EM bets in the market for rands.

Daily moves in the Emerging market benchmark and the rand-US dollar, September 2011

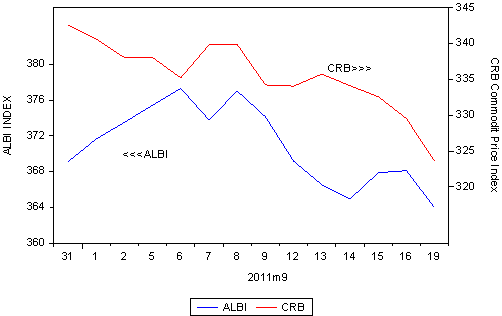
Neither SA rand denominated bonds nor commodity markets escaped the downward draft. Rand denominated bonds are no longer acting as the safe haven they were earlier in the month. Commodity markets, despite yesterday’s declines, can still be regarded as holding up very well relative to the equity markets, helped presumably by superior growth still emanating from the emerging economies.

The RSA All Bond Index and the CRB Commodity Index

The shining light yesterday was predictably the higher rand price of gold and the still higher rand price of gold shares listed on the JSE. The gold shares even outperformed the gold price on the day.

The rand price of gold and the JSE Gold mining index, 31 August 2011=100

The European financial leadership does not appear to take the threats to European banks nearly as seriously as investors in them do. The European banks, represented by the Eurostoxx bank index, has lost over 50% of its value since March. This Index lost about 5% yesterday. The numbers bandied about in IMF and other circles indicate that the Euro banks are undercapitalised by about EUR220bn. European governments do not, as yet, seem willing to assist such an infusion of capital into their banks that would not at all be beyond their financial capacity. Unless Greece does manage to step back from the default brink, such a capital raising exercise will indeed be as urgent as Geithner has been arguing. The Greek drama is surely now very close to its final scenes (one way or the other), in the form of a recue or hopefully orderly bankruptcy proceedings.

What Geithner knows very well, but apparently failed to convince the Europeans accordingly, is that the solution to Europe’s financial crisis is very similar to that of the US crisis – that is pump cash into the banking system without limits to provide liquidity – and also to pump capital into the banks without delay so that they can resume business more or less as usual. The solution to Europe’s and the US’s long term fiscal imbalances will take longer and require much more fundamental reforms that politicians will have to wrestle with.

The rand and long term interest rates: Still plays on global risk aversion

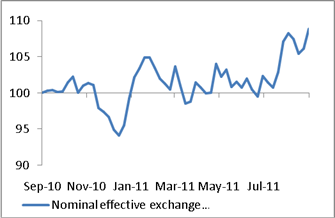
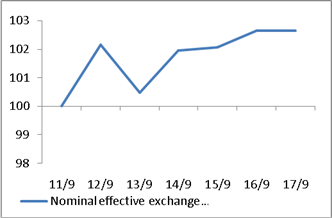
The rand came under moderate pressure last week – it lost about 2.5% on a trade weighted basis. Compared to a year before, the rand is now about 9% weaker than a trade weighted basket of the currencies of its trading partners.

The trade weighted rand September 2010 to September 2011 (September 2010 = 100; higher numbers indicate a weaker rand)
The trade weighted rand, week ending 16 September 2011 (9 September 2011 = 100)

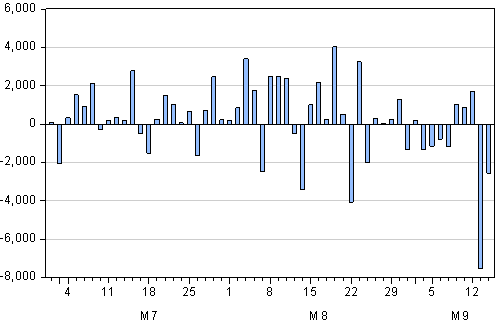
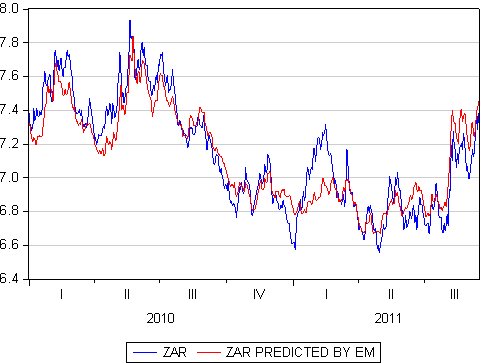
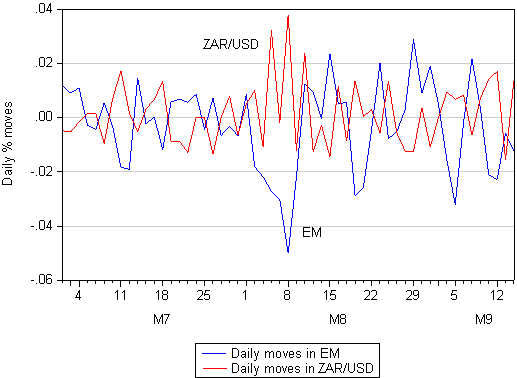
The rand/US dollar exchange rate has continued to follow very closely the direction given by emerging equity markets, represented by the MSCI EM equity Index. This we show below where the influence of the EM equity index on the rand can be seen very clearly. However, as may also be seen, the rand/US dollar has moved from being somewhat overvalued – relative to emerging equity markets – to marginally overvalued by this criteria. On Friday emerging equity markets moved higher and the rand/US dollar unusually moved marginally lower, indicating perhaps additional forces at work. As we had previously pointed out, foreign holders of RSA rand denominated bonds had sharply reduced their exposures to the rand earlier last week; though they had returned to the market as net buyers on Thursday and were only marginally net sellers on Friday.

The rand US dollar- Actual daily values and daily values as predicted by the MSCI EM Equity Index
Net foreign bond sales-purchases (R millions), daily data September 2011

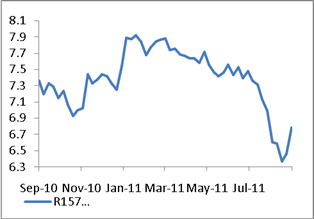
Longer term interest rates in SA have reversed a declining trend. The four year R157 recently touched a 6.3% yield then moved higher early last week on these net foreign bond sales but then yields declined later in the week.

It is also of interest to note that emerging market US dollar bond spreads over US Treasuries also widened sharply in recent weeks as global risk appetite diminished in the wake of the European bond crisis. These wider spreads are also consistent with both weaker EM equity markets and a weaker rand (which acts as a proxy for emerging market currencies that are less easily traded and hedged).

The RSA 157 (four year bond) yield (Sept 2010 - Sept 2011)
RSA157 yields (week ending 16 September 2011)

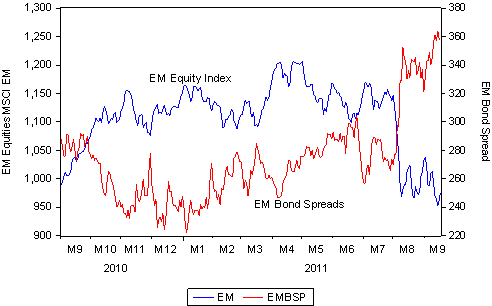
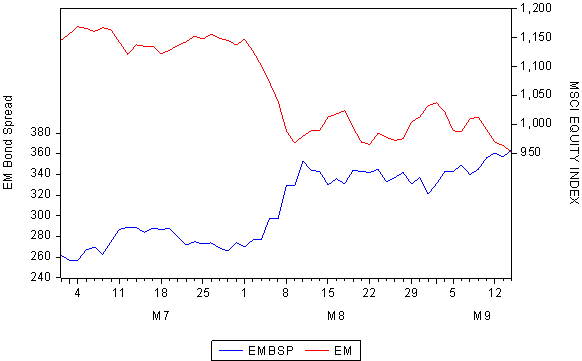
The rand continues to be well explained by global economic and financial forces. It remains a play largely on global risk aversion that is well represented by emerging market bond spreads and emerging market equity valuations. These two series remain highly correlated on a day to day basis. As we show below, when risks rise equities fall and vice versa. The rand can be expected to recover its strength should global investors recover some of their appetite for risk. South African specific risks or even expected movements in short term interest rates do not appear to have added much (if anything) to an explanation of the recent direction of the rand.

EM equity Index (MSCI EM) and EM bond spreads- September 2010 to September 2011 (daily data)

Long term interest rates and the rand: All explained by global risk appetites

Foreign investors significantly reduced their exposure to rand denominated RSA bonds over the past two days. They were net sellers of over R7bn on Tuesday and sold a further R2.55bn yesterday. This quarter foreign investors had become enthusiastic net buyers of rand and other local currency denominated emerging market bonds in response to the weakness and volatility in euro denominated bonds. Clearly what had added to rand strength and forced interest rates lower in July and August took something away from the rand over the past two days and reversed recent moves in longer term interest rates.

Net foreign purchases - sales of rand denominated bonds

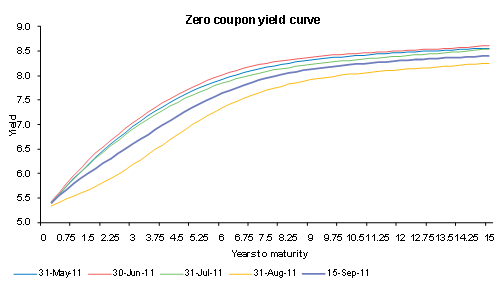
The term structure of SA interest rates has shifted out over the past few days with the yield curve becoming significantly steeper over the one to five year terms.

Zero Coupon Yield Curve

The yield on the benchmark four year R157 increased from 6.52% on 31 August to 6.94% on 14 September representing an increase of about 60bps since lows reached on 8 September. The impact of foreign sales can also be seen in the one year rates implicit in the yield curve.

Implied 1 year yield

The one year rate, as expected 12 months ahead, has increased from the 7.82% implied on 31 August to 8.15% yesterday. Further along the yield curve the implied shorter term rates are little changed. Further steepening in the yield curve might follow the meeting of the Monetary Policy Committee (MPC) of the Reserve Bank next week. The MPC may choose to clarify its intention to reduce the repo rate in due course. It may even cut rates next week but this must be regarded as unlikely. It should be said that if the case for cutting rates is a stronger one – given the weakness in the global and domestic economies – the case for cutting sooner rather than later will also be a strong one.

The rand however continues to be very well explained by global risk appetite, as fully reflected in the direction of the EM equity markets. Our model, which has successfully explained the rand/US dollar with the MSCI EM Index as the only explanatory variable, predicts the current value of the rand as R7.45.

The rand as explained by the EM Equity Index

Thus despite the influence of the bond market the rand is very well explained by the trends in equity markets and we presume will continue to do so. The risks in the EM equity markets are fully reflected in the spread offered by the EM dollar denominated bond index. As we show below, as the risks associated with the Eurozone debt and banking crisis increase (reflected by a widening yield spread over US Treasuries) the equity markets move in the opposite direction. And as EM equity markets go, the rand tends to move in the opposite direction.

The MSCI EM Equity Index and the EM bond spread
Daily moves in the EM Index and the rand, 30 June to 14 September

European debt crisis: Are we closer to the denouement?

How much would European Banks be required to write off of their loans to European governments? That is presuming a bad (not worst case) scenario of a 70% write down of Greek, Portuguese and Irish debt and losses of 30% on Spanish and Italian debt. The recent stress tests of 90 European banks and an IMF analysis of the CDS market provide some ball park numbers. The estimate is of the order of EUR260bn: a large amount but not nearly as much as the EUR700bn written off by European banks in the aftermath of the 2008-09 global financial collapse.

A consoling thought is that aside from the failures of their sovereigns, banks in Europe have little other additional exposure to private borrowers that they might have to write off. They have done very little additional lending lately, quite unlike the run up to the global financial crisis when lending growth was robust at close to a 10% annual growth rate.

Equity investors have made their own severe judgments as to the losses European Banks will incur. The Stoxx Europe 600 banks index is down just over 25% since1 August. Société Générale, France’s second-largest listed bank, has lost half of its market value since the beginning of August. Shares in Crédit Agricole, France’s number 3 bank, have dropped 35% while those of BNP Paribas, the largest French bank, are down 32% over the same period. More important perhaps than the absolute fall in the value of their shares, is that the market value of some of these banks is much diminished. This suggests very poor prospects for these banks and very little capacity to raise additional capital from their much damaged shareholders. Since 1 August the market value of Soc Gen has fallen from EUR25bn to its current value of EUR11.79bn while BNP is now worth EUR32.4bn compared to EUR52.4bn on 1 August. As far as shareholders are concerned they have already had to write off very large amounts of capital in their banks.

The question then becomes whether or not the European governments have the will and even perhaps the financial capacity to do what presumably the market place would be unwilling to do, and that is to recapitalize their banks. The alternative is a permanently impaired banking system unable to make the essential contribution to credit availability and economic growth that banks make. And a word of sympathy for banks – that is their shareholders – is in order. You can blame the lending officers of the banks for supporting US mortgage backed credit. You can hardly blame them for lending to their own governments – indeed they are obliged by regulation to do so because they are treated as being the safest of assets.

It can be expected that should some formal Eurozone governments’ defaults be acknowledged of the grave order indicated above (a possible but by no means certain event) governments will have to replenish the capital of their banks. Furthermore the liquidity strains of these banks will continue to be fully satisfied by the ECB – as they have to date. It is this support that has prevented a further melt down in Spanish and Italian debt as well as support for the banks using such debt as collateral for ECB support.

The responses of the US Fed and the US Treasury to the banking and financial crisis has very clearly pointed the way forward for European governments and the ECB. The very effective responses of the Swedish and Norwegian governments to their own banking crisis of the early 1990s are perhaps even better examples of crisis management closer to home.

The share markets may be pricing in not merely a bad case scenario of significant write offs of European government debt. They appear to be pricing a worst case scenario in which European governments and the ECB stand by and watch the European banking and financial collapse. This is a development that would not only harm its banks irreparably but would damage as irreparably the capacity of European governments to raise debt, a notion too ghastly to even contemplate. European leadership and technical central banking skills are surely capable of avoiding the worst case and be able to deal with what is a bad case fully discounted in the market place.

Hard Number Index: Has the gloom been overdone?

With the release of unit vehicle sales and the size of the note issue for August 2011 we are able to update our hard Number Index (HNI) of the state of the SA economy. As we show below the HNI confirms the SA economy is maintaining its growth momentum. The HNI for July and August 2011 show very little change. The economy appears to moving ahead at a constant speed.

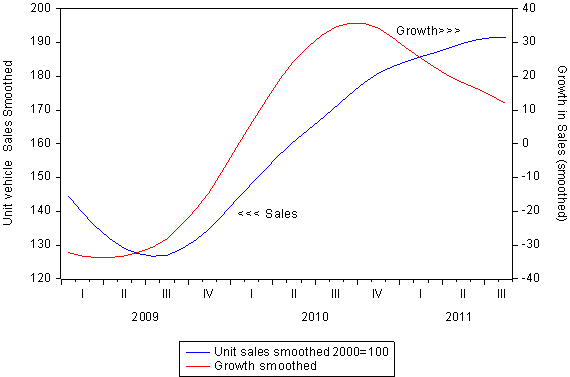
The HNI is an equally weighted mix of vehicle sales and the notes in circulation, adjusted for inflation. The vehicle sale cycle has turned lower – while still indicating good growth. As we reported previously vehicle sales in August recovered well from July 2011 levels – however this pickup in sales was not enough to reverse the declining growth trend.

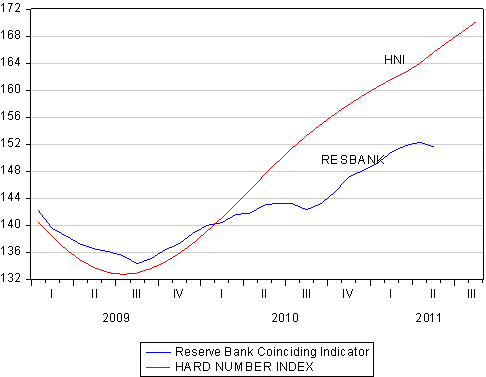
As we also show, the HNI provides a much more up to date measure of the current state of the SA economy than the Business Cycle indicator, released by the Reserve Bank (which is only updated to May). As may be seen the HNI and the Reserve Bank Indicator tuned up in the same quarter of 2009. It may also be seen that the Reserve Bank indicator turned lower in May 20011; though the subsequent progress of the HNI strongly suggests that this economic activity indicator will have followed the HNI higher since then.

The Hard Number Index and the Reserve Bank Coinciding Business Cycle Indicator (2000 = 100)
Vehicle sales smoothed (2000 = 100) and smoothed growth rates

However what was negative for the HNI on the vehicle front was made up almost completely by the strength in demand for extra notes by the public and the banks. Adjusted for inflation, this growth in the note issue has picked up good momentum as we show below. This trend must be regarded as a very helpful one for the SA economy. Growth in the demand for and supply of notes indicates an improved willingness of the public to spend more. It has proved to be a very good indicator of the state of the SA economy. It suggests that the gloom about the prospects for the domestic economy may be overdone.

The notes in circulation cycle

The global economy: A semblance of normal service

The equity markets in New York appeared to gain some late afternoon relief yesterday from the Institute of Supply Management (ISM) survey of the state of nonmanufacturing activity (the NMI) in August. The survey is an influential and comprehensive one covering the very large proportion of economic activity in the US that is service rather than manufacturing based.

To quote the report:

“The NMI registered 53.3 percent in August, 0.6 percentage point higher than the 52.7 percent registered in July, and indicating continued growth at a slightly faster rate in the non-manufacturing sector. The Non-Manufacturing Business Activity Index decreased 0.5 percentage point to 55.6 percent, reflecting growth for the 25th consecutive month, but at a slower rate than in July. The New Orders Index increased by 1.1 percentage points to 52.8 percent. The Employment Index decreased 0.9 percentage point to 51.6 percent, indicating growth in employment for the 12th consecutive month, but at a slower rate than in July. The Prices Index increased 7.6 percentage points to 64.2 percent, indicating that prices increased at a faster rate in August when compared to July. According to the NMI, 10 non-manufacturing industries reported growth in August. Respondents’ comments remain mixed. There is a degree of uncertainty concerning business conditions for the balance of the year.”

Thus it may be presumed that the US economy is still growing but at a modest pace. ISM numbers above 50 indicate positive growth rates. In other words the US economy is not in recession which will have come as something of a relief to the increasingly bearish mood. The employment numbers and hiring intentions indicated in the survey however remain a continued source of economic weakness and uncertainty. The employment sub-index registered 51.6 – therefore also indicating growth but was down from the 52.5 level recorded for July 2011.

Clearly very weak employment growth is the Achilles heel of the US economy and presumably of the re-election ambitions of President Obama. He will address the combined houses of Congress on Friday – on his plans for the economy – but by all accounts expectations are not high about any immediate policy breakthroughs. What could do a great deal for business confidence in the US would be clear directions from the President and his administration that the long term fiscal and debt issues facing the US are being addressed in a serious and realistic way. The concern is that the focus of policy will be on additional short term stimulus measures unlikely to find approval in the House.

The European debt crisis continues to add uncertainty and volatility to the markets with the Spanish government (with the active support of its main opposition) leading the austerity stakes (including support for a constitutional amendment to entrench fiscal conservatism) and the Italian government trailing behind by a day or two – though seemingly able to push through its own austerity programme through the Italian Senate today.

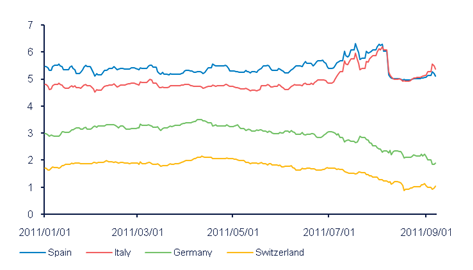
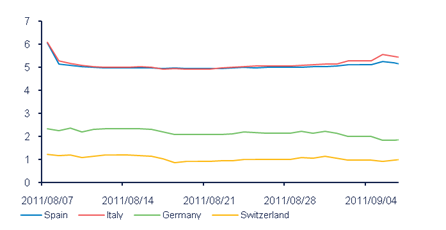
The reactions in the bond market are shown below. As may be seen Spanish 10 year bond yields have now fallen below Italian yields, having traded well above them this year. Such are the rewards for fiscal realism. As may also be seen these yields have been kept under control with ECB support this month. That the key governments under market stress seem able and willing even to bite the austerity bullet will help the ECB to maintain its support. Perhaps it will also encourage Germany to support a Eurozone bond market and the euro in Parliament: the German Constitutional Court has just ruled that this is the responsibility of the Bundestag Budget Committee – so rejecting claims that such support would be unconstitutional.

Euro 10 year bond yields in 2011, daily data
Euro 10 year bond yields in August 2011, daily data

Interest rates: From expectations of a hike to a reduction

The money market is now pricing in a significant probability of a 50bps cut in the repo rate by early next year. The three month interest rates offered by the SA banks on forward rate agreements have been declining sharply since mid August and they declined further last week indicating a more than 50% chance of a 50bps cut within six months.

SA Bank Forward Rate Agreements (FRAs)
The probability of a 50bps cut in the SA three month interest rate

It seems clear that the focus of the Reserve Bank is now firmly on the state of the SA and the global economy rather than on any short term blips in the inflation rate, over which the Bank has little influence. Without a series of unexpectedly good news about the global economy (and the SA economy, especially about demands for credit), these lower interest rates (now factored into and expected by the financial markets) will become a very necessary reality.

New vehicle sales: Business boost

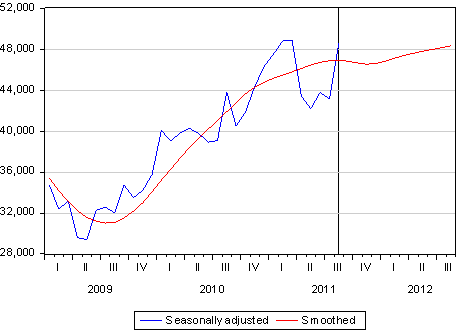
The producers and distributors of new vehicles enjoyed significantly improved trading results in August 2011. Domestic sales were up to 51 436 from 45 686 units sold in July 2011. On a seasonally adjusted basis this represented an impressive increase of 5 471 units in the latest month after flat to declining sales on a seasonally adjusted recorded after March 2011. This recovery, if sustained, would see monthly sales of between 46 000 and 48 000 units to August 2012. This would be regarded as a very satisfactory outcome for the largest contributor to manufacturing output in SA.

New unit vehicle sales (seasonally adjusted and extrapolated)

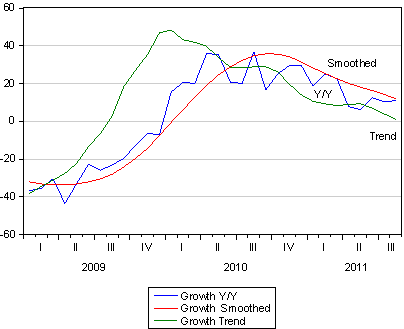
The recovery in August 2011 sales arrested but did not reverse the declining growth trend that became apparent earlier this year.

The new vehicle sales growth cycle

Sales to businesses, including passenger car sales to rental car companies, new light commercial vehicles, bakkies and minibuses, were particularly strong, while sales of medium and heavy trucks were especially buoyant in August. Export sales of 24 835 units were recorded in August which must also be regarded as satisfactory given uncertainties about the sate of the global economy.

Vehicle sales thus continue to be one of the SA economy’s brighter spots. That growth in demand seems now to be coming more from the investment decisions made by businesses is very welcome given the weakness to date in the willingness of the private sector to add capacity.

JSE earnings: No flash in the pan

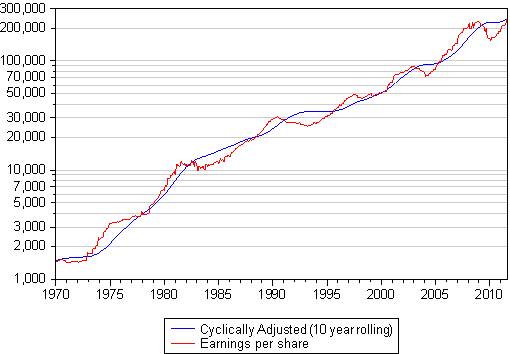
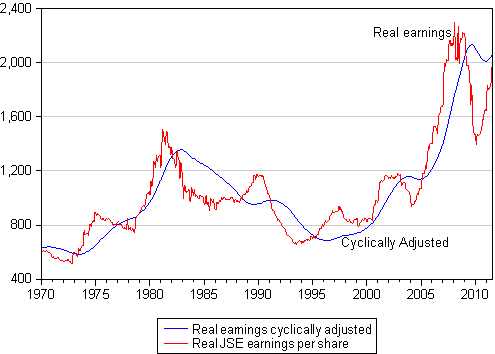
JSE Index earnings per share in current prices have now regained the previous record levels attained before the global financial crisis and the subsequent global recession, which caused earnings to decline very sharply. As we show below, real JSE earnings, adjusted for rising consumer prices, have also recovered very strongly (though are not yet back to pre crisis levels). This should be regarded as a very encouraging signal about the quality of the companies listed on the JSE.

In the figures below we also compare these earnings to what we measure as cyclically adjusted earnings. These are earnings that attempt to look beyond current earnings and the current state of the economy to establish the long term trends that should drive long term valuations. In current price terms JSE earnings per share by end August 2011 have regained their long term trend (a trend that factors in the post financial crisis decline). In real terms JSE earnings per share have a little way to go to regain their long term trend but are well set to do so.

JSE ALSI Index earnings per share- reported and cyclically adjusted
Real JSE ALSI Index earnings per share- reported and cyclically adjusted

The real earnings series pictured above deserves close attention. It should be noticed that in real terms JSE real earnings per share only regained their 1980 levels as late as 2005. This recovery in real earnings that began only in 2000 and continued to 2008 represented an extended period of exceptional growth. It was a huge boom in earnings and dividends for shareholders, which was closely linked to higher metal and mineral prices that had suffered from an extended period of deflation since the early eighties. The role of Chinese and Asian growth in stimulating demand for commodities has been crucial for the surge in commodity prices and the earnings of resource companies that account for close to half of all JSE earnings.

The important question that was asked at the end of the earnings boom in 2008 was whether or not earnings in real terms could ever recover their 2008 levels. Or in other words, could the surge in JSE earnings between 2000 and 2008 (that extended to all sectors of the JSE) form a new base from which JSE earnings could grow further in real terms?

The recent recovery in real JSE earnings, that are now almost back to their previous record levels, provides impressive support for the view that JSE real earnings have indeed established a new higher base. This is testament to the global reach of the companies listed on the JSE that are much more exposed to the global economy than the SA economy.

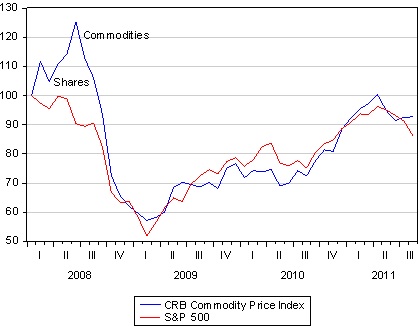
The outlook for JSE earnings in real or US dollar denominated terms will continue to depend upon the global economy from which commodity prices, equity valuations and the rand itself will take their cue. The global economy has recovered from the recession of 2009 and commodity prices have recovered accordingly. We show below that global commodity prices suffered even more than did equities from the financial crisis. However recently commodity and metal prices have held up better than equities, helping to support the view that global growth will not turn markedly weaker.

The S&P 500 and the CRB Commodity Price Index (2008 = 100)

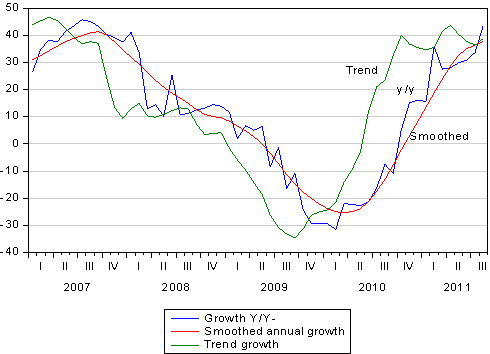
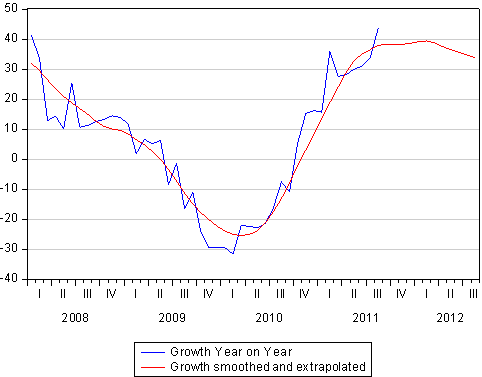
We show below that the JSE earnings cycle by end August 2011 (with many of the first half earnings reported) has realised growth rates to date of about 40%. As may also be seen the trends in this growth rate has not declined but appears to have stabilised at these levels. Thus if recent trends are maintained, helped essentially by stability in commodity prices, further growth can be expected. When we extrapolate recent trends it suggests that significant further growth in earnings per share may well be realised.

The JSE Earnings per share cycle to 31 August 2011

If this were to be the case for JSE earnings per share (as mentioned such earnings outcomes would have to be supported by sustained growth in the global economy) the JSE would be very well and further supported by very good earnings fundamentals.

The JSE earnings per share cycle, smoothed and extrapolated