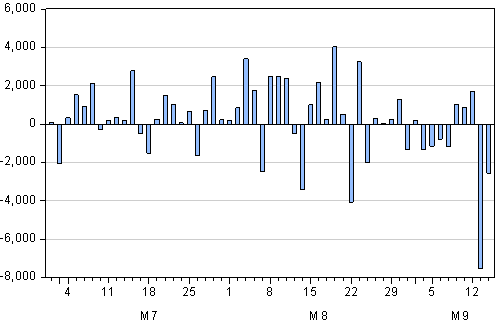
Foreign investors significantly reduced their exposure to rand denominated RSA bonds over the past two days. They were net sellers of over R7bn on Tuesday and sold a further R2.55bn yesterday. This quarter foreign investors had become enthusiastic net buyers of rand and other local currency denominated emerging market bonds in response to the weakness and volatility in euro denominated bonds. Clearly what had added to rand strength and forced interest rates lower in July and August took something away from the rand over the past two days and reversed recent moves in longer term interest rates.
The term structure of SA interest rates has shifted out over the past few days with the yield curve becoming significantly steeper over the one to five year terms.
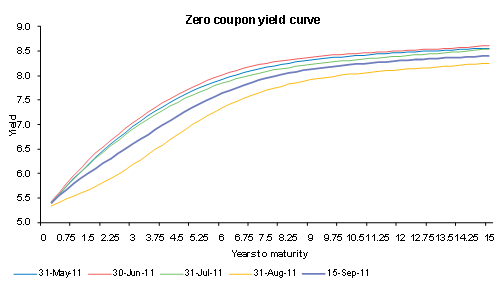
The yield on the benchmark four year R157 increased from 6.52% on 31 August to 6.94% on 14 September representing an increase of about 60bps since lows reached on 8 September. The impact of foreign sales can also be seen in the one year rates implicit in the yield curve.
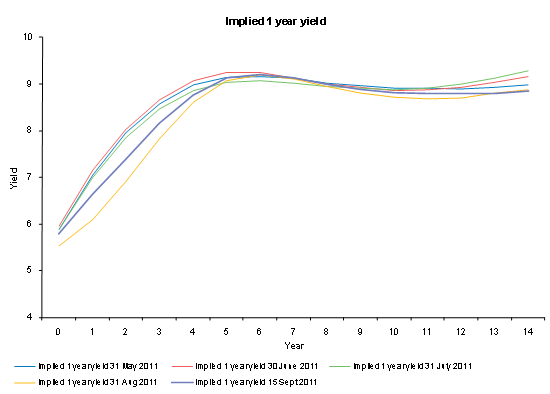
The one year rate, as expected 12 months ahead, has increased from the 7.82% implied on 31 August to 8.15% yesterday. Further along the yield curve the implied shorter term rates are little changed. Further steepening in the yield curve might follow the meeting of the Monetary Policy Committee (MPC) of the Reserve Bank next week. The MPC may choose to clarify its intention to reduce the repo rate in due course. It may even cut rates next week but this must be regarded as unlikely. It should be said that if the case for cutting rates is a stronger one – given the weakness in the global and domestic economies – the case for cutting sooner rather than later will also be a strong one.
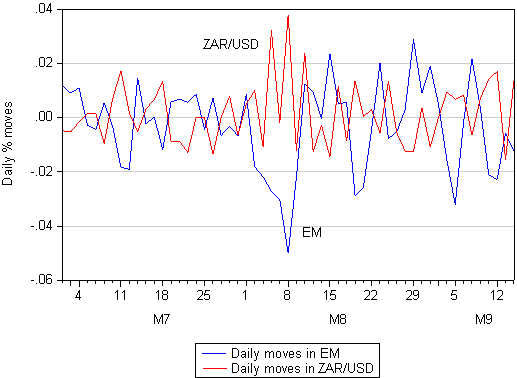
The rand however continues to be very well explained by global risk appetite, as fully reflected in the direction of the EM equity markets. Our model, which has successfully explained the rand/US dollar with the MSCI EM Index as the only explanatory variable, predicts the current value of the rand as R7.45.
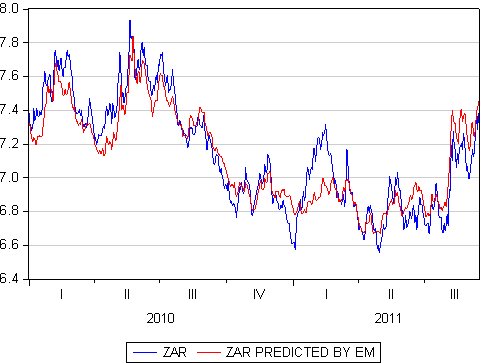
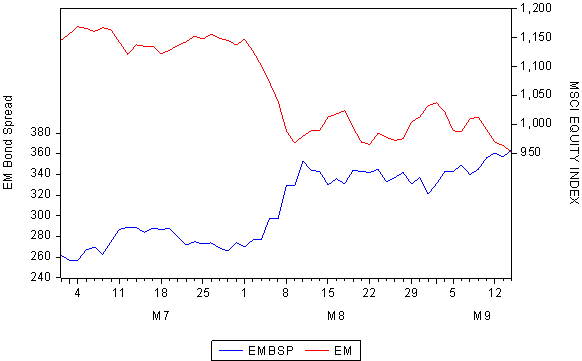
Thus despite the influence of the bond market the rand is very well explained by the trends in equity markets and we presume will continue to do so. The risks in the EM equity markets are fully reflected in the spread offered by the EM dollar denominated bond index. As we show below, as the risks associated with the Eurozone debt and banking crisis increase (reflected by a widening yield spread over US Treasuries) the equity markets move in the opposite direction. And as EM equity markets go, the rand tends to move in the opposite direction.
