Brian Kantor and Loane Sharp
Kantor is Professor Emeritus in Economics UCT and Head of Research Institute Investec Wealth and Investment. Sharp is Director at Prophet Analytics
The most important question in economics – why some countries remain poor while others grow rich – has been definitively answered. According to the United Nations, between 1990 and 2015 the poverty rate in the developing world dropped from 47% to 14%. More than a billion people escaped poverty over the period.
The unequivocal cause of declining poverty has been strong and sustained economic growth. According to the International Monetary Fund, economic growth in developing countries has averaged 4.9% per annum since 1990. At this rate, with population growth in developing countries now 1.2% per annum and steadily falling, real income per person will more than double over the next 20 years. Poverty, in other words, will be substantially eliminated within a generation.
The primary question having been answered, economists have increasingly directed their attention to a secondary question – why some people within a country remain (relatively, sometimes absolutely) poor while others do much better earning and spending their incomes. It is right and good to prefer that the benefits of economic growth be distributed widely rather than narrowly. But in highly competitive markets, this may not be possible – especially in labour markets, where incomes are driven up by competition between employers, held down by competition between workers for work and ultimately settle at a mutually agreed value for the expected productivity of the employee that differs widely according to skill experience and ability. Yet growth, even when unevenly distributed, generates revenues for government that can be used to provide the most vulnerable with extra spending power and valuable benefits in kind (education housing and medical care) that will add to their income generating capacity and mobility.
In contrast to the global experience, SA’s poverty rate has been stubbornly high and recently rising. According to Statistics SA, 55% of the population is defined as poor, living on less than R11,904 per annum. (current rands) Over the period that real per capita income growth in developing countries averaged 3.7% per annum, SA per capita income growth averaged a mere 0.7% per annum.
While poverty remains high, Statistics SA’s latest inequality report, authored by the Southern African Labour and Development Research Unit (SALDRU) at the University of Cape Town, despite its summary view that income distribution in SA is largely and unhappily as unequal as it has been since 1993, shows in fact, that inequality has declined. In 2006, the top 10% of income earners enjoyed 12.5 times the income of the bottom 40%. By 2015, this Palma inequality ratio had declined to 10.2 – significant progress over a short period of time. In 2006, the top 10% incurred 8.6 times the spending of the bottom 40%. By 2015, the ratio had fallen to 7.9 times – also significant progress over a short period of time.
This seems counterintuitive: how can poverty increase and inequality decline? As we explain below, the middle class, not the poor, have been the primary beneficiaries of government policies. We pretend to care for the poor but often act otherwise, no doubt because it makes political sense. Many of the economic policy interventions of the SA authorities would not pass the Rawlsian test. That is would the intended policy be helpful to the economic interests of the least well off 20% of the population?
The distribution of spending is significantly more equal than the distribution of income, thanks to taxes, welfare spending, government services and saving (i.e. spending foregone) largely undertaken by the top 10% of income earners. They who are responsible for almost all the wealth accumulated in SA, and without whom the economy would perform even less well and be even more dependent on foreign capital.
The inequality report rightly concludes that lack of economic growth and lack of job creation are the main causes of poverty and inequality. Unfortunately, the report contains much psychosocial nonsense. An example: “High levels of inequality mean that large segments of a society may be excluded from economic opportunities [since] people who receive the best opportunities are the ones who are the richest, and these are not necessarily the same as the ones who are the most talented or who would make the best use of such opportunities.” In other words, rich people cause poverty. Surely it is poverty not inequality that denies opportunity.
To give another example: “Adding a couple of thousand rand to the monthly pocketbooks of the poor could elevate them above the poverty line and set them on a better life trajectory […] but it doesn’t immediately result in greater equality between the outcomes of certain groups” (emphasis added). In other words, eliminating poverty is unacceptable because, in doing so, white people might get better off.
The global economic experience indicates that the self-interest and creative drive of a tiny group of people – a small number of extremely successful business owners and their high-skilled employees – have sharply reduced poverty and will soon eliminate it altogether. They are the crucial agents of economic growth. Respecting their achievements, tolerating their high incomes and protecting their gains becomes the essential social contract. Redistributing these exceptional gains through progressive income tax and well-directed government spending is a further part of the social contract. Successful economies manage to grow and redistribute – in that order.
It hardly seems worth the effort to conduct a comprehensive survey of inequality in SA every few years when the results are so self-evident as to be nearly worthless. The economy hasn’t grown, unemployment has risen and therefore poverty and inequality remain significant problems. No surprise in that. We should like to know, instead, how economic growth and job creation might be achieved or, indeed, is being frustrated.
We know, of course, what causes economic growth and the attendant benefits of investment, employment, innovation, competition and taxes: business profitability. We know what causes job creation and the attendant benefits of economic mobility, childcare, healthcare, retirement savings and workplace safety: economic growth and the profitable employment of labour.
On the economic growth front, it is therefore alarming that SA companies’ return on assets (gross operating surplus / gross fixed capital stock), having peaked at 17.9% in 2004, will this year likely drop below 10% for the first time in 30 years. If business profitability does not recover, economic growth cannot. Analysis of the financial statements of listed companies reveals a similar decline in the return on capital.
On the employment front, it is alarming that, whereas in the 25 years prior to 1994 an additional 1% of economic growth was associated with a 1.3% increase in employment, since 1994 an additional 1% of economic growth was associated with a 0.2% increase in employment. Even if economic growth occurs, job creation cannot occur if the link between economic growth and employment has been severed.
The causes of economic growth and job creation, and therefore the solutions to poverty and inequality, are well understood. Growth will follow business liberalisation, and jobs will follow labour market liberalisation. Yet the report unfathomably frames these as complex and intractable problems. It surely does help to promote an endless agenda for the favoured consultariat and their flow of proposals to tinker further with the economy.
The report usefully observes that inequality in SA is overwhelmingly related to labour market inequalities: inequality between those who have jobs and those who don’t; inequality between public sector and private sector employees; and, within the private sector, inequality between skilled and unskilled employees.
The labour market is clearly central: incomes from work account for three-quarters of all incomes earned and about two-thirds of overall inequality comes from inequality in earnings. Inequality and poverty and the inability of the economy to grow faster are largely attributable to the failure of the economy to provide more employment.
There are serious problems with the survey methodology that is the basis for the report. Some of the problems are true of all surveys. For instance, people are notoriously cagey about their true income and spending patterns, especially when an individual, completing the survey on behalf of others in the household, may fail to disclose the true picture to other individuals in the household, let alone government enumerators. Other problems are specific to this survey. For example, households are asked to report the spending they actually incurred rather than the value of the goods and services received. Heavily subsidised government school fees are a small fraction of the total cost of education, yet only the minimal out-of-pocket fee is reported as expenditure with no adjustment for the full value of the benefit. Likewise subsidies related to healthcare, housing, electricity, water, sanitation and many other government services are not reflected as de facto benefits at their costs of supply, and the costs of administering government programmes are nowhere accounted for in the estimates of expenditure.
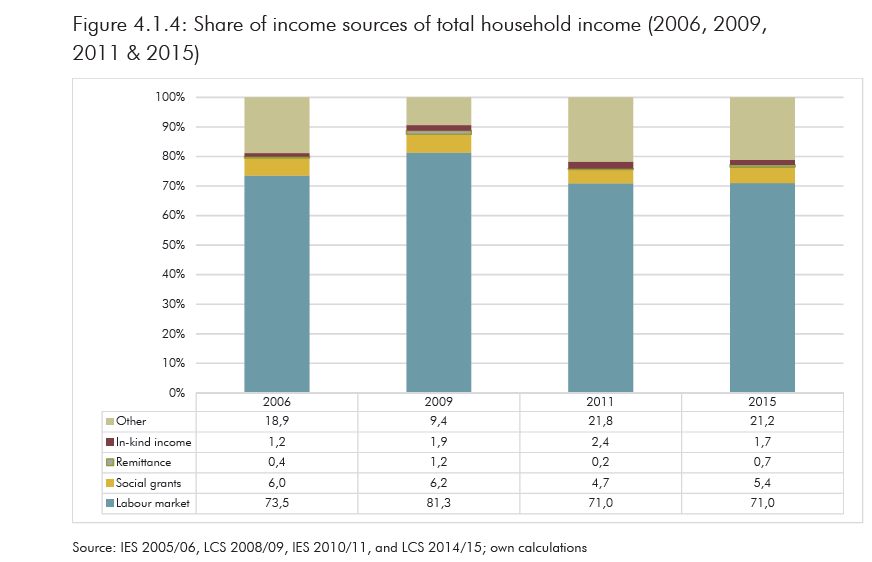
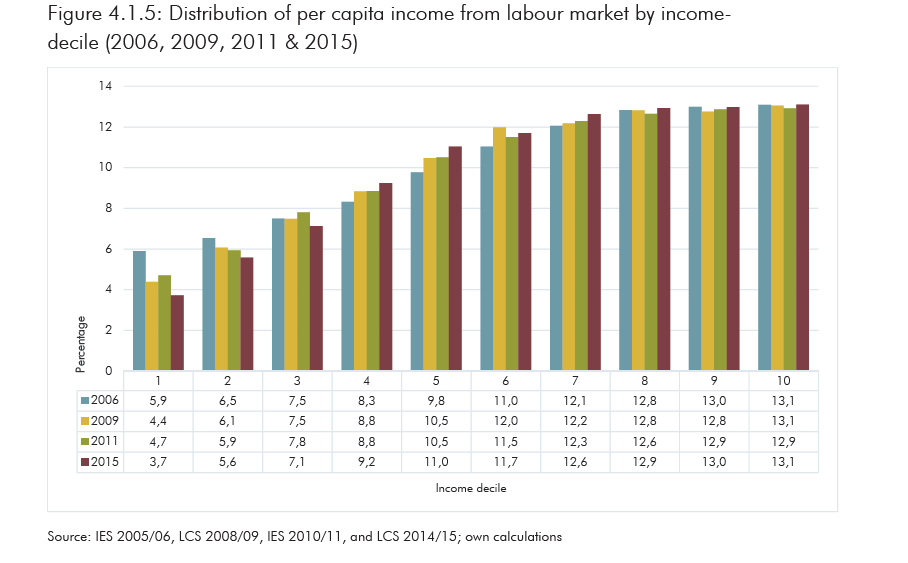
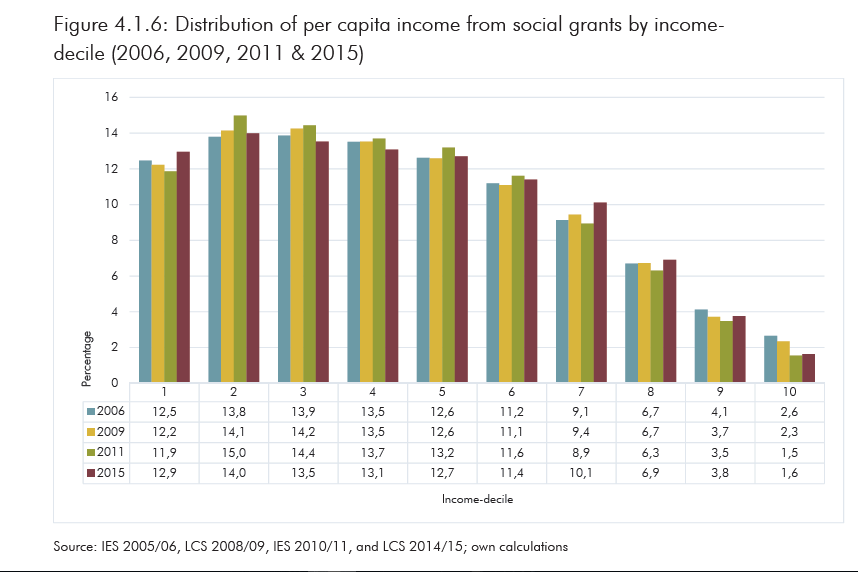
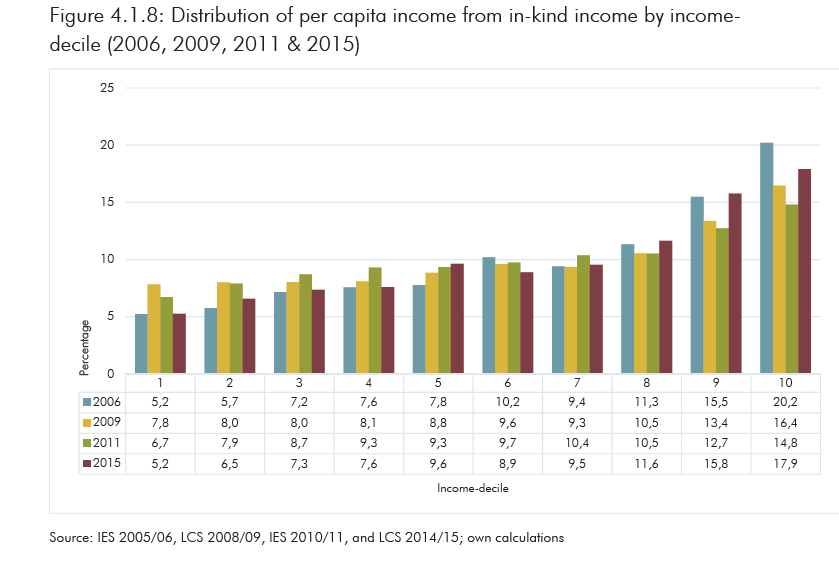
As seen in Figure 4.1.4, income from the labour market is the main source of income, increasing from 73.5% in 2006 to 81.3% in 2009 ( after a brief period of strong GDP growth) before declining to 71.0% in 2011 and then remaining constant between 2011 and 2015. The proportion of social grants to overall household income has slightly fluctuated over the years: the proportion decreased from 6.0% in 2006 to 5.4% in 2015. The share of in-kind income gradually rose from 1.2% in 2006 to 2.4% in 2011 before dropping to 1.7% in 2015. Meanwhile, the share of remittances to overall income fluctuated over the years and reached its highest proportion in 2009 contributing 1.2% to overall income. Figures 4.1.5 and 4.1.6 show the distribution of labour market income and social grants, respectively, by income-decile. From these figures, we observe growing dependence on social grants and declining reliance on labour market income in the bottom deciles. By contrast, in the top deciles there was a much greater reliance on labour market income and less reliance on social grants. Therefore, social grants to some extent contributed to the improvement in income inequality.
Unfortunately, the report does not attempt to explain why these differences exist and persist. Except by extensive reference to race. Do richer SA whites (and the rich of other races) harm or serve the economic interest of SA? Should the objective of economic policy be to retain their valuable services- or to do better without them in the interest of equality? One suspects that many of those who interest themselves in issues of inequality in SA and many others with influence over economic policy find it very difficult to give an unequivocal response to this question. In other words the economic growth that could lift the 33 million poor South Africans out of poverty would be unacceptable because a few white South African might benefit disproportionately from the process.
The truth is that the government has aggravated rather than alleviated inequality. Incomes of high-skilled people have been boosted by immigration restrictions and emigration. Incomes of low-skilled people have been diminished by uncontrolled immigration of low-skilled people from neighbouring countries. Social grants have raised the reservation wage of low-skilled people discouraging their participation in the labour force, particularly in the rural areas. Government education is so poor that a staggering proportion of enrolees drop out of school, eliminating what chances they might have had of finding work. Extensive protections against especially performance-related dismissals have reduced productivity and raised the risk of employing people who prove not worth their hire.
Given all the obstructions to hiring and firing labour – and all the unintended consequences of poverty relief in influencing the willingness to supply labour – it should be no surprise that the distribution of income in SA is what it is. It is well explained by the political interest in “good jobs” rather than in total employment – especially in the highly indulged public sector – and the support for unions and labour regulations that protect those with jobs at the expense of those seeking work. Slow growth in the number of people employed and the inability of the poor to find work should not be regarded as unintended. It is the predictable outcome of policy choices made by the SA government.
Two other important forces on the income distribution should be recognised. Firstly, the expenditure of households headed by men is significantly higher than spending by households headed by women. In 2015 the average expenditure of the households headed by men was twice as high as of those headed by women. (38180/18406) A very similar ratio (2.1) prevailed in 2006 (27058/12965) (2015 prices). This suggests that female-headed households have only one person working whereas male-headed households have two people working with very similar average incomes per worker. It appears that the important gender gap is related to the presence or absence of a working male in the household.
Secondly, average urban incomes are much higher than rural incomes. The urban/rural divide is even more dramatic. In 2015, on average, urban households spent R40,290 in 2015 and rural households R11,658 – a ratio of 3.5 times. In 2006, this ratio was very similar, 3.7. These expenditure gaps are attributable more to employment opportunities than wage differences. Of the total population, 65.3% are urban and 34.7% rural.
The policy implications of these facts of SA economic life seem obvious: more households headed by men, and more of them established in the urban areas. Social assistance and free housing and utilities that do not distinguish between urban and rural areas makes overcoming poverty through employment ever more difficult, because it encourages rural settlement and unemployment especially now that a national minimum wage is the rule.
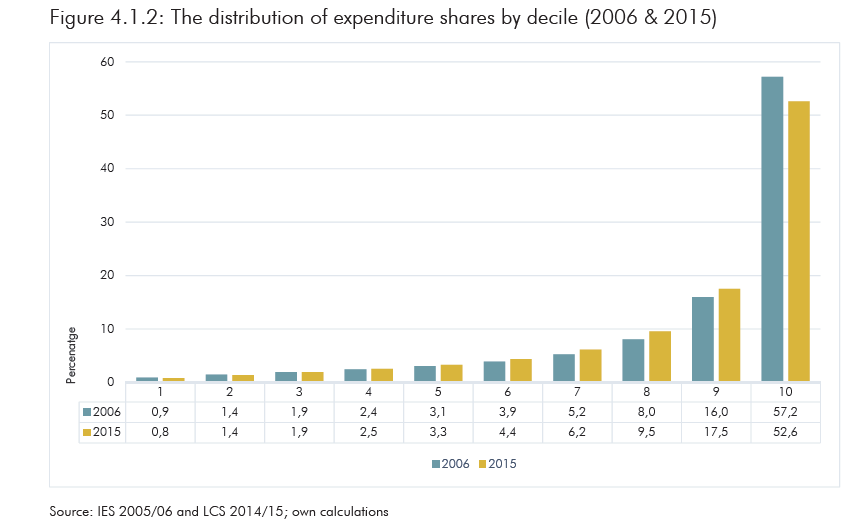
In 2006, the top 10% spent 57.2% of all expenditure or 8.6 times that of the bottom 40% with a mere 6.6% share. By 2015, this ratio had declined from 8.6 to 7.9 – less inequality. Yet the share of the bottom 40% remained at 6.6%. In 2006, the middle 50% had a 36.2% share of all expenditure. By 2015, the expenditure share of the top 10% was down to 52.6%, and that of the middle 50% up to 40.8%, of all spending. Thus, a decline in the ratio (top 10%/middle 50%) from 1.81 to 1.32 times, while the ratio of the spending of the middle 50% to that of the poorest 40% rose from 5.5 times to a less equal 6.2 times. The large gains in the share of expenditure have been realised by the 7th, 8th and 9th deciles whose combined share improved by a full four percentage points.
The redistribution of spending power in SA has been to middle-income earners – not the poor. Perhaps especially to the new members of the upper middle class who are employed by government and its enterprises and institutions. If the economy is to grow faster and incomes and spending power are to be more equally spread, the interests of the poor and the rich will have to predominate in policy settings, much more than they have done to date.
Sources:
All charts and statistics are sourced from this study: Statistics South Africa (2019), Inequality Trends in South Africa A multidimensional diagnostic of inequality, Risenga Maluleke, Statistician-General, Report No. 03-10-19