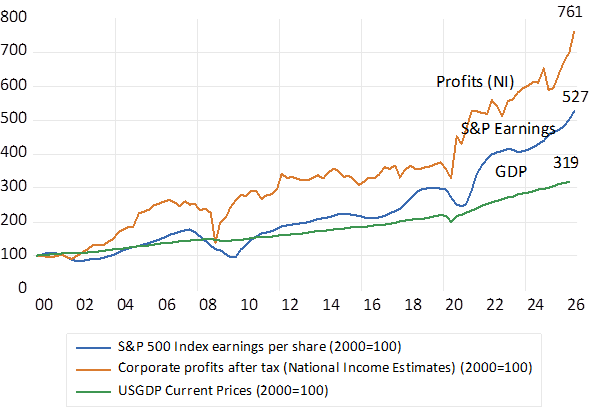
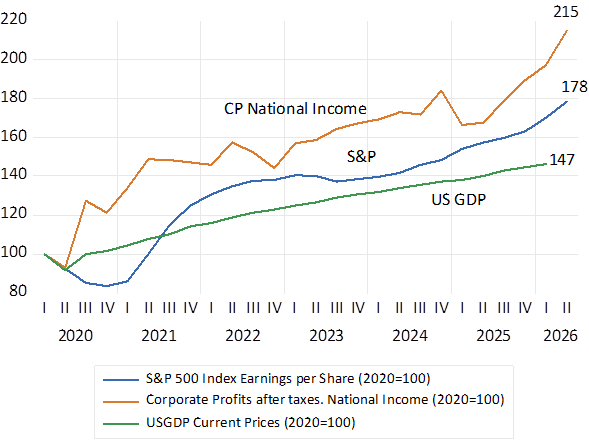
US Corporations are delivering explosive growth in their profits. Bottom line earnings are not only growing very rapidly they are growing significantly faster than the economy at large, as they have done consistently since 2000. This growing share of profits in GDP has accelerated since 2020. Since Q1 2020 Corporate Profits after tax (CP) as measured by the National Income accountants are up 2.15 times, S&P 500 earnings, largely included in CP have grown 1.8 times while the GDP is up by 1.5 times since 2000. The outlook is for further growth in profits in the year to come- is of the order of 30% plus higher on current estimates of S&P 500 earnings after tax . The prices of the average S&P listed company – weighted by size has been running ahead of current reported earnings- presumably anticipating further growth in reported earnings.
Fig. 1; US Nonfinancial Corporations; Profits after Taxes, S&P 500 Earnings, and GDP (2000=100) Quarterly
Source; Federal Reserve bank of St.Louis, Bloomberg, Investec Wealth & Investment
Fig. 2; US Nonfinancial Corporations; Profits after Taxes, S&P 500 Earnings, and GDP (2020=100) Quarterly
Source; Federal Reserve bank of St.Louis, Bloomberg, Investec Wealth & Investment
Clearly the share of all national income attributable to the owners of incorporated US businesses has risen sharply, while the share of employment benefits that make up a much larger portion of all incomes will have declined in roughly the same proportion. It is as well for social stability that many of the workers struggling against minimal real wage growth are also shareholders that have benefitted significantly from more valuable pension and retirement plans.
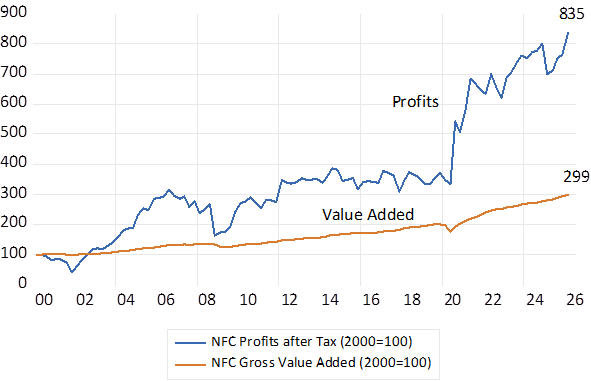
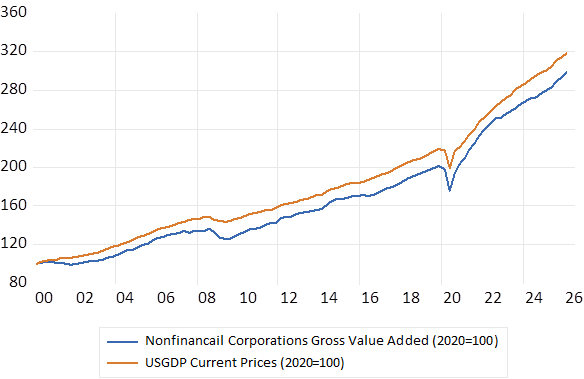
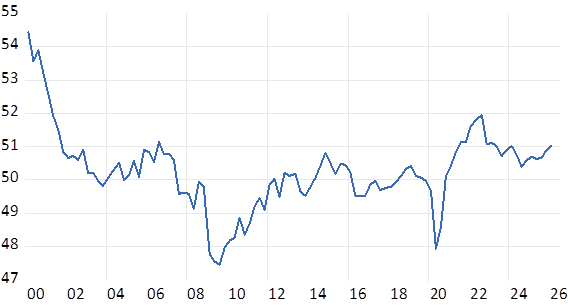
What deserves special attention is that the growth in profits has not come from exceptional growth in the growth in the output of the average US corporation. The top line of the corporate books has grown strictly in line with the growth in the wider economy. The Gross Value Added (GVA) by nonfinancial corporations has grown very similarly to GDP- that is all the Value added in the US. The share of GDP added by now much more profitable non-financial corporations has not changed significantly. It is now approximately 50% of GDP and was higher at 54% of all GDP in 2000.
Fig. 3; US Nonfinancial Corporations; Groos Value Added and Net Profits. (2000=100) Quarterly
Source; Federal Reserve bank of St. Louis, Investec Wealth & Investment
Fig.4; US Nonfinancial Corporations Gross Value Added and GDP Current Prices (2000=100) Quarterly
Source; Federal Reserve bank of St. Louis, Investec Wealth & Investment
Fig.5; US Nonfinancial Corporations; Gross Value Added/GDP % p.a. 2000-2026; Quarterly
Source; Federal Reserve Bank of St. Louis, Investec Wealth & Investment
The big story about the US economy is that it is not about top line growth – not about exercising the economies of scale – growth in sales and a growing share of all spending and economic activity – that have made US businesses more profitable. It is the improvements, the gains in the efficiency of their operations that are reflected in the bottom lines of the average US corporation- listed and unlisted -that are responsible for the additional profit margins and earnings. Better use of capital, relatively less capital employed, utilising a more productive work force while responding to a strong focus on required returns on capital should be recognised as the sources of much improved profitability. And AI and its application promise more efficiency gains and strong support of good returns on additional shareholders capital put to work Capital light rather than capital heavy operations is likely to characterise the new service dominated economy.
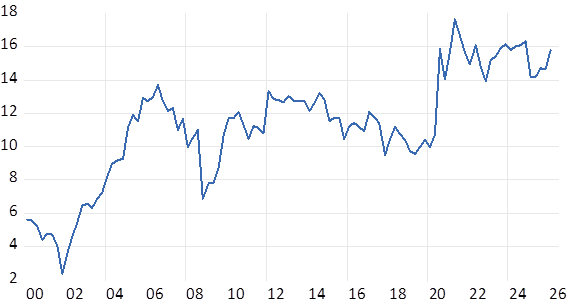
It is the dramatic improvement in the profitability of each unit of gross output added (GVA) that is the remarkable feature of US business. The Federal Reserve Bank of St Louis has calculated the profit per unit of real value added by US nonfinancial business. This unit profit has grown from approximately 4% in 2000 to 20% in 2026. This represents what you might describe as a five times improvement in efficiency over 25 years. In 2020 this measure (profits per unit of output) was 12% from which it has grown to 20%. My own calculation of the ratio of the profits of US nonfinancial corporations to their gross value added ( GVA) indicates the same trend. This net profit ratio was below 4% in the early 2000’s – it grew to 10% by 2020 and is currently a lofty 16%.
Fig.6; US Nonfinancial Corporations; Profit per unit of Real Gross Value Added
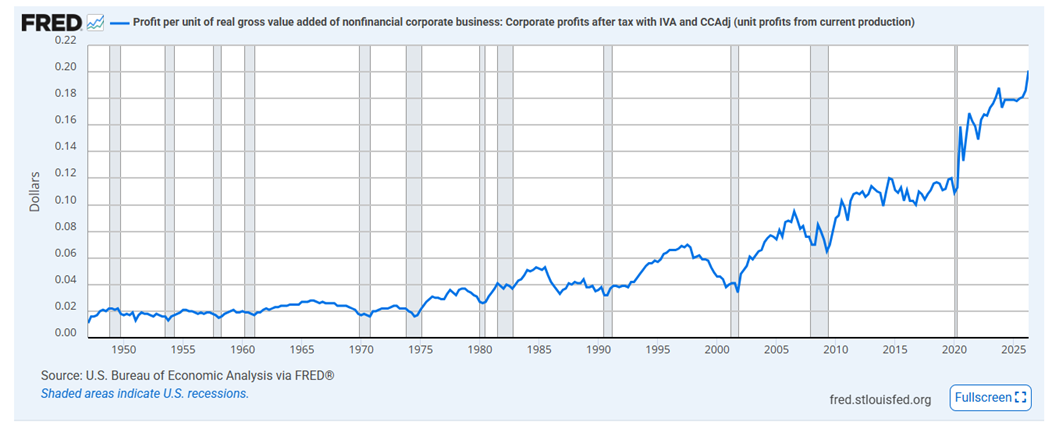
Fig. 7; US Nonfinancial Corporations. Profit Ratio %. Profits after Taxes/Gross value Added. Quarterly 2000- 2026
Source; Federal Reserve Bank of St. Louis, Investec Wealth & Investment
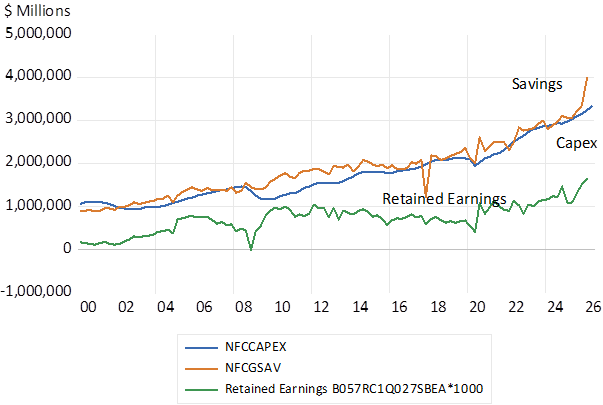
While US corporations have become more profitable it is hard to discern any significant changes in how they allocate their surpluses. Their savings and capex continue to be closely matched – free cash flow after capex is still positive and almost all of capex is funded by cash generated from operations. Though a recent increase in savings and retained earnings can be noticed. They remain willing to invest in growing their enterprises. But no runaway investment boom is apparent for the average company. Real capex by all nonfinancial corporations is up by a healthy 23% since 2020 a confident but not dangerously exuberant response to the increase in profits and profit margins it would seem. Current Capex of Nonfinancial corporations is of the order of 3 trillion USD
Fig. 8; US Nonfinancial Corporations – Capex, Savings and Retained earnings
Source; Federal Reserve Bank of St. Louis, Investec Wealth & Investment
Fig. 9; US Nonfinancial Corporations; Real Capex (2020=100)
$ Billions
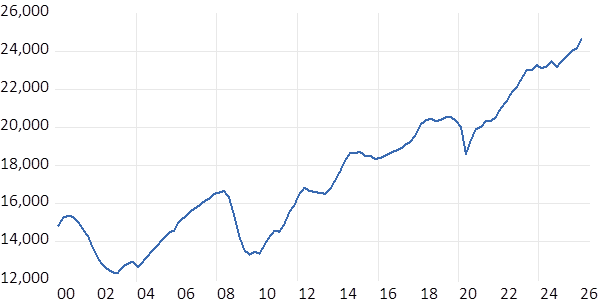
Source; Federal Reserve Bank of St. Louis, Investec Wealth & Investment
Though true enthusiasm to invest in growth may well describe the so-called hyper scalers that are competing so actively and expensively for the AI spend. These super scalers – Google, Amazon, Microsoft Meta and SpaceX are scaling up their operations ompeting for the expected AI spend and the profits that are expected to come with such spending. They are forecast to be spending over 1.2 tr dollars of Capex by 2028. Except for SpaceX, they are also very profitable companies, currently returning over 20% p.a. on invested capital.
The cure for high profits is high profits -the search for additional profits that requires more capex and growth in capacity to supply customers. Actions that in time will compete away returns on capital. This is the way competition works. And this next time will be no different if business is left to pursue its own profit seeking objectives. The key question for investors is just how long it will take for profit margins to come under serious pressure, how long it will be for the moats that protect established companies to be breached and returns on shareholders capital revert to something like normal-about 10% p.a? Though as has been shown the recent profit share trends- some 20 years or more of them – have been in the opposite direction- and have come to be well recognised by the market in US stocks.
A Postscript for the SA Economy.
I have applied a similar approach to the performance of the South African Nonfinancial Corporations. Their results are reported in the Reserve Bank Quarterly Bulletin in the Production and Distribution Accounts of National Income. The annual data is available only from 1995. And the non-financial corporations in the estimates of Value Added and profits include the very large State-Owned Corporates, Eskom and Transnet that have been an important part of GVA but generally unprofitable.
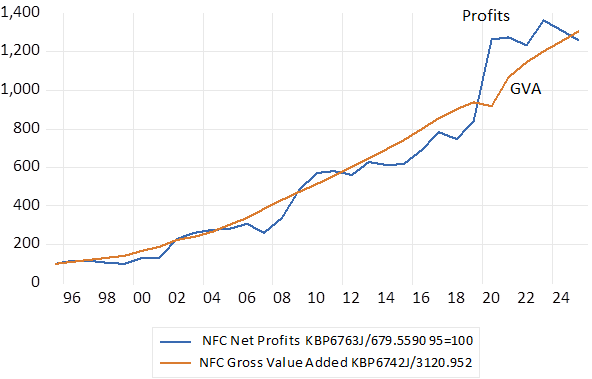
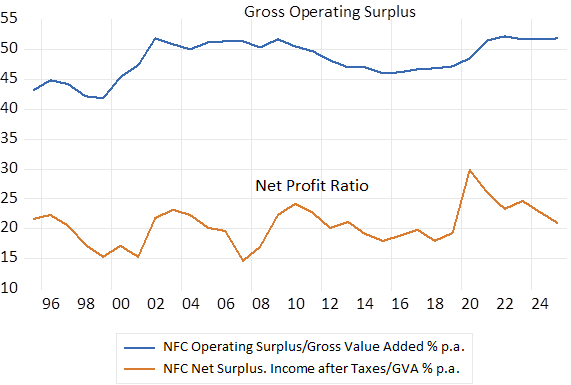
Unlike the US, the SA Nonfinancial Corporations have had a very stable relationship between bottom line earnings and their GVA. The profit ratios – both at the gross and net levels have remained largely unchanged – indicating no trend higher or lower in the profit ratios since 1995. The share of operating surplus in GVA has been about 50% and the ratio of income after taxes- Disposable Incomes – have hovered around 20% p.a. without revealing any obvious trend in either direction.
Fig. 10; RSA Nonfinancial Corporations Gross Value Added and Net After Tax Profits (1995=100) Annual Data
Source; SA Reserve Bank, Investec Wealth & Investment
Fig. 11; RSA Nonfinancial Corporations Key Ratios to Gross Value Added
Source; SA Reserve Bank, Investec Wealth & Investment
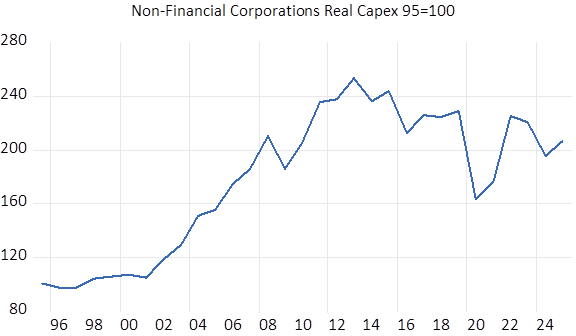
However, unlike their US counterparts the SA Nonfinancial Corporations have significantly reduced their capex when adjusted for inflation – measured as the annual changes in the GDP deflator.
Fig. 12;
Source; SA Reserve Bank, Investec Wealth & Investment
This reluctance to undertake more Capex has made SA non-financial corporations net lenders rather than borrowers in the capital market. Their savings- relative to capex – increased markedly during Covid and has remained unhealthily positive since.
The growth prospects of the SA economy would much improve if the nonfinancial corporations undertook more capex and raised finance from foreign and domestic lenders to do so. On the optimistic presumption, not always fulfilled by the SOE’s in the past, that the capital raised would generate a cost of capital beating return. A business sector that generates cash rather than invests in growth will be able to return cash to shareholders – in dividends and buying back shares- but without growth in GVA and despite satisfactory returns on capital invested they will not command higher P/E’s or Price over Book values – absent growth. It takes growth as well as cost of capital beating returns to add value for shareholders. Paying dividends or buying back shares with excess capital can do no more than stabilise returns infused with large paybacks of excess capital to shareholders. Who are very likely to invest this cash offshore rather than in SA businesses.
What would it take to induce a growth seeking state of mind in the average SA corporation? They would have to be encouraged to add capex by much stronger demands for their goods and services and a sense that capacity was under strain. It would take significantly stronger growth in demands by the household sector. For this response lower borrowing costs would be essential to the purpose of stimulating growth. But are they likely given the recent petrol and diesel price shock to disposable incomes. And that higher borrowing costs are likely to be imposed by the Resbank to add to pressure on spending emanating from the petrol pump. Alas a revival of household spending that could turn businesses that save too much into businesses that confidently invest in growth is likely to be postponed until inflation subsides again.
Fig. 12; RSA Nonfinancial Corporations Savings/Capex Ratio and Net Lending (R million) 1995-2025
Ratio S/Capex Net Lending
R million
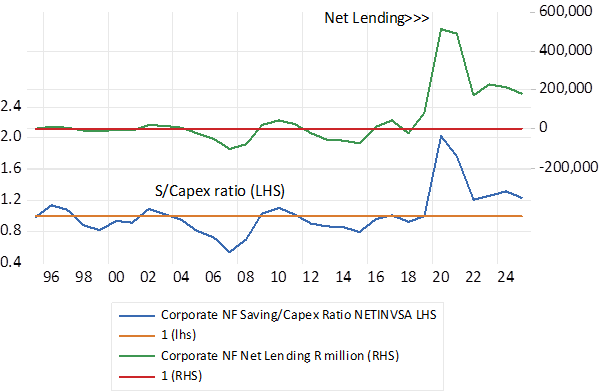
Fig.13 NFC Savings and Capex to GVA ratios – and the share of NFC Savings in All Gross Savings (RHS)
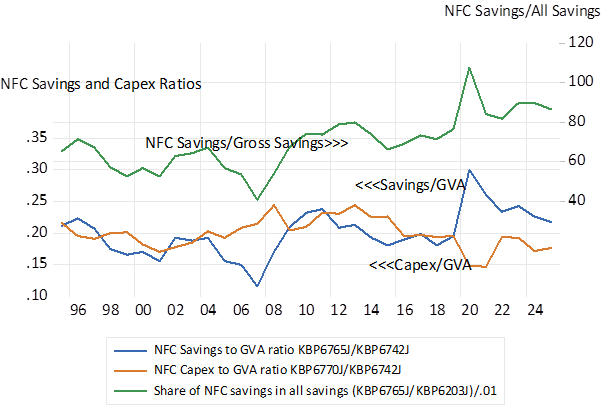
Clearly this reluctance to undertake Capex is an unsatisfactory state of Affairs.