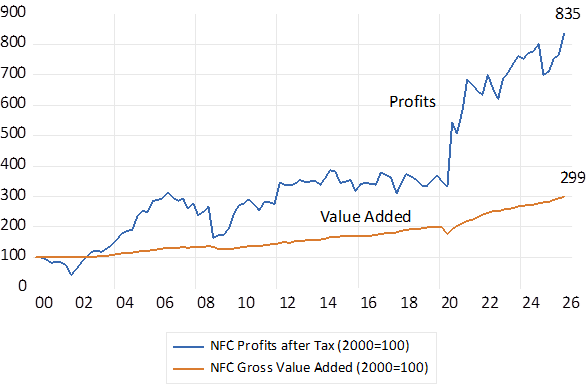
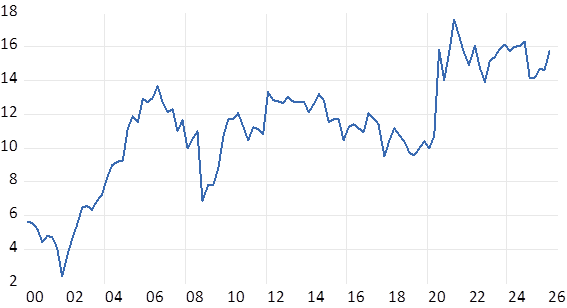
In my previous column I pointed to their extraordinary gains in bottom line profits of the US corporation. Profits as a share of the Gross Value Added (GVA) of all non-financial corporations in the US have risen from about ten per cent in 2019 to about 16% now. This profit ratio was below 4% in the early 2000’s. The growth in profits is much more conspicuous in the bottom earnings line than in top line revenue growth. The average US company has become significantly more efficient. They have also been investing heavily to grow their capacity.
Fig.1: US Nonfinancial Corporations; Gross Value Added (GVA) and Net Profits. (2000=100) Quarterly
Source; St.Louis Reserve Bank. Investec Wealth & Investment
Fig. 2; US Nonfinancial Corporations. Profit Ratio %. Profits after Taxes/Gross value Added. Quarterly 2000- 2026
Source; St.Louis Reserve Bank. Investec Wealth & Investment
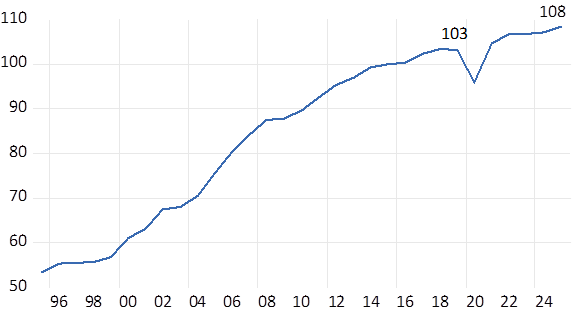
I have examined the performance of the South African Nonfinancial Corporations that accounted for about 60% of all GVA or GDP in 2025. The differences in outcomes are striking. Top line growth in the GVA of SA non-financial corporations has been tepid. Real growth in GVA was less than 5% between 2019 and 2025. Bottom-line growth reveals no surge in efficiency and the reluctance of these corporation to commit to capex or to raise capital is striking.
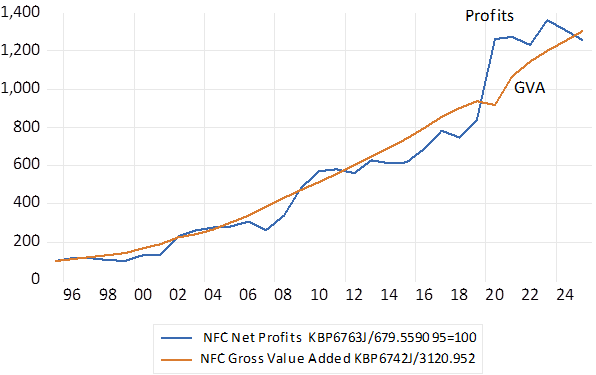
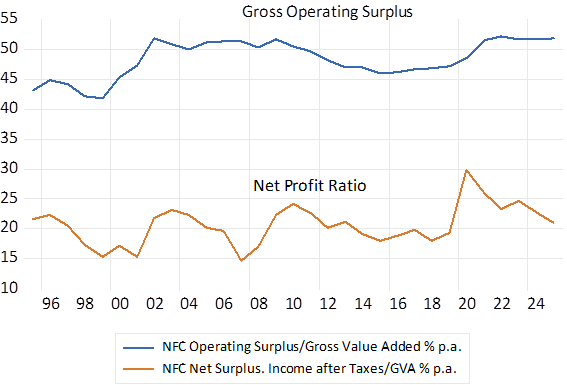
Unlike the US, the SA Nonfinancial Corporations reveal a very stable relationship between bottom line earnings and their GVA. The profit ratios – both at the gross and net levels have remained largely unchanged – no trend higher or lower in the profit ratios since 1995 can be observed. The share of the operating surplus in GVA has been about 50% and the ratio of income after taxes- Disposable Incomes – have hovered around 20% p.a. without revealing any obvious trends in either direction.
Fig.3 RSA Nonfinancial Corporations Gross Value Added and Net After Tax Profits (1995=100) Annual Data
Source; SA Reserve Bank and Investec Wealth and Investment
Fig.4; SA Non-Financial Corporations Real Gross Value Added (2015=100)
Source; SA Reserve Bank and Investec Wealth and Investment
Fig.5; RSA Nonfinancial Corporations; Key Ratios to Gross Value Added
Source; SA Reserve Bank and Investec Wealth and Investment
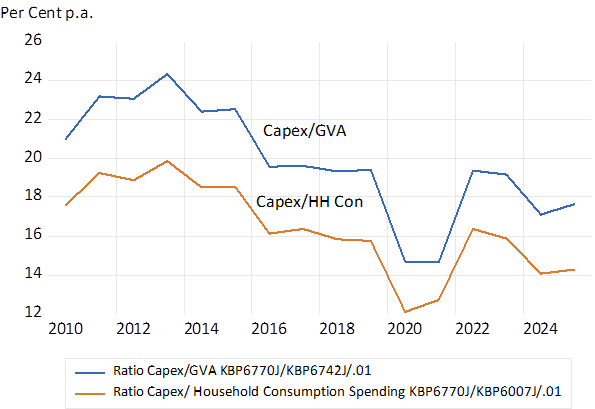
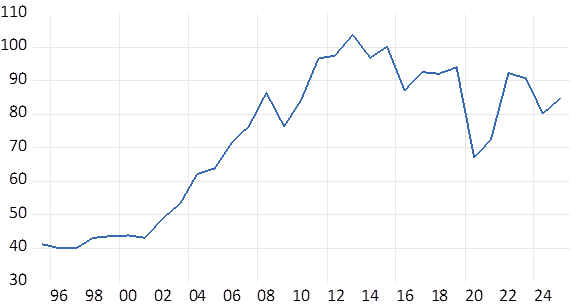
Most distressing and depressing of GDP growth, to date and in the future, is that the capex of SA private business enterprises has stagnated. Adjusted for inflation it is running at about the same level reached back in 2005. The ratio of the capex of non-financial corporations to their contribution to the economy (GVA) was 24% in 2012- it is now less than 18%. The ratio of capex to household consumption spending follows a very similar pattern.
Fig. 6: Non-Financial Corporations; Ratio of Capex to Gross Value Added and to Household Consumption Spending
Source; SA Reserve Bank and Investec Wealth and Investment
Fig. 7; SA Non-Financial Corporations; Real Capex (2015=100)
Source; SA Reserve Bank and Investec Wealth and Investment
How is this failure to grow to be explained? The usual explanation would be to refer to the supply side constraints that have hampered the economy- lock downs and logistic failures are obviously front of mind. Clearly you cannot meet a potential demand for exports unless you can get the metals and minerals and other stuff competitively to markets offshore. Supply side reforms that introduce private style incentives are under way and promise to relieve some of the constraints on meeting foreign demands. And will encourage more capex building mines, harbours roads and railroads.
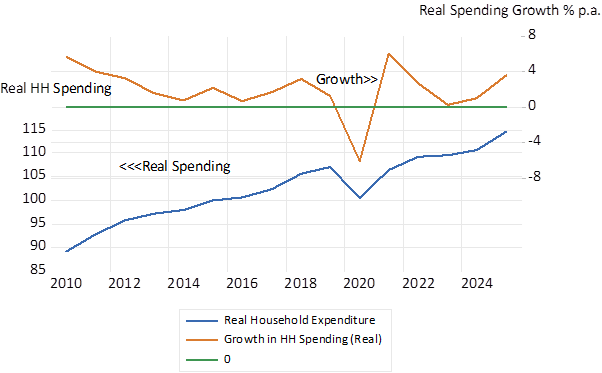
A willingness to invest in additional capacity to meet the growing demands of households for goods and services is also essential to the purpose. The US corporation has had the stimulus of a growing domestic market. The average SA business has had no such encouragement. Household consumption spending adjusted for inflation has grown by about only 7.5% since pre-Covid 2019. The spending of the SA household has grown not nearly rapidly enough to stimulate capex.
The flat ratio of capex to household consumption spending reveals this dependence of capex on final demands. Capex spending is derived from the growth in household spending. It is quite unrealistic to expect otherwise. SA business has been in a holding pattern. It has learned to survive without much growth in its domestic market.
But they could do much better for the economy than paying dividends and buying back shares from still satisfactory cash flows. They could do more capex and raise capital from abroad to fund faster growth if there was a growth case to do so. Without extra supplies there cannot be much growth. But without extra demands for potential suppliers of goods services and employment extra output and capacity will not be solicited. Supply creates demand and demand determines supply. They are two blades of the same scissors. They work together to cut the cloth.
Real household spending growth of the order of the less than one per cent p.a. is growth defying. The aim of monetary policy should be to target household spending growth of the order of 3% p.a. with more accommodating interest rate settings to make such growth and growth in bank lending possible. And to see where such faster growth would take supply- including supplies of foreign capital to help fund growth and support the ZAR.
Alas with the oil price shocks the SARB in lock step with other central banks has raised rates. SA households will therefore be growing their spending at a still slower rate in the months to come – under a supply side shock- fuel price plus higher interest rate pressure. Faster growth will again have to wait for lower inflation and interest rates. The SARB is not about to change its approach out of sensitivity to the state of the SA economy. It will be inflation led- whatever the cause of higher prices.
Fig.8; SA Real Household Consumption Spending (2015=100)