Can technology rescue the banks from the regulators?

Mervyn King (not the famous South African one) – now Baron Mervyn King of Lothbury – was once a highly influential Professor at the London School of Economics and then the Governor of the Bank of England until 2013, during which time he helped guide the UK successfully through the financial crisis.

(More recently, he resigned from the Board of the Aston Villa Football Club, the team that finished last in the English Premier League this season. Since past performance is no guide to future performance (in football and in financial markets) this surely will be forgiven.)

King has written a book “The End of Alchemy” to express his disquiet with the post financial crisis banking system and how it is being regulated1. To quote King: “The strange thing is that after arguably the biggest financial crisis in history nothing much has really changed in terms either of the fundamental structure of banking or the reliance on central banks to restore macroeconomic prosperity.”

The fundamental problem, King argues, is in the nature of the incentives banks have in taking risks with other people’s money. When the risk taking works out, the bank shareholders and managers get the rewards, while society has to bear the fall out when the risks turn out to have been very poorly managed. But is this heads I win – tails you lose asymmetrical risk-reward nexus that different for banks when compared to all other large listed companies?

The rewards for managers and shareholders in any company who take on sometimes highly leveraged risks of failure and then succeed (against the odds) can be enormous. The losses caused by the failure of a large public company can also be very serious for the economy at large – other suppliers or customers. They may well be sucked into bankruptcy should the firm suddenly have to close its doors and workers and managers will have to seek alternative employment. The larger the company or bank, the larger these potentially damaging knock-on effects. But if a company or bank is growing for good economic reasons, it would be poor policy to prevent this growth in efficiency for fear of subsequent failure.

The direct financial losses of business or bank failure will be typically borne by shareholders, whose stake in the winning or losing enterprise will be a small part of a low risk, well-diversified portfolio. These lower risks means less expensive capital for the risk taking firm and so more incentive to take on risk. Yet without limited liability for losses, very little risk taking would ever be undertaken. Society has every good reason to encourage risk taking by banks and others – it is the source of all economic progress – and to provide limited liability for capital providers.

Yet the long and mostly successful history of banks and other limited liability companies is that the price of success – the willingness to accept and deal with business and banking failure – has been well worth taking. The focus of policy should perhaps be on how to improve the defence against actual failure, rather than interfering with the freedom of banks to usefully put capital at risk, in the hope that this will prevent a crisis, by introducing better bankruptcy laws that can act much faster to get a business back on its feet and convert debt into equity to the purpose. This will provide debt holders – especially less well diversified lenders – with every incentive to monitor risk management by a bank or business and to introduce debt covenants to such purpose. Ordinary shareholders, even well diversified ones, will greatly appreciate such surveillance, making a mix of debt and equity finance a desirable one.

A business may well be worth rescuing if the reason for failure is too much debt rather than a poor operating performance. Furthermore, a reliance on central banks to restore macroeconomic stability when threatened by a financial crisis, that can be impossible to predict or avoid, is an essential and appropriate part of these defence mechanisms. The history of central banking is the history of how central banks, beginning with the once privately owned Bank of England (nationalised only in 1947) coped with financial crises.

Banks are however responsible for the management of the economy’s payments system. The payments system, hence the banks, cannot be allowed to fail; not even temporarily. The consequences would be too ghastly too contemplate, as they are being forced to contemplate in Zimbabwe as we write.

The interest spread between what a bank offers for deposits and receives for loans has helped to subsidise the cost to the banks of running the payments system. The customers of banks do not typically pay transaction fees to cover the full costs of the payments system they utilise. Hence the attractions of cheap funding for the banks in the form of very low interest transaction accounts and attractions for their customers in the form of low cost transactions that make up for low interest rates received. A comparison of bank charges with charges made by vendors using credit card systems or with the percent of the value of a transaction charged by the money changers and transmitters, makes the point. I am told that for every R100 transferred for example to Malawi through the banking system, the receiver will receive R90 at best. How much of the 9% charge goes to the banks, to the money change agents and the government, I do not know.

The business case for bundling bank borrowing, lending, trading and making payments may however be breaking down. Blockchain computing is being used to safely and cheaply move valuable Bitcoins around the world. The technology could extend to transactions effected by specialist electronic money-changers, charging low fees that still cover low costs. Pure transaction accounts could be made fully and always backed by reserves of central bank deposits or notes in the till or ATMs, rather than covered by deposits or reserves held with other more vulnerable banks. If transactional banking can be legally and economically separated from risk taking banking, the all-important payments system can be insulated from the danger of banking failure. Banks, as with other firms, can then be left to manage their own risks. This may well be the way to rescue banks – or rather their risk-absorbing shareholders and debt holders – from the profit-destroying and cost-raising burdens imposed by risk-avoiding regulators.

1These observations were stimulated by an article by Michael Lewis: On The End of Alchemy – A Central Bankers Memoir (Mervyn King Of The BOE), Actually Worth Reading, Bloomberg Business, 6 May 2016


A revolutionary proposal to transform the prospects of the SA economy – eliminate company tax

There seems little hope of permanently raising GDP growth rates. Persistently slow growth in SA threatens fiscal sustainability. It also threatens social stability. It prolongs the agony of widespread poverty. Something radical is called for to stimulate growth – and by radical I do not mean potentially disastrous expropriation of wealth or the introduction of a National Minimum Wage that, even if it relieves the poverty of those who manage to keep their jobs, will leave many more out of work and even more dependent on informal (illegal) employment and welfare provided by taxpayers.

The radical proposal to transform the prospects of the SA economy is to completely eliminate corporate income tax and replace it with a mixture of additional payroll and wealth taxes. Zero rating company earnings would provide a large boost for saving, capital expenditure, employment and the GDP growth rate. The sums involved are not trivial: corporate income tax yields about R200bn per annum or close to 20% of all government revenues.

The significant amount of tax saved adds to the case for eliminating the tax. Companies would save and invest in plant machinery and people much of the extra R200bn they would save in taxes. It would be a boost to the competitiveness of SA companies and could lead to lower prices. It would attract foreign capital because required returns – after taxes – directly investing in SA based enterprises, would be much reduced. It would make SA a haven for the establishment of head offices. Taxable income from global companies newly established in SA would be transferred in rather than out – as was a major concern of Davis Tax Committee.

Zero taxes for companies would eliminate all the distortions created when companies are taxed additionally and separately from their owners. Taxes on all income distributed by companies would be taxed at the income tax rates that apply to their owners, as is the case with any partnership. All the shareholders in SA companies would become what is known in the US as Master Limited Partners, enjoying the advantages of limited liability for debts but taxed as individuals or institutions at the same tax rates.

Dividends would be taxed as would rental or interest income when received, at the same rate applied to all income. There would be no double taxation of company income and dividends as there would be no relief for interest or any other expense incurred by the company. There would be no deduction for depreciation or amortisation. How much to allow as a deduction from earnings would be company business alone, as would be the decision to retain or pay out cash, with due regard for economic depreciation and the economic income of the company.

The company could be required to collect a withholding tax on all dividends and interest or rent paid out by a company to its capital providers at say a 25% rate, to secure a consistent predictable flow of revenue to the SA Revenue Service (SARS). Owners would credit such payments in their tax returns. Pension and retirement funds as agents of owners and capital providers should be made subject to the same withholding tax. Individuals and their retirement plans, including all their collective investment schemes, would be dealt with in exactly the same way when taxed on income received, including taxes on realised capital gains that should be treated as income.

This would eliminate the major distortion caused by taxing individual savings plans at a much higher rate than that of the collective investment schemes. Personal income tax incentives to contribute to savings plans would not be prejudiced by zero company tax nor would direct subsidies to companies. Yet subsidies are much more transparent to the taxpayer than income tax concessions – a further advantage of zero company tax.

There is in fact no good economic reason to tax the income of companies separately from the income of their owners. Taxing companies probably happened originally because it was administratively very easy to do so. That a tax is convenient to collect, rather than is easy to impose the collection duties on a company collecting tax on behalf of SARS, does not make for a good tax – one that treats all taxpayers equally – and does as little harm to the workings of the economy as is possible.

Dividends and the tax collected on dividends is very likely to increase significantly as company earnings rose – especially if dividends and interest and rent paid to pension and retirement funds were to be included in the tax net as they should be – taxed at say a 25% rate.

A social security tax at a low starting rate could help make up for the losses of company income tax. As indicated in the Budget Review, total payrolls in SA are of the order of R2 300 billion. 5% of this is over R120bn. In the first instance this is paid by employers, but in the long run the payroll tax likely to be paid, in effect, by employees as a wage or salary sacrifice. South African assets in the form of homes, pension funds shares etc. are of the order of R10 000 bllion. Assets in the form of homes are already taxed at market value by municipalities. Wealth in the form of shares in businesses and pension funds etc. could be taxed at the same rate. A 2% wealth tax could bring in as much as the corporate income tax, about R200bn.

With the elimination of company income tax, wealth in the form of shares in businesses, incorporated and not incorporated, would get an immediate boost, an extra inflation-protected R200bn a year in extra earnings – capitalised at a more friendly rate of say 4% – because of the business friendly tax reforms. The R200bn permanently saved by business owners in taxes might be worth 25 times R200bn or more than R5 000 billion to its owners. In other words, more than enough to compensate pension funds and their like for higher taxes on their income.

A wealth tax would also have a popular redistribution flavour to it. But a combination of a wealth tax and an elimination of company taxes would do more than redistribute wealth. It would help create wealth and income and transform the prospects of the SA economy.


*The views expressed in this column are those of the author and may not necessarily represent those of Investec Wealth & Investment

Point of View: A question of (investment) trusts

Understanding investment trusts and how they can add value for shareholders regardless of any apparent discount to NAV.

Remgro, through its various iterations, has proved to be one of the JSE’s great success stories. It has consistently provided its shareholders with market beating returns. Still family controlled, it has evolved from a tobacco company into a diversified conglomerate, an investment trust, controlling subsidiary companies in finance, industry and at times mining, some stock exchange listed, others unlisted. Restructuring and unbundling, including that of its interests in Richemont, have accompanied this path of impressive value creation for patient shareholders.

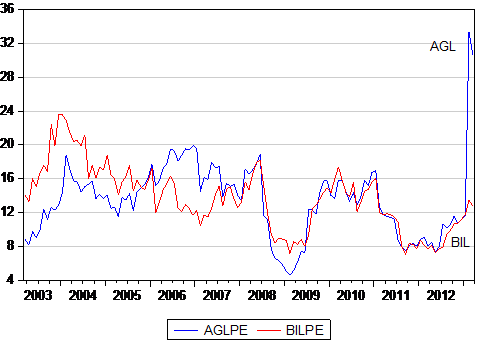
The most important recent unbundling exercise undertaken by Remgro was in 2008 when its shares in British American Tobacco (BTI), acquired earlier in exchange for its SA tobacco operations, were partly unbundled to its shareholders, accompanied by a secondary listing for BTI on the JSE. A further part of the Remgro shareholding in BTI was exchanged for shares in another JSE-listed counter and investment trust, Reinet, also under the same family control, with the intention to utilise its holding of BTI shares as currency for another diversified portfolio, with a focus on offshore opportunities. Since the BTI unbundling of 2008, Remgro has provided its shareholders with an average annual return (dividends plus capital appreciation, calculated each month) of 23%. This is well ahead of the returns provided by the JSE All Share Index, which averaged 17% p.a over the same period. Yet all the while these excellent and market beating returns were being generated, the Remgro shares are calculated to have traded at less than the value of its sum of parts, that is to say, it consistently traded at a discount to its net asset value (NAV).

The implication of this discount to NAV is that at any point in time the Remgro management could have added immediate value for its shareholders by realising its higher NAV through disposal or unbundling of its holdings. In other words, the company at any point in time would have been worth more to its shareholders broken up than maintained as a continuing operation.


pic1

How then is it possible to reconcile the fact that a share that consistently outperforms the market should be so consistently undervalued by the market? It should be appreciated that any business, including a listed holding company such as Remgro, is much more than the estimated value of its parts at any moment in time. That is to say a company is more than the value of what may be called its existing business, unless it is in the process of being unwound or liquidated. It is an ongoing enterprise with a presumably long life to come. Future business activity and decisions taken will be expected to add to the value of its current activities. For a business that invests in other businesses, value can be expected to be added or lost by decisions to invest more or less in other businesses, as well as more or less in the subsidiary companies in which the trust has an established controlling interest. The more value added to be expected from upcoming investment decisions, the higher will be the value of the holding company for any given base of listed and unlisted assets (marked to market) and the net debt that make up the calculated NAV.

Supporting this assertion is the observation that not all investment trusts sell at a discount to NAV. Some, for example the shares in Berkshire Hathaway run by the famed Warren Buffet, consistently trade at a value that exceeds its sum of parts. Brait and Rockcastle, listed on the JSE, which invest in other listed and unlisted businesses, are currently valued at a significant premium to their sum of parts. Brait currently is worth at least 45% more than its own estimate of NAV while Rockcastle, a property owning holding company offers a premium over NAV of about 70%. PSG, another investment holding company, has mostly traded at a consistently small discount to NAV but is now valued almost exactly in line with its estimated NAV.

It would appear that the market expects relatively more value add to come from the investment decisions to be made by a Brait or Rockcastle or PSG, than it does from Remgro. The current value of the shares of these holding companies has risen absolutely and relatively to NAV to reflect the market’s expectation of the high internal rate of returns expected to be realised in the future as their investment programmes are unveiled. Higher (lower) expected internal rates of return are converted through share price moves into normal risk adjusted returns. The expected outperforming businesses become relatively more expensive in the share market – perhaps thereby commanding a premium over NAV – while the expected underperformers trade at a lower share price to provide the expected normal returns, so revealing a discount to NAV.

The NAV of a holding company however is merely an estimate, subject perhaps to significant measurement errors, especially when a significant proportion of the NAV is made up of unlisted assets. Any persistent discount to NAV of the Remgro kind may reflect in part an overestimate of the value of its unlisted subsidiaries included in NAV. The NAV of a holding company is defined as the sum of the market value of its listed assets, which are known with certainty, plus the estimated market value of its unlisted assets, the values of which can only be inferred with much less certainty. The more unlisted relative to listed assets held by the holding company, the less confidence can be attached to any estimates of NAV.

The share market value of the holding company will surely be influenced by the same variables, the market value of listed assets and the estimates of the value of unlisted assets minus net debt. But there will be other additional forces influencing the market value of the holding company that will not typically be included in the calculation of NAV. As mentioned, the highly uncertain value of its future business activities will influence its current share price. These growth plans may well involve raising additional debt or equity, so adding to or reducing the value of the holding company shares, both absolutely and relative to the current explicit NAV that includes only current net debt. Other forces that could add to or reduce the value of the holding company and so influence the discount or premium, not included in NAV, are any fees paid by subsidiary companies to the head office, in excess of the costs of delivering such services to them. They would detract from the value of the holding company when the subsidiary companies are being subsidised by head office. When fees are paid by the holding company to an independent and controlling management company, this would detract from its value from shareholders, as would any guarantees provided by the holding company to the creditors of a subsidiary company. The market value of the subsidiaries would rise, given such arrangements and that of the holding company fall, so adding to any revealed discount to NAV.

It should be appreciated that in the calculation of NAV, the value of the listed assets will move continuously with their market values, as will the share price of the holding company likely to rise or fall in the same direction as that of the listed subsidiaries when they count for a large share of all assets. But not all the components of NAV will vary continuously. The net debt will be fixed for a period of time, as might the directors’ valuations of the unlisted subsidiaries. Thus the calculated NAV will tend to lag behind the market as it moves generally higher or lower and the discount or premium to NAV will then decline or fall automatically in line with market related moves that have little to do with company specifics or the actions of management. In other words, the market moves and the discount or premium automatically follows.

If this updated discount or premium can be shown to revert over time to some predictable average (which may not be the case) then it may be useful to time entry into or out of the shares of the holding company. But the direction of causation is surely from the value attached to the holding company to the discount or premium – rather than the other way round. The task for management is to influence the value of the holding company not the discount or premium.

Yet any improved prospect of a partial liquidation of holding company assets, say through an unbundling, will add to the market value of the holding company and reduce the discount. After an unbundling the market value of the holding company will decline simultaneously and then, depending on the future prospects and expectations of holding company actions, including future unbundling decisions, a discount or premium to NAV may emerge. The performance of Remgro prior to and after the BTI unbundling conformed very well to this pattern. An improvement in the value of the holding company shares and a reduction in the discount to NAV on announcement of an unbundling – a sharp reduction in the value of the holding company after the unbundling and the resumption of a large discount when the reduced Remgro emerged. See figure 1 above.

The purpose of any closed end investment trust should be the same as that of any business and that is to add value for its shareholders by generating returns in excess of its risk adjusted cost of capital. That is to say, by providing returns that exceed required returns, for similarly risky assets. Risks are reduced for shareholders through diversification as the investment trust may do. But shareholders can hold a well diversified portfolio of listed assets without assistance from the managers of an investment trust. The special benefits an investment trust can therefore hope to offer its shareholders is through identifying and nurturing smaller companies, listed and unlisted, that through the involvement of the holding company become much more valuable companies. When the nurturing process is judged to be over and the listed subsidiary is fully capable of standing on its own feet, a revealed willingness to unbundle or dispose of such interest would add value to any successful holding company.

This means the holding company or trust will actively manage a somewhat concentrated portfolio, much more concentrated than that of the average unit trust. Such opportunities to concentrate the portfolio and stay active and involved with the management of subsidiary companies may only become available with the permanent capital provided to a closed end investment trust. The successful holding company may best be regarded and behave as a listed private equity fund. True value adding active investment programmes require patience and the ability to stay invested in and involved in a subsidiary company for the long run. Unit trusts or exchange traded funds do not lend themselves to active investment or a long run buy and hold and actively managed strategy of the kind recommended by Warren Buffett. A focus on discounts to estimates of NAV, to make the case for the liquidation of the company for a short term gain, rather than a focus on the hopefully rising value of the shares in the holding company over the long term, may well confuse the investment and business case for the holding company, as it would for any private equity fund. The success of Remgro over the long run helps make the case for investment trusts as an investment vehicle. So too for Brait and PSG, which are perhaps best understood as listed private equity and highly suited to be part of a portfolio for the long run.


Appendix


A little light algebra and calculus can help clarify the issues and identify the forces driving a discount or premium to NAV


Let us therefore define the discount as follows, treating the discount as a positive number and percentage. Any premium should MV>NAV would show up as a negative number.


Disc % = (NAV-MV)/NAV ………………………………………..           1

Where NAV is Net Asset Value (sum of parts), MV is market value of listed holding company

NAV = ML+MU-NDt …………………………………………….       (2)


Where NAV is defined as the sum of the maket value of the listed assets held by the holding company. MU is the assumed market value of the unlisted assets(shares in subsidiary companies) held by the holding company and NDt is the net debt held on the books of the holding company – that is debt less cash.

Note to valuation of unlisted subsidiaries MU;

MU may be based on an estimate of the directors or as inferred by an analyst using some valuation method- perhaps by multiplying forecast earnings by a multiple taken from some like listed company with a similar risk profile to the unlisted subsidiary. Clearly this estimate is subject to much more uncertainty than the ML that will be known with complete certainty at any point in time. Thus the greater the proportion of MU on the balance sheet the less confidence can be placed on any estimate of NAV.

The market value of the holding company may be regarded as


MV=ML+MU-NDt+HO+NPV………………………………………………..(3)

That is to say all the forces acting on NAV, plus the assumed value of head office fees and subsidies (HO)activity and of likely much greater importance the assessment markets of the net present value of additional investment and capital raising activity NPV. NPV or HO may be adding to or subtracting from the market value of the holding company MV.

A further force influencing the market value of the holding company would be any liability for capital gains taxes on any realisation of assets. Unbundling would no presumably attract any capital gains for the holding company. These tax considerations are not taken up here

IF we substitute equations 2 and 3 into equation one the forces common to 2 and 3 ML,MU,NDt cancel out and we can conveniently write the Discount as the ratio


Disc= – (H0+NPV)/(ML+MU-NDt ) ………………………………………..(4)


Clearly any change that reduces the numerator (top line) or increases the denominator (bottom line) of this ratio will reduce the discount. Thus an increase in the value attached to the Head Office or the value of future business will reduce the discount. ( These forces are preceded by a negative sign in the ratio) A large increase in the value attached to investment activity will also reduce the discount and might even turn the ratio into a negative value, that is a premium. Clearly should the market value of listed or unlisted assets rise or Net Debt decline (become less negative) the denominator would attain a larger absolute number, so reducing the discount. The implication of this ratio seems very obvious. If the management of a holding company wishes to add value for shareholders in ways that will reduce any discount to NAV or realise a premium then they would need to convince the market of their ability to find and execute more value adding positive NPV projects. Turning unlisted assets into more valuable listed assets would clearly serve this purpose


Some calculus might also help to illuminate the forces at work. Differentiating the expression would indicate clearly that the discount declines for increases in H0 or NPV


That is dDisc/dNPV or dDisc/dHO= -1/(ML+MU-NDt)

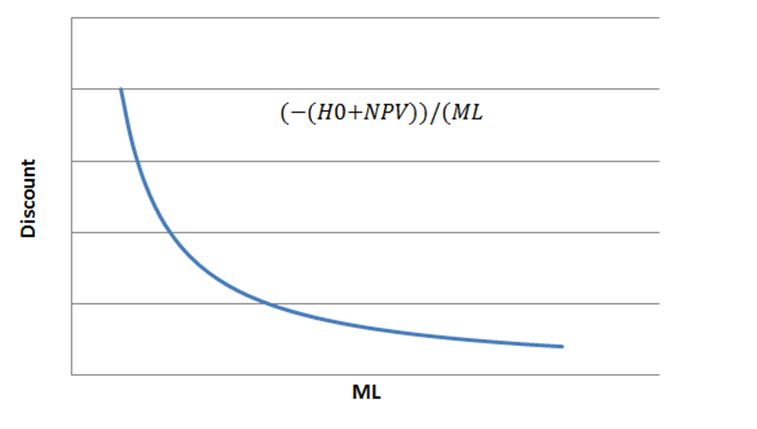
This result indicates that the larger the absolute size of the holding company the more difficult it will become to move the discount through changes in the business model


Differentiating for small changes in the variables in the denominator is a more complicated procedure but would yield the following result for dML or dMU or dDNt


For example dDisc/DML= -(H0+NPV)/(ML+MU-NDt)^2


Again it may be shown that the impact of any change in ML,MU or NDt will be influenced by the existing scale of the listed assets held ML. The larger the absolute size of ML the less sensitive the discount will be to any increase in ML. The same sensitivities would apply to changes in MU or NDT. This reaction function is illustrated below
 

pic12png

Acsa could put Eskom on the right path

This piece was published in the Business Day on 22 September 2014:

THE Treasury’s package of measures for dealing with Eskom is like the curate’s egg — it is good in parts. The Treasury has devised a package of measures to sustain Eskom. Some will be welcomed, others not. Unfortunately, the government, sole shareholder of this failing corporation, is not willing to recapitalise Eskom fully so it can complete its build programme without further harm to hard-pressed electricity users. Continue reading Acsa could put Eskom on the right path

National Treasury and Eskom: The curate’s egg

National Treasury’s package of measures for dealing with Eskom is another case of the curate’s egg – it is only good in parts.

The Treasury has come up with a package of measures to sustain Eskom. Some of these measures will be welcome, others less so. Unfortunately the government, the sole shareholder of this failing corporation, is not willing to fully recapitalise Eskom so that it can complete its current programme without further damage to the hardpressed users of electricity – firms and households. Continue reading National Treasury and Eskom: The curate’s egg

Remuneration of senior executives: Where angels should fear to tread

Those shareholders in Sun International (SUI) who voted against its pay policy on 22 November (49.89% of shareholders, while 5.05% abstained) probably did not do themselves any favours, at least in the short term. Since then the share price has fallen from R101 to R95.6 by midday yesterday (2 December).

The market value of the company has fallen accordingly, from R11.53bn on 22 November to the current R10.91bn, a loss of R617m – a whole lot more than the extra they might have paid senior executives.


Clearly the vote on pay could not easily be said to have helped shareholders. However it is impossible to say how much it cost them with certainty. There may well have been other forces at work driving the share price lower, forces common to all the JSE listed companies – or hotel and casino companies in particular.

Ideally we would isolate these market effects from the impact of events specific to Sun International itself. Unfortunately the relationship between the share price and that of the market itself is a very weak one. The relationship between the share price and that of its rival Tsogo Sun (TSH) is also too weak to enable us to isolate market-wide effects on the share price with any degree of confidence.

Perhaps coincidentally, the Tsogo Sun share price and market value have also been subject to downward pressure recently, though less so than Sun International.

Nothing can be more important for shareholders than the quality of top management and the incentives that encourage their efforts on behalf of shareholders. The essence of good corporate governance is for the directors to appoint the best possible chief executive, at a market related package, and to design the right package for him or her that is related to the internal return on capital realised by the company. The board should to be able to manage the market place for top management well.

This market, like the market for capital and the goods and services companies deliver, is itself a competitive global market. Another responsibility of any board of directors is to make sure that the remuneration policies, including the mix of contractual and performance based rewards, for all employees, is well designed for shareholders. Impressing the soundness of such policies on shareholders is part of the role to be played by the CEO and the board.

Second guessing these essentially complex policies at annual meetings of the company is unlikely to add shareholder value. Nor are interventions in remuneration packages by governments and their regulators likely to be helpful to shareholders. Such interference is very likely to be driven by envy about income differences, rather than objective measures of performance that play well in the political arena and usually receive encouragement in the media.

The man or woman in the street usually finds it a lot easier to understand the extraordinary rewards of the superstars of sport and entertainment that fill the arenas. The role played by the superstars of business in generating revenue and profit is clearly not so well appreciated.

The true quality of remuneration policies of a company (as of its management generally) will be measured by the share market – not so much by absolute share market performance (which is often beyond the control of the company), but by the relative performance of one company compared to its close competitors.

Such comparisons will be determined by sustained differences in the internal rates of return on investing shareholders capital. It is to these differences that management should be held accountable for at annual general meetings and to which remuneration policies should be directed. Votes about how much the CEO has earned, or will earn, may serve only as a distraction.

Expectations of Platinum Mining in South Africa – Anchored in the False Bay

As printed in Business Day 14 May 2013 

by David Holland and Brian Kantor[1]

Behavioral studies have shown that humans exhibit a strong anchoring tendency.   When the world changes, they remain anchored to the one they know instead of adapting to the new order. Evidence for this behavior is ubiquitous when parsing through government and labour comments about the ability of mining companies to pay more or hire increased numbers of workers. This is undoubtedly a reason for delay and lack of resolution in discussions between government, organized labour and Anglo American Platinum about the company’s need to reduce costs and investment.

We would like to take a step back and assess how profitable platinum miners are, and calculate the expectations embedded in their market prices. Once we understand those expectations, we can focus on the best way forward for the business and its stakeholders.

The platinum industry has been one of great hope and now disillusionment. We aggregated the historical financial statements of the 5 largest South African platinum miners (Anglo American Platinum, Impala, Lonmin, Northam and Royal Bafokeng) and calculated the inflation-adjusted cash flow return on operating assets, CFROI, which is the real return on capital for the industry. From 1992 to 1997, platinum miners were generating an unattractive return on capital, which slumbered below the cost of capital. The years 1999 to 2002 provided the first wave of extraordinary fortune for platinum miners. The real return on capital exceeded 20%, making it one of the most profitable industries in the world at that time (the average CFROI for global industrial and service companies is 6%). The rush to mine platinum and build company strategies around this effort was on, e.g., Lonmin bet its future on platinum.

The 2nd wave of fortune occurred during the global commodities “super cycle” from 2006 to 2008. Again, platinum mining became one of the most profitable businesses in the world. The good times ended abruptly with the onset of the Great Recession in 2009, and platinum miners saw their real return on capital drop to 1% – well below the cost of capital, i.e., the return required to justify committing further capital to the industry.

Unfortunately, operating returns have not improved much and have remained below the cost of capital throughout the global slowdown due to increasing labour, electricity and excavation costs, and lower platinum prices.  By cost of capital, we mean the minimum return required of an investment in an industry with proper regard to the risks involved in its operations and financial constraints. The greater the risks, the greater the return required to sustain or expand the industry. Firms or sectors of the economy that prove unable to satisfy their cost of capital decline while firms that beat their cost of capital are strongly encouraged by shareholders and other capital providers to expand and to raise the finances necessary to do so.

The 2012 CFROI in the platinum sector of the SA economy was a miserable minus 0.6%, which is the lowest return on capital since 1992 when our calculations on realized returns in the sector begin. Suffice to say, platinum miners aren’t producing sufficient returns to satisfy shareholders or the market place to support their operations. This has resulted in unavoidable cost-cutting, lay-offs and deep cuts to capital expenditure plans. These are natural economic consequences when a business is destroying economic value by not meeting its cost of capital.

And what does the future hold?  We’ve taken analyst expectations for 2013 and 2014 and estimated the real return on capital.  It remains very poor at a value destructive level of 0% for 2013 and a depressed 3.4% until 2017.  There is no hint of a return to superior profitability in the share prices of platinum miners. The market has them valued to continue to realize a real return on capital of less than 6%, which is the average real return on capital for industrial and service firms throughout the world. As an aside, despite high gold prices, profitability for SA gold miners is no better. Their aggregate CFROI is expected to remain around a value destructive 3% for the next 5 years.

In a nutshell, South African platinum and gold miners are destroying value and are expected to continue to do so. They are in a dire economic state. To survive they have to reduce costs. Demands for wage increases that far exceed inflation are now totally unrealistic and cannot be fulfilled. These demands are anchored to a past that no longer exists. The tragedy is that for the workers who are bound to lose their jobs mining platinum, there are no forms of alternative employment that will provide them with anything like the same rewards.

All parties should focus on what is realistically possible and economically feasible. A wage freeze, reduced hours or some form of deferred pay are called for to minimize the pain. The workers and the unions already subject to retrenchment and very poor job prospects would surely be wise to focus on job retention rather than further gains in real employment benefits for those still fortunate enough to retain their jobs. Any improved employment benefits that may be extracted will go to even fewer surviving workers. There is however another way that makes much more economic sense for all stakeholders not least the government and SARS that shares fully in profits and also wages earned. Cooperation – yes, call it co-option if you like – is urgently called for.

In normal economic circumstances it is sensible for employees of a failing firm not to sacrifice current benefits to keep their employers going. Ordinarily, they can expect to find equally well-paid work with another firm in an industry willing and able to employ them. After all, skilled or even less skilled but experienced workers are a valuable scarce resource in a well functioning economy that sustains close to full employment conditions. Unfortunately, this does not describe the SA labour market with its relatively few insiders employed formally and the many others, particularly young potential workers so anxious to join them but unable to do so.

Moreover most workers prefer fixed predictable rewards to variable income. The risks of variable incomes are borne by shareholders and to a degree, managers with bonuses linked to the company’s operating performance. If a failing firm is unable to offer market related benefits to its employees or indeed its owners, then it deserves to fail and the scarce resources it was employing and in effect wasting could be transferred to other firms capable of employing resources more productively.

In the case of platinum and gold miners in South Africa, the prospect of alternative employment with anything like the same benefits is very bleak. Workers would be well advised to settle for less especially now and hope to make it up at a later stage should the prospects of the industry and its productivity improve. Deferred pay offers an inventive compromise where current pay sacrificed is exchanged for shares or even options on shares to be realized at some point in the future. It would then be in all parties’ best interest for productivity and return on capital to improve. If these cost savings were made or even expected to be realized, the shares the workers owned in the industry, exchanged for lower take home pay, would appreciate significantly. Sacrifices made now to hold on to jobs could be more than made up in the share market. And more valuable platinum and mining companies would be able to much more easily fund growth in output and employment rather than manage as best they can declining output and employment.

Unless the industry can come to deliver a cost of capital beating return, its value to all stakeholders will surely decline further and its prospects deteriorate. Perhaps even to the point where nationalizing the industry with full compensation might seem a realistic proposition. It may cost relatively little to take over a failed industry. Nationalization however will not solve the problem of poor labour relations and the decline in the productivity of both labour and capital in the industry. It would simply mean that taxpayers, rather than shareholders who will have lost so much, carry the can for the failures of management and unions that must share the blame. The government and its agencies have many alternative and much better uses for tax revenues than to subsidise the already well-paid workers in a difficult, capital-intensive industry that is likely to realize poor returns.

The unions might think correctly that management subject to the discipline of taxpayers rather than shareholders would be a softer touch. Government and its taxpayers should be very wary of signing a blank cheque. All parties need to focus on what is realistically possible and economically feasible. By taking stock of the poor economic performance of the platinum mining industry and its depressed expectations, all parties can negotiate from a shared set of financial and economic facts. These are difficult times and creative approaches are needed. All parties need to be anchored in the right bay signaled by today’s reality and expectations.


[1] David Holland is an independent consultant and senior advisor to Credit Suisse. Brian Kantor is Chief Strategist and Economist with Investec Wealth and Investment.


Anglo’s parting chief: How not to say goodbye

Published by Business Day, Friday April 19th 2013. Opinion and Analysis Section, p11

Taking leave of her long suffering shareholders, Cynthia Carroll chose to admonish rather than commiserate with them.  As the Financial Times reported:

In a parting shot at shareholder demands for greater cash returns, Cynthia Carroll told the FT that there was a “disconnect” between mining companies and investors, adding that the latter need to understand better “what it really takes to deliver projects”.

“Some [shareholders are] under severe pressure and want a return tomorrow.  They’re going to be hard-pressed to get them because it’s not going to happen that way.  We have to be ruthless in terms of what [costs] we’ve got to cut but we have to be mindful we’re in a long-term industry.”[1]

 The truth about the recent behaviour of investors in Anglo is that far from any alleged short term disconnect between price and performance, as alleged, Anglo shareholders  are demonstrating remarkable patience in the face of a simply disastrous performance of the company in recent years that has seen Anglo’s earnings collapse. Blaming the global slowdown and super cycle bust ring hollow when judged by Anglo’s poor performance relative to that of its large diversified mining house peers. BHP Billiton, Rio Tinto and Anglo American are all listed on the FTSE in London. Since 2007 when Ms Carroll became CEO, BHP Billiton has beaten the FTSE by a factor of 1.95; Rio Tinto has beaten it by 1.31 and Anglo has returned only 0.61 relative to every £1 invested in the FTSE. This is a sad case of sterling underperformance.

The price to earnings multiple for Anglo has shot up lately in response to a collapse in reported earnings after taxes and write offs. Thus indicating very clearly that shareholders are hopeful that earnings will recover in due course. Let us hope that their confidence in the newly appointed Anglo management to affect a recovery in the mining house operations will be justified. Far from being short cited in the face of very poor recent results investors are proving remarkably loyal to Anglo.

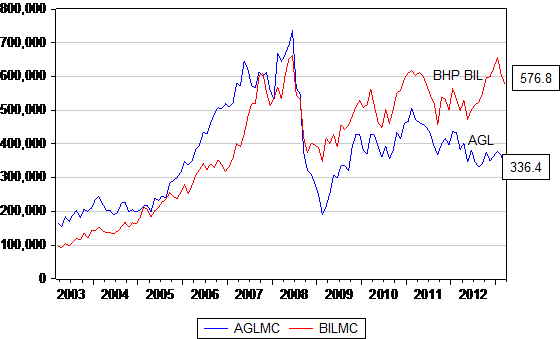
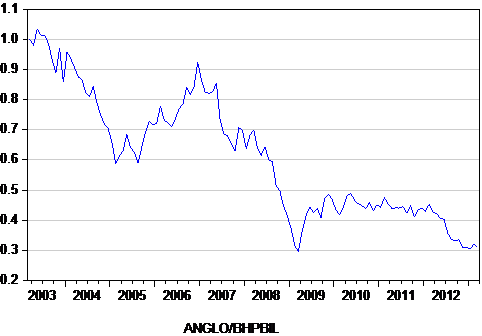
The sad news about Anglo’s (AGL) performance under Ms Carroll’s watch is easily captured in a few more diagrams.  We show that while AGL was once worth more than BHP Billiton (BIL), its market value is now considerably lower. From a peak market value of over R700b in 2007 before the Global Financial Crisis struck, the company was worth less than half R336.4b by March 2013. As we show BIL held up much better over the period and is now worth significantly more than AGL (approximately R230b more at the March 2013 month end). Compared to early 2003 before the commodity super cycle shareholders would have done about three times better holding BIL than AGL shares.

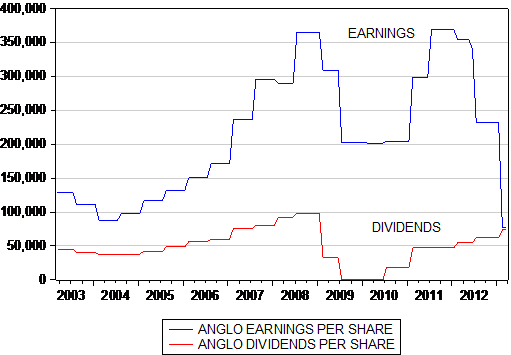
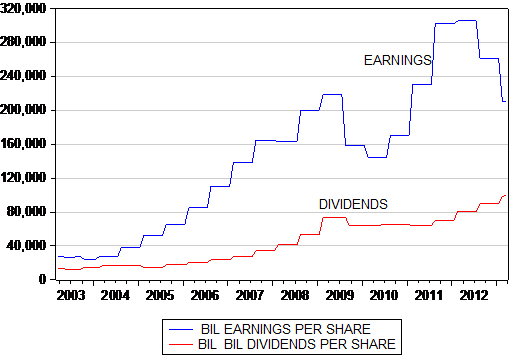
Such relative performance is well explained by earnings and dividends per share. Anglo’s after tax earnings per share having collapsed in the past financial year to December 2012 is now below its level of early 2003. BIL earnings per share, while also under strong downward pressure, grew much faster over the ten year period and are well above 2003 levels as we show.  The upshot of all this history is that AGL was selling at the March 2013  month end for a highly generous and forgiving multiple of over 30 times its reported earnings while BHP Billiton commands a much more sober multiple of 12.8 times. The average price to reported earnings multiples for both companies over the past ten years has been about 13.5 times. Based on this measure, Anglo is priced for a recovery and normalisation of its earnings.

Anglo American and BHP Billiton Market Value (R’ 000m)


Ratio Market value of Anglo/ BHP Billiton 2003=1


Anglo American Earnings and Dividends per share  (2003- 2013; South African cents )


BHP BILLITON Earnings and Dividends per share (2003- 3013 sa cents)


Anglo American and BHP Billiton Price/Earnings Multiple


While price earnings multiples give an impression of the long term expectations that inform market values, we can take a closer look at the South African mining industry to judge more accurately what the market expects of the mining houses in terms of operating profitability and value creation.

Contrary to Ms Carroll’s statements and those of many other pundits unsympathetic to market forces  investors have long-term expectations about growth, return on capital and risk when they value the anticipated future cash flow from companies.  They take a long term view because it is the value adding viewpoint to adopt. Smart investors and corporate executives back into and analyse market expectations to understand current valuations before they buy or sell shares. If expectations appear too optimistic then the investment shouldn’t be made.  Two much pessimism about the long term provides a buying opportunity.

Using CFROI[2], which is a measure of the real cash flow return on operating assets,  we investigate the return on capital implications implicit in the current values attached to the mining companies listed on the JSE.

The average real return on capital (CFROI) for global industrial and service companies is 6%.  Firms that can generate operating returns that beat this level can generally be said to be creating shareholder value.  Firms that generate real operating returns less than 6% are destroying shareholder value.  South Africa (defined as firms listed on the JSE) has one of the highest median CFROI values in the world at 10%.  This is something to be very proud of.  In general, South African companies are very well managed and create shareholder value. If they can continue to generate returns that beat their cost of capital, they should re-invest their earnings and grow.  It is not a lack of cash that stops companies from investing more in SA mining operations , but rather uncertainty about the risk and economics of future earnings from those investments.  The government should do all it can to welcome investment and decrease uncertainty if it truly wishes to unleash growth.

Unfortunately, the South African mining sector has not generated a particularly attractive return on capital.  The median CFROI for the aggregate South African mining industry is 6.2% over the past 20 years. It has exceeded 9% in only two years, 2001 and 2006.  Many miners did very well during the commodities super cycle from 2006 to 2008 but have generated value destructive operating returns since. Platinum mining has provided a  particularly disappointing return on capital since the super cycle collapsed as has much of the acquisition activity undertaken by the diversified miners.

 SA Miners All Regions All Sectors – Weighted

And so what are the current expectations implied by current market values?  The aggregate CFROI for the South African mining industry implicit in current valuations is expected to remain well below 6%, which is below the real cost of capital or the returns normally demanded of risky mining operations.  Spiralling costs and low commodity prices are squeezing profitability, and this squeeze (undemanding expected returns) is baked into today’s lower share prices.  If we compare forward expectations over the next five years for BIL, Rio Tinto and AGL, BIL is priced for its CFROI to go from 10% to 7%; Rio Tinto from 7% to 5%; and AGL from 5% to a value destructive 2%. Such low expectations indicate that AGL is either cheap or the market has decided it is a value trap. The onus is on management to prove the market wrong by improving operational control, not to blame the market for losing faith in the industry.

The share market doesn’t expect growth from the mining houses. It is rather demanding that the mining houses pay much closer attention to cost control and operational excellence. These low market expectations should act as a warning to managers, workers and the government responsible for mining policy. The lower profits and reduced growth expected is not in synch with demands for higher wages, electricity prices and government interference with mining rights and the taxation of mining profits.  If these low expectations can be countered by sober management and relations, then these companies and their returns stand a stronger chance of recovering their status with investors. In the long run it will be the real return on the cash invested by the mining companies that will be decisive in determining their value to shareholders. In the long run economic fundamentals will trump what may be volatile expectations. The mining companies can manage for the long run with complete confidence in the willingness of the share market to give them time but must bear in mind that actions speak louder than words.

 Brian Kantor and David Holland


[2] Follow this link for more information about CFROI: https://www.credit-suisse.com/investment_banking/holt/en/education/popup_tutorial1.jsp 

Capital and its Cost – a primer for SA shareholders, their managers and regulators

Capitalism is a very good description of our economic system. The modern economy revolves about the competence with which firms use capital entrusted to them. Successful, profitable firms, consistently invest in projects that return more than the cost of the capital they employ. They are strongly encouraged to expand. That is to make more of the economy’s scarce resources – people, natural resources and capital. Firms unable to cover these costs of capital are as strongly encouraged to waste less, that is to yield scarce resources to those firms that are able to put them to better use.

Read the Full Version here or the Short Version here.

Eskom’s MacGuffin: Plotting the future of electricity supply and demand in SA

David Holland and Brian Kantor*

Illusionists know how to divert attention so that they can confuse the audience and practice their magic. Filmmakers are expert at planting “MacGuffins” in plots to distract attention from central developments toward unimportant attention grabbers (Alfred Hitchcock coined the term and was the master of employing them in his mysteries). It is our view that Eskom is using this device in its MYPD 3 pricing application and argument for five years of 16% annual price hikes.

Eskom keeps putting the strength of its balance sheet as the primary purpose of its pricing application. It is in effect front-loading its tariffs, which hurts the country but benefits Eskom’s balance sheet. Eskom’s unrelenting focus on its credit rating is a MacGuffin. The lead player, South Africa’s citizens and economy, would die in this film.

If Eskom gets its way, the wholesale price of electricity will have increased over a 10-year period from an average of 19.9c/kWh to about 120c/kWh. This equates to a compound rate of growth of nearly 18% per annum for 10 years, or an astounding 12% p.a in real terms. No economy can be expected to cope with a shock this large to the price of such a basic service as electricity supply. Aggravating the issue further is that the municipalities have a monopoly (constitutionally protected) to distribute electricity at much higher unregulated prices of their own choosing.

The real threat to the rating

We have argued previously in the press (Business Report, 26 November 2012) and at the National Energy Regulator of South Africa (NERSA) hearing in Cape Town on 16 January 2013 that Eskom’s pricing request is excessive. Its request is not based on sound economic principles and would seriously damage the economy as so many other participants in the public hearings have confirmed.

The higher the price Eskom can charge, the more cash it will generate from operations and the less debt it will have to issue to fund its growth. But this is to confuse the financial and economic decision making process, and translates into grossly overcharging current consumers. Financial structure should be a consequence of a sound business strategy, not its primary objective. Eskom likes to confuse and conflate the investment and the financial decision that should be clearly separated.

Paradoxically, if Eskom gets its way with higher prices and less debt, the economy is likely to grow more slowly and this will damage rather than improve SA’s standing with the credit rating agencies, thus raising the cost of funding RSA and Eskom debt. Eskom thinks otherwise – it likes to believe that less debt will mean a higher credit rating. It should seriously think again. The threat to SA’s credit rating is not its current debt ratios but its economic prospects. Slower growth means less tax revenue, more government spending, larger fiscal deficits and more debt.

An energy czar

We believe the strategy for electricity generation needs to be clarified and agreed at the highest levels of government. An energy czar is desperately needed to help make the essential trade offs for the economy over the short and long run. Such policies would recognise that the very large expansion of generating capacity under way is imperative for the economy. Also to be recognised is that years of under pricing electricity and the failure to plan for a gradual adjustment of prices and capacity has left the country with no alternative but to undertake a very rapid and large expansion of generating capacity.

The failures to plan well for electricity in the past continue to haunt the economy. We need to get over these failures and take sensible decisions for the future. The issue cannot be left for Eskom and NERSA to resolve – it is too important for that.

In March 2008 the total book assets of Eskom amounted to R168bn. By 2018, these assets will climb to R743bn, which is a formidable increase of R575bn (our forecast based on Eskom’s projected capex and growth). Furthermore there is now no practical alternative but to rely on Eskom to manage this growth over the next five years. Today’s burning issue is rather how much of the five-year growth in electricity generating assets should be financed with tariffs and with debt. Well within the five-year window, the energy czar will have to decide on the growth in capacity after 2018 and how it should be financed.

Key questions

Here are key questions and proposals for formulating a clear energy strategy:

1) What growth rate is the country pursuing and how does this translate into capacity requirements for Eskom? Government, which is Eskom’s sole shareholder, must provide clear guidance. Eskom’s task is to meet this strategic objective, i.e. to supply all the electricity that is demanded in SA at a price that makes economic sense. The role of Eskom and other generators as well as other distributors of electricity beyond the next five years will have to be decided as a matter of urgency, but not as urgently as setting the right price for electricity beyond March 2013.

2) What economic return on capital is sensible to meet the country’s needs? If it is too high, industry and employment suffer. If it is too low, subsidisation is required and uneconomic activities promoted. We showed through a benchmarking exercise that a real return on capital of 3% to 4% is sensible and competitive, i.e., “cost reflective”, in Eskom’s terminology for regulated utilities around the globe. Historically, Eskom’s real return on capital was too low, which led to the capacity crisis and extraordinary price increases over the past few years. Eskom has argued that an 8% real return on capital and real cost of capital are appropriate. We showed by comparison with the returns realised by public utilities in other economies and by reference to the lower expected returns on capital invested in much riskier economic activities that this is excessive and uncompetitive. Government needs to set a target for the real return on capital and let NERSA monitor that return and its key financial and operating drivers. The sensible target should be a 3.5% real return on capital, which should also be applicable to new capital investments. Cash Flow Return on Investment (CFROI) is a globally accepted measure of real return on capital, and a metric we like.

3) What is the most economic way of delivering power? This is more technical and involves the usual project economics. Burning coal has high external costs such as environmental pollution and road damage. Game changers include power stations that burn natural and shale gas, which can be built quickly at lower cost and operate more efficiently. The energy and manufacturing renaissance in the US must surely serve as a template and exemplar for government and Eskom. The die has been cast for the present expansion, but a decision needs to be made on the energy sources for the next phase of electricity capacity building beyond 2018. The importance of saving energy via awareness and innovative technology should continue to be promoted, although not necessarily by Eskom.

4) What financing and capital structure is required to fulfill this strategy? Operating cash flow is stable for power companies, which lessens risk and allows them to operate with high levels of debt and leverage. The cost of debt can be managed by government guaranteeing Eskom’s debt (as the Treasury has agreed to do) or by the RSA raising debt on Eskom’s behalf and investing the proceeds of such debt issues as equity in Eskom.

More debt vs higher charges

The choice for the economy is simple: it is either more debt, or much higher charges that damage the economy. In Eskom’s MYPD 3 five year proposals, debt would grow to R338bn (relative to book assets of R743bn and the government’s guarantee of R350bn). We estimate that if price increases were limited to 10% per annum and cash costs were reduced by 5%, Eskom would have a competitive real return on capital and debt peak of about R450bn. Surely this is an unavoidable demand on the borrowing capacity of the RSA or its wholly owned subsidiary Eskom. Government cannot abdicate this responsibility if it is to fulfill its obligation to the wider economy. And the rating agencies should be made to appreciate, as surely they will, that to raise debt to fund essential infrastructure that improves the growth potential of the economy rather than to undermine it, makes economic sense and justifies a better, rather than worse, credit rating

Another issue to consider when setting the target real return on capital invested by Eskom is whether to allow non-productive construction-in-progress as part of the return on capital and tariff calculation. We believe it should be excluded from the economic return calculation because it encourages uneconomic behaviour.

Granting Eskom the right to charge tariffs on construction-in-progress encourages it to build expensive capacity and to keep building. If Eskom is able to charge tariffs on construction-in-progress, it has no incentive to control expansion costs nor to deliver new capacity on time. These are headline issues that perpetually dog the current expansion.

Opaque subsidies

We are also concerned about the opaque practice of having Eskom subsidise poor consumers and independent power producers (IPPs). If government wants to achieve these noble aims, it should do so in a separate, transparent vehicle that taxpayers can monitor not impose an extra burden on some electricity consumers If a separate subsidised vehicle were set up for the support of IPPs, we believe Eskom’s price increase could be sensibly lowered to 7% or 8%.

Government needs to set a clear strategy with a realistic economic return on capital for Eskom. Eskom’s pricing proposal is excessive and would damage the economy irreversibly; all in the name of chasing an investment grade credit rating. We don’t know whether government or Eskom management has set this objective for Eskom, but it is misplaced. Eskom, with government’s blessing, can and should take on more debt to fund its expansion and charge a price that generates a real return on capital of 3% to 4%, excluding construction-in-progress. If this strategy were clearly communicated, the risk of regulatory uncertainty would be reduced and SA could attract the world’s leading power companies and foreign direct investment. In this way SA’s growth, competitiveness and credit rating would be enhanced. This objective is the real star.

*Brian Kantor is chief strategist and economist at Investec Wealth & Investment. David Holland is an independent consultant and senior advisor to Credit Suisse. The opinions are those of the authors’ and do not reflect the views of Investec or Credit Suisse.

The case against Eskom – redux

In our last edition, we argued that Eskom’s request for price increases, if agreed to by the regulator, would provide Eskom and its shareholder (the Republic of SA), with an unnecessarily high return on capital, some 8% per annum after inflation. We go into some of issues in more detail today, notably the use of depreciation allowances in setting prices.

We indicated that this expected return is more than twice the international norm and that if Eskom gets its way it will possess a very strong balance sheet by 2018.

The key is that this balance sheet strength can only come at the expense of its customers. As we have argued, the right prices for electricity for SA are those that would generate a 4% real return on the extra capital Eskom will be investing in new generating and distribution capacity. Such returns would put the economics of electricity pricing first and would make the state of Eskom’s balance sheet very much a secondary consideration. Moreover, it would still leave its balance sheet in a highly acceptable state for the low risk business it is.

The logic of the investment decision

All projects requiring an investment of scarce capital that offer a positive present value, given some appropriately estimated cost of capital, or discount rate, should ideally be undertaken in the interest of economic growth and efficiency. One of the primary principles applied to the decision as to whether or not to proceed with a project, be it a green-field project or an acquisition of another company, is that the economic and financial decisions should be separated.

The first question to be answered by any agency contemplating investing capital is the economic one. After estimating the extra revenues and operating costs related to the project it can be established whether or not the present value (PV) of these estimated operating cash flows exceeds the intended capital expenditure, given its cost of capital or required risk adjusted return (the discount rate). If the answer is affirmative the next question can be addressed: How best should the project be financed? When extra capital has to be raised from the market place it is the suppliers of capital that will decide whether the project that seems so promising to its originators can in fact go ahead.

At this point in the evolution of the planning process for additional capital expenditure judgments about the structure of the capital to be raised can be made. The presumed riskiness of the project and the strength of the balance sheet will influence the cost of raising additional debt finance. Also relevant will be the tax treatment of the project. Allowances for interest and especially depreciation expenses or investment allowances will make a difference to taxes levied and after tax returns. The firm and the market will compare the after tax, risk adjusted returns of this project with its next best, equally risky, alternative. Clearly if the internal rate of return (derived from operating cash flows) from a project with a limited economic life exceeds the interest cost of debt plus debt to be repaid over the same period, leverage will add to operating profits after taxes.

Why the depreciation allowance should not be regarded as a cost to be covered by regulated prices

A further important point that seems to be disregarded by both Eskom and Nersa is that depreciation allowances are not a cash cost of production. They do however affect taxes paid and bottom line accounting earnings and after tax returns. When estimating the PV of any project these depreciation allowances should not be deducted from operating cash flow when a project is accorded a limited economic life.

Allowing for depreciation on top of maintenance costs would clearly reduce the PV of the cash operating surpluses expected over the economic life of the project. A regulator including depreciation as a cost of production may then allow higher prices to be charged to achieve positive PV projects. This treatment of depreciation as a cost to be recovered in prices would represent a logical fallacy.

Economic depreciation is implicit in the economic life accorded to any project. The shorter the life allowed a project the lower the PV of the cash flows and so the faster the capital is being written off and vice versa: the longer the economic life the greater the present value of any flow of operating cash. It is simply wrong to add depreciation to operating costs when present valuing any project with a limited economic life. It leads to underestimates of PV and so fewer projects qualifying with a PV that exceeds their capital costs. When prices are set by a regulator, it leads to unnecessarily higher prices.

Eskom asks for more than ordinary depreciation allowances – it asks for cost and price inflating replacement cost depreciation

Eskom however has another trick up its accounting sleeve. It argues that the costs it is required to cover with prices include not only conventional depreciation for accounting purposes but so called replacement cost depreciation: a depreciation allowance of 10% p. a. This is applied to the capital equipment employed that is continuously revalued by their higher, inflation augmented, costs of replacement by new equipment .This gives a much higher value for the capital employed and so a much much higher depreciation charges (Eskom hopes) to be recovered through higher prices.

When estimating present value and finding projects with a present value that exceeds their cost depreciation allowances should not be included in costs to be recovered

It should be recognised that depreciation allowances should have no place in the regulator’s calculation. The right price for electricity is the price that would allow revenue to cover all cash operating costs plus the right return on capital – no more than 4% real – on additional electricity generating or distribution capacity that Eskom plans to invest in. Prices set by the regulator should be set to yield a positive PV using this 4% real discount rate (before taxes). If Eskom can justify such projects (which it surely can) then such projects should be financed with a high ratio of debt finance. Brian Kantor

The case against Eskom and its debt management driven price demands

The Eskom initiative for higher prices

Eskom has submitted its Multi-Year Price Determination (MYPD 3) to the National Energy Regulator of South Africa (Nersa) in which it is requesting annual electricity increases of 16% until 31 March 2018, of which 3% is targeted to support the introduction of Independent Power Producers (IPPs). This leaves a monstrous post-inflation increase of over 10% per annum for five years, which threatens the livelihood of small, energy-intensive businesses and the country’s citizens. On what basis does Eskom argue for such vigorous price demands?

What the Eskom balance sheet would look like if it gets its way with prices

If Eskom has its way with the regulators and the politicians on its plans for prices and costs, it will become one of the great companies of the world. It will be possessed of a balance sheet that would be the envy of the world, especially of the world of public utilities. By 2018 it would have assets that at replacement costs would have a value of over R1 trillion, more than three times its R300bn of debt.

The company would then command a AAA debt rating (better than that of the SA government) assuming this is technically feasible. It would incidentally be very helpful to ourselves and also Nersa were Eskom to present pro-forma balance sheets, income and cash flow statements over the five year planning period. It would be even more helpful if Eskom could present the outcomes of alternative scenarios for the balance sheet and debt ratios with lower prices.

Our overwhelming reaction to these Eskom proposals is just how ambitious and dangerous they are for the health of the SA economy.

Why Eskom behaves as it does and why it may be mistaken about the demand for electricity at much higher prices

We will leave it to others better qualified to examine and justify the much higher operating costs (mostly primary energy and employment costs) of generating extra capacity Eskom hopes to recover with higher prices. We have a strong sense that only time could prove – and hopefully will not be allowed to prove – that Eskom is greatly underestimating the real price elasticity of demands for its electricity as well as the opportunities it will open up for firms and households if Eskom gets its expensive pricing way to substitute (a la Sasol) locally generated power. Excess Eskom generating capacity may well become a feature of the future as it was of the past if the forecasts of demand prove over optimistic.

The new, already much more favourable financial reality for Eskom

In reality Eskom is now charging much more. The price charged by Eskom per kWh was 16.2c in 2006, which nearly doubled to 31c in 2010. These charges have since nearly doubled again to the current 61c per kWh. On top of these steep increases, municipalities that deliver electricity charge much more to their industrial and household customers than the Eskom wholesale price. As a result Eskom, after years of artificially low prices, is now earning an internationally comparable real return on all the capital it has invested. Eskom’s median cash flow return on operating assets (CFROI®) troughed at a negative level (-2.5%) in March 2009 at a time new generating capacity was essential to the functioning of the South African economy. CFROI represents the real economic return on inflation-adjusted capital and is comparable across borders and over time, making it an excellent benchmarking metric.

If we strip out the R159bn of presently non-productive construction-in-progress, Eskom’s CFROI improved to an internationally competitive 3.3% by March 2012. Our sense is that such a return, if maintained, would be sufficient to justify investment in additional capacity. With appropriate control of costs, revenue so generated will deliver enough cash from operations to support the balance sheet of a utility company that can typically sustain comparatively high debt ratios – given the essentially low risk nature of its business.

In the financial year to March 2012 Eskom undertook capital expenditure of R59bn. But given the abundant supplies of cash delivered from operations of R38.7bn, Eskom needed to raise only R16.5bn of additional debt in the last financial year compared to R30.5bn of debt raised in 2009. Eskom’s debt to equity ratio is falling significantly as we write.
It is the future of Eskom, not its past that matters when prices are set. Current prices plus inflation would be highly satisfactory returns on the investment being made in additional capacity.

More important than the historical performance is that at the current 61c per Kwh, assuming inflation adjusted prices and not much more than inflation adjusted costs going forward, the internal rate of return on its investment in additional capacity at Medupi or Kesuli power stations would be a more than satisfactory 14% p.a. That is a internal rate of return of six per cent per annum higher than what it costs the SA government to raise long term money. 14% nominal is equivalent to a real internal rate of return of 8% which, as we will argue, is excessive by comparison with global returns for utility companies.

The importance in choosing the right risk adjusted cost of capital for the regulator

The most important issue for any business or any regulator attempting to replicate the market process is just what this rate of return should be to justify an investment in a new project. It follows that the more risky the project is, so the higher will be the required return or discount rate applied to the project.

Electricity generation – especially where the regulated generator or distributor has a high degree of monopoly power – is among the lowest risk projects available in any economy. Demands for electricity are highly predictable compared to most other goods or services and the technology for coal fired stations is very well established.

Why Eskoms’s real cost of capital estimated at over 8% is double the required rate of return

Our major difference with Eskom and Nersa is that Eskom is demanding an exceptionally high real return on the capital it has invested and plans to invest. Last year, the median CFROI was 3.2% for the 100 largest listed electricity companies in the world.

The CFROI for power companies has been remarkably stable, averaging 3.5% over the past decade. For example, Electricite de France (EDF), one of the largest power companies in Europe, has a 10-year median CFROI of 3.6%. Malaysia’s Tenaga Nasional Berhad posted a 10-year median CFROI of 2.6%. Regulated utilities are generally fortunate to be granted a 4% real return on capital. There is no precedent for a real return as high as 8% for a regulated utility and Nersa should dismiss such assumptions about what is an appropriate return for a utility. A real return on capital of 4% should be more than sufficient in a country that requires greater growth to put people to work and place poverty behind us.

Eskom appears to have succeeded in convincing the regulator that 8% is a “reasonable (real) return on assets.” The market-implied real cost of capital for listed SA industrial companies has averaged 5.5% over the past decade. Listed firms, where shareholders are subject to the possibility of 100% downside, are far riskier than a government owned utility. Less risk should mean less return. A real return on capital of far less than 5.5% strikes us as reasonable for Eskom. Our benchmarking points to a 3.5% p.a real return as being globally competitive.

Why Eskom puts debt management first in its concerns when requesting price increases and why it makes little sense given its ownership

It is very clear that Eskom prefers, for its own reasons, not to separate the investment and financial decisions. Its primary objective in setting prices seems to be to strengthen its balance sheet excessively and unnecessarily. Hence the justification for extraordinary – way above required returns on capital – price increases rather than via brilliant control over costs or engineering competence – a success we all would approve of and share in.

We can argue whether or not electricity generating capacity in SA should be privately owned. We would argue for many, rather than only one, management teams responsible for electricity supply and so much more competition between alternative suppliers. It is however ironic that Eskom should wish to deny itself its primary advantage as a wholly owned subsidiary of the Republic. It can depend on the balance sheet of the Republic and by so doing borrow on the same favourable terms.

This facility would not make any difference to Eskom’s cost of capital or required – but relying on the balance sheet of its powerful shareholder would allow lower costs of finance and more debt with which to fund viable projects. If the internal rates of return realised by Eskom exceed the costs of finance, leverage adds significantly to the bottom line and the return on equity capital.

No doubt it is much more convenient and rewarding for the management of Eskom to enjoy financial independence and its own strong balance sheet and the bonuses that presumably come with high operating margins, earnings growth and very high returns on capital. But when this is achieved with excessively and unnecessarily high prices by exploiting its monopoly powers, this does not suit the SA economy at all. The demands of Eskom should be vigorously resisted by the regulator and public opinion. Brian Kantor and David Holland*

*David Holland is an independent consultant and senior advisor to Credit Suisse. The opinions are those of the authors’ and do not reflect the views of Investec or Credit Suisse.

Why is capital so much more productive than labour in South Africa?

JSE listed companies have an impressive record of generating wealth for their shareholders. We show how they have done so through their excellent management of the capital they have invested. We show also that such impressive performance has been associated with tepid growth in Real Value Added by the SA economy and declines in formal employment.

Click to read the full piece.

Mediclinic (MDC) and Capitec (CPI): The rights and wrongs of a rights issue – revisited

A number of JSE listed companies, most recently Mediclinic (MDC) and Capitec Bank Holdings (CPI) have announced significant capital raising exercises by way of rights issues to its shareholders to subscribe additional equity capital. Mediclinic has planned to raise an additional R5bn from its shareholders, adding 26% to the number of its shares in issue, while Capitec will raise R2.25bn thus increasing its shares in issue by 14%. Both issues are underwritten.

If the rights to subscribe new equity capital are taken up by established shareholders in the same proportion they currently hold shares, their share of the company will be unaltered. They will be entitled to the same share of dividends as before.

There is no change in ownership when a sole owner or all shareholders inject additional capital in the same proportion as their established shareholding.

In the case of a rights issue, established shareholders may however elect to sell their rights to subscribe to additional shares should they prove valuable, in which case they are giving up a share of the company and rewarded for doing so.

The key question for shareholders and the market place is the following: how well will the extra capital raised be employed? Will the capital raised from old or new shareholders earn a return in excess of its opportunity costs? (That is, will it earn a return in excess of the returns shareholders or potential shareholders might expect from the same amount of capital they could invest in businesses with a similar risk character.)

If the answer is yes, the market value of the company could be expected to increase by more than the value of the additional capital injected into the company. If the answer is a no, then distributing cash on the books of the company to shareholders, rather than raising additional cash, would be appropriate.

The dilution factor

The common notion that issuing additional shares will “dilute” the stake of established shareholders, because more shares in issue reduces earnings per share, assumes implicitly that the additional capital raised will not be used productively enough to cover the costs of the capital raised or earn more than the required risk adjusted return.

But this is not necessarily so. Additional capital can be productively employed and can add, rather than reduce, value for shareholders. It will be up to the market place to decide the issue.

In the case of a secondary issue of additional shares (rather than a rights issue) the answer is easily found by observing the share price after the capital raising. A gain in the share price would be evidence of a value adding capital raising exercise for both established shareholders who did not subscribe additional capital and also for those who did.

However to be a truly value adding exercise, these share price gains would have to be compared to market or sector wide gains or losses. If the share price gains were above market average, the success of the capital raising exercise would be unambiguous.

Estimating the value add in the case of a rights issue is more complicated. This is because the rights are typically priced at a large discount to the prevailing share price before the announcement. The reason for pricing the rights at a discount to the prevailing share price is to attract attention to the offer and by so doing to make sure that the rights to subscribe additional capital will have market value and so will be followed and the additional capital secured.

It should be appreciated that the established shareholders would be largely indifferent to the price selected for the rights issue. The lower the price, the more shares would have to be issued to shareholders to raise the same amount of additional capital. In effect, the shareholders are issuing shares to themselves – as would a sole owner injecting more capital into his or her business. For a sole owner the nominal price attached to the shares would be irrelevant. The lower the nominal price attached to the shares the larger the number of additional shares to be issued for the same amount of capital invested. The same is true of a rights issue. What matters is the amount of capital the shareholders are called upon to subscribe to. This can be divided into a larger or smaller number of shares by adjusting the price at which the rights are offered.

In the case of the Mediclinic rights issue, the company has priced the rights at 28.63 cents per share, raising R5bn by issuing 1.76m additional shares. Management might have decided to halve the offer of shares to 14.315 cents per share and issued twice as many shares, without disadvantaging the shareholders on its books. The advantage in offering large discounts is that the rights to subscribe to the new shares are very likely to offer positive value and if so, may more easily be disposed of by those shareholders who are financially constrained.

Simply put, the Mediclinic rights issue will be value adding for established shareholders if, after the capital raising exercise is concluded and the money raised, the company is worth more than an extra R5bn and the Capitec rights issue will be successful if the company is worth R2.3bn after its capital raising processes has been concluded.

Putting it algebraically

Some simple algebra can help make the point (readers without a mathematical bent may choose to skip this part and proceed to the conclusion). The break even condition is that the market value of the company after the conclusion of the capital raising exercise (defined as MC2) will be greater or at least equal to the market value of the company pre the rights issue, defined as MC1 plus the additional capital raised defined as k. That is MC2>MC1+k if the capital raising exercise is to be judged a success.

This equation may also be used to establish a share price that would represent a break even for shareholders after the conclusion of the rights issue. That is, the share price after the event that would satisfy the value add (or rather the no value loss) condition. MC2, the value of the company after the rights issue is concluded, may be derived conventionally by multiplying the share price (post rights issue) by the number of shares in issue (S2), that is the market value of the company after the capital raising exercise MC2 = P2 * S2 and MC1, the value of the company before the announcement, calculated in the same way as P1*S1 where S1 was the number of shares in issue before the rights issue. P2 is the breakeven price after the announcement. Substituting P1*S1 for MC1 and P2*S2 for MC2 and solving this equation for P2, the break even post rights issue price, gives the following formula for the break even share price after a rights issue as: P2 = (S1*P1+k)/S2.

In the case of Mediclinic, P1 was R40.05, the price ruling on the day before the announcement on 1 August. There were 652.3m shares then in issue (S1= 653.1m). After the rights issue, the number of shares in issue will rise to 827m (S2). K, the additional amount to be raised, is R5bn. Thus the break even share price P2 = R37.6.

Mediclinic closed at R40 on 27 September while the value of the rights closed at R11.30. Since shareholders received the right to 26.77 shares per hundred shares owned, these rights were then worth R3.02 per share to each shareholder (11.3*0.2677). Thus the post rights value of a share in Mediclinic was approximately R40.00 plus R3.02, that is R43.02, on the day before the trade in the rights was to close and comfortably in excess of the R37.6 break even share price.

If the price of a Mediclinic share today (1 October) maintains its 27 September value of approximately R43, the company will be worth R35.5bn. This may be compared to its pre-rights value of R26.12bn. In other words shareholders have put in an extra R5bn and have added value of R4.38bn. This rights issue may be regarded therefore as successful.

The break even share price for Capitec, by the same calculation, is R200.6. The share price on 27 September was R215.5. This price incorporates the rights to new shares at R160 that can be traded after 22 October until 2 November. If this value were to be maintained after 2 November, the company (with 114.4m shares then in issue) would have a market value of R2.45bn. This may be compared to its market value of R2.07bn before the announcement of the rights issue. Thus shareholders would be getting an extra R3.956bn for the additional R2.248bn they are investing in the company – a gain of R1.71bn.

Conclusion

Thus the capital raising exercises of both Mediclinic and Capitec may be regarded as very successful, at least so far. They are clearly expected to add value to the companies, that is, the extra capital raised is expected to more than cover its costs, above the risk adjusted required rate of return for investments of a similar character. Brian Kantor

The price of electricity- losing the plot

We discuss government plans to encourage beneficiation of minerals. We argue that unwillingness to beneficiate is a market outcome rather than a market failure. We explain that is may well become a government failure as the price of the essential input for industry- electricity- is priced well above its true full cost. We argue against setting the price of electricity in South Africa to protect the balance sheet of Eskom rather than the promote the competitiveness of the economy. Click for full report
Electricity prices