https://www.youtube.com/watch?v=S2DkBhr-so8&feature=youtu.be
Category: Corporate Finance
Fear debt – not raising equity capital – when it makes economic sense.
The threat to the value of SA retailers as cash has drained away during the lock downs has been as damaging to their landlords. The value of the average market weighted general retailer and property company on the JSE is less than 40 % of what they were worth in January 2018. The damage to the balance sheets of the property company of Covid19 is perhaps far greater than that of the average retailer. Who have shown a greater willingness to raise fresh equity capital to repair their balance sheets
The Value of JSE listed Property Companies and General Retailers January 2018 =100 Month end data to June 2020.
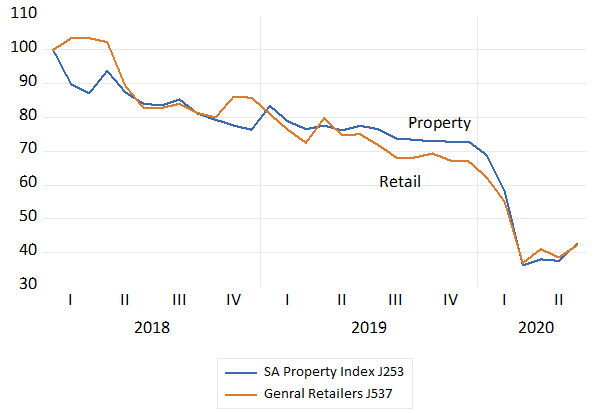
Source; Iress and Investec Wealth and Investment
A number of these JSE listed Real Estate Investment Trusts (Reits) with seemingly little growth in expected to come from SA assets, sought faster growth offshore. These offshore investments were funded very largely sometimes exclusively with foreign currency denominated debt.
The market value of average JSE Reit assets less debts, their net asset value (NAV) had fallen away before the Covid crisis that then decimated their rental revenues at home and abroad. A number of these JSE listed Reits now lack a sufficient buffer of equity to absorb the losses from COVID 19 related shutdowns. Debt to market value ratios have risen and NAV fallen further.
To qualify as Reits and avoid corporate taxes they are required to pay out at least 75% of their income after interest and all other expenses. They are appealing for an exemption from the Treasury and the JSE to skip dividends to conserve cash and still retain their Reit status.
They might do much better to raise equity capital, if they can, issue more shares for cash and pay off foreign and domestic debts. Even if the saving on foreign interest paid is minimal, provided the rand holds up, the improvements to their survival prospects and so market value could be substantial. Shareholders supported by stronger balance sheets could be well served facing up to a reduction in cash distributions per share. They would receive less income per share, but with lower risks attached to expectations of future distributions, this could add value to all the shares issued – even when there are more of them.
The purpose in raising capital may be, ideally, to grow a business successfully. Successful businesses mostly fund their growth from the cash they generate from operations. More unusually they may have to raise additional debt or equity capital secure the survival of a still potentially successful business.
The same fundamental question needs to be asked in both circumstances. Will in other words the increase in the market value of the company, plus the dividends paid, both measured in extra rands come to exceed the amount of extra capital raised. also in rands. Plus something extra to cover the opportunity cost of the capita raised. That is will the investment of extra capital return as much as could be expected from any alternative, as risky, a SA investment? Equal that is to the return from the bond market plus an equity risk premium- of about 5% p.a. (About 13% p.a.) If so investors will get all their capital back – and more – and perhaps very quickly as share prices could respond immediately to the expectation of good returns to come.
Any potential capital raise needed to save or de-risk a business will be reflected in the ongoing survival value of a company. Any surprising refusal of its owners to refuse to supply extra capital, when needed to secure the business as a going concern, will provide a very negative signal and surely damage the share price. Preventing the downside will be part of the upside of any capital raise.
A successful secondary issue, especially when underwritten by bankers exercising due diligence, is perhaps an even stronger signal of favourable longer- term prospects for any company. More so than a rights issue supported by established shareholders with everything to lose. With a successful secondary issue raising capital for the right value adding reasons, established shareholders can expect to have a smaller share of a larger cake and be better off for it.
The obvious way to maintain the share of established shareholders in a company is to raise extra debt, rather than equity capital. But more debt, makes any company more risky, and may destroy rather than add market value for shareholders. Debt only looks cheaper than equity with hindsight, after the good times have rolled by. And the good times may not last- as we have been so cruelly reminded.
A time to demand and supply extra capital for capital hungry business – post Covid19
A PS on the fundamentals of capital raising
The past quarter has been record breaking. Records have been set in extra spending by governments measured as a share of (normal) GDP. For the developed world this additional emergency spending by governments has ranged between an extra 5 to as much as 15 per cent of GDP. Another record has been set in money created by central banks. Of the order of an extra 5 trillion dollars worth. Included in their current bout of QE have been substantial purchases of corporate debt.
The monetization of much debt has meant very low interest rates with which to fund rapidly growing fiscal deficits and rising debt to GDP ratios. Records are therefore also being set in the amount of cash raised by businesses. Since the end of March, U.S.-listed firms have raised a quarterly record beating $148 billion of extra capital. Monetary policy has made capital raising on a vast scale possible on increasingly favourable terms. And without which a strong recovery from the lockdowns would be impossible.
Loan guarantee schemes, provided to commercial banks by central banks backed up by their Treasuries, has been an important component of the financial relief promised. These loan guarantees – should they be fully required to offset defaults – which is not at all expected – are available on a very large scale. In normally fiscally conservative Germany extra government spending on relief is of the order of 15% of GDP while the loan guarantee provision is of the order of 30% of GDP. For the US the stimulus plan is equivalent to 7% of GDP with the guarantee adding another 8% of GDP to the package.
It makes every economic sense that ordinarily sound and profitable businesses in SA as elsewhere not be forced out of the economy for an inability to service or roll over their debts for reasons entirely beyond their control. And are able to start up again by recapitalising their operations – given how much capital has been lost during the lock downs
The South African economy has not benefitted from fiscal and monetary relief on anything like the scale offered elsewhere. The additional borrowing requirement of the SA government has surged to over 14% of GDP more than double the deficit planned in February as we learned from the Minister of Finance yesterday June 24th. Largely because largely because tax revenues have declined so sharply- by over R300b with further declines expected. Extra government spending on its adjusted Budget is estimated as but R36b.
Despite a relative lack of encouragement of the kind offered in the US and elsewhere to the market for corporate debt, the capital market in SA has been active. We have seen something of a flurry of capital raising by JSE listed companies. The issue of relevance to shareholders (and the banks underwriting the issues) is whether the extra capital intended to be raised can pay for itself. That is will the extra capital raised earn a return that will covers the (opportunity) cost of the capital raised. That is equivalent to the high long-term RSA bond yield of 8% plus a equity risk premium of 4% or more for the least risky of businesses- something ahead of 12% p.a. returns for the least risky of enterprises.
If the answer is a positive one a rights issue or indeed any secondary issue to raise capital or indeed debts – should go ahead. And the hope must be that the market immediately shares this justifiable optimism and re-prices the company’s shares accordingly. That is prices the businesses raising additional capital them now for more likely survival rather than extinction.
The same positive answer is required of any business large or small that needs to raise capital to resume business post-Covid. Will the essential extra capital raised cover its risk-adjusted costs? We must hope that the SA financial markets, especially the banks, can help meet these additional, calls for extra capital. The loan guarantee scheme offered by the Reserve Bank in SA is perhaps the best hope for business and economic rescue.
The government has the task of ensuring that the capital market is up to this vital task of funding both government and business on sensible terms. Without which the prospects for a post-Covid recovery in SA, absent fiscal stimulation, remain especially bleak. The burden of economic relief has passed to monetary policy.
Postscript on capital raising on the JSE
We have seen something of a flurry of intentions to raise additional capital raising by JSE listed companies. The latest by retailers the Foschini Group (TFG) and Pepkor in the form of rights issues to their shareholders. Mister Price (MPR) another retailer has also indicated an intention to raise more equity capital.
TFG announced plans on June 18th 2020 to raise R3.95b from its shareholders, equivalent to 22% of its current market value of approximately R17.5b. A market value that has shrunk by more than half this year on fears of exposure to Covid19 accompanied by a seemingly debt laden balance sheet. The market has however reacted somewhat favourably to the announcement. The share price has held up since the announcement and regained a little lost ground when compared to the Truworths (TRU) share price, a rival retailer. ( See below the figures that chart the market value of TFG over recent years and where we compare the TFG share price to that of clothing retail rival Truworths (TRU)
TFG Market Value of Company Daily Data; 2016- June 22nd 2020
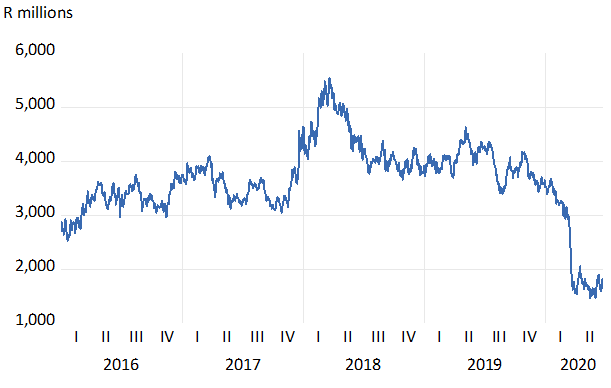
Source; Iress and Investec Wealth and Investment
TFG Share price and Ratio of TFG to TRU share prices – Daily Data 2020 to June 24th
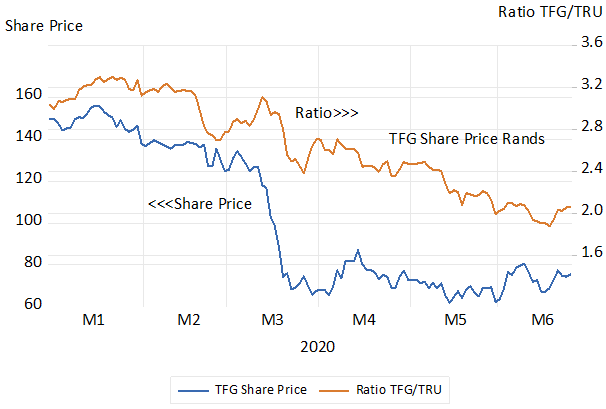
Source; Iress and Investec Wealth and Investment
The terms of the TFG rights issue (to be underwritten by a consortium of banks) will only be announced should the proposal gain shareholder approval on the 16th July. It should be understood that as a rights issue this extra capital cannot reduce the share of the established shareholders in the company, should they follow their rights. They may however prefer to sell such rights to subscribe extra capital. This benefit in selling the rights to subscribe can be regarded as compensation for giving up a share of the company’s profits and dividends and market value in the future.
The value of their rights will depend on the difference between the subscription price and the ruling market price. The larger this discount, the more shares will have to be issued to raise the required 3.95b – but only from its own shareholders. Hence there need be no dilution of shareholders. The market value of TFG must have increased by at least R3.95b for the shareholders to break even on their additional investment. They will be hoping for more upside over time. And some of the upside may even have been registered already in anticipation of the rights issue going through, even before the announcement of the rights issue itself, because of the better times it portends for the company.
The larger the difference between the ruling market price and the price at which the additional shares will be offered (the larger the discount) the more likely the rights will have value and be taken up. This outcome is only of importance to the underwriters. The more enthusiastic the response, the fewer shares the banks will have to take up. Presumably in this case the intention of the underwriters is not to hold shares in TFG.
A rights issue is equivalent to an additional investment by a sole shareholder in a company. The nominal value attached to the additional shares will be of no consequence other than to determine the number of extra shares issued, as identified in the books- all with the same owner. In practice the additional capital invested in a non-listed business is very likely to be identified as loan rather than share capital, to enable the owner to rank equally with other creditors in the event of a business failure
The issue of relevance to shareholders is will the extra R3.95b. of capital raised will pay for itself over time. That is earn a return over time on the R3.95b of additional capital that more than covers the cost of the capital raised. To add value for shareholders such future returns would need to average around 12-13 per cent per annum. That is to presume that the required returns from a retailer in SA would have to be at least equal to the returns certainly offered by a long dated government bond (currently about 9% p.a) plus a risk premium of 4% premium. They could hope to realise similar returns from any other JSE company taking similar risks with their capital. If the answer is a positive one, that is to say expected returns promise economic profits or economic value added (EVA) the rights issue or indeed any secondary issue (regardless of any dilution that might take place) should be approved.
There is a further consideration that established shareholders will bear in mind when approached for additional capital. The value of their shares will have declined in response to the damage caused to earnings and cash flow by the disruption of their ordinary activities caused by the lock down. Hence the need for additional capital. Companies that entered the lock down with relatively debt laden balance sheets will be recognised as more vulnerable to financial stress. However the prospect of a rights issue that would mitigate this danger would always be reflected, favourably, in the current value of the shares.
Any unexpected failure of shareholders to approve a share issue of this kind would surely raise the likelihood of default and immediately reduce the value of a shareholding. Not throwing good money after bad may be the right decision. But if it comes as a surprise to the market place such a refusal will provides a very negative signal. Vice versa if a surprising rights issue is successfully launched.
A successful secondary issue, underwritten by bankers, that does not demand participation by possibly jaundiced established shareholders, is perhaps an even stronger signal of favourable longer- term prospects for any company. The avoidance of dilution should not be a primary consideration in any capital raise. If the additional capital is expected to realise an economic profit, established shareholders will benefit in line with newly attracted shareholders. They can expect to have a smaller share of a larger cake and be better off for it.
The more obvious way to avoid dilution of established shareholders is to raise extra debt rather than equity capital. But the market for debt issues may not be as open as the equity market. As would appear to be the case in SA, but not in the USA. But more debt as we have seen makes any company r more risky. Andwhen business as usual is disrupted debt becomes particularly burdensome. Debt is not always cheaper than equity. It may appear so in the good times that may not last.
The same positive answer is required of any business large or small post Covid that needs to raise debt or equity capital to resume business post Covid. That is will it earn economic profits in the true opportunity cost sense? Will the investment beat its cost of capital, that is return more than is required to justify the investment? We must hope that the SA financial markets, including most importantly the banks, can meet these additional, fully justifiable calls for extra capital. The government with its central bank has the task of ensuring that the capital market is up to this vital task.
Making the most of the investment holding company
Investment holding companies have long played a large role on the JSE. Two of the more important of them, Naspers and PSG, have provided spectacular returns for their shareholders in recent years. R100 invested in PSG in January 2010 with dividends reinvested in the stock has grown to R1435 by late June 2019. The same R100 invested in Naspers would have almost as well for its shareholders over the same period having increased its rand value by 14 times.
Not all holding companies are equal. A one-time darling of the JSE, Remgro has barely managed to keep pace with the JSE All Share index- R100 invested in Remgro or the JSE in 2010 would have grown to about the same R250.
Total returns; Naspers, PSG, Remgro and the JSE All Share Index (2010=100)
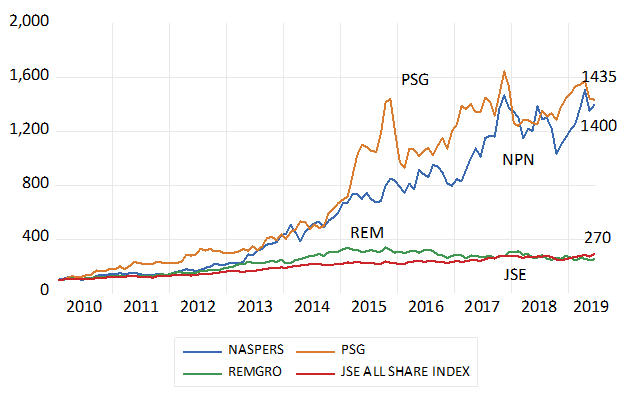
Source; Bloomberg, Investec Wealth and Investment
The advantage enjoyed by the managers of an investment holding company is that the capital made available to them is permanent capital. It cannot be cashed in, as is the case with a mutual fund or unit trust, that may be obliged to redeem capital and may have to sell down their assets to do so.
It therefore can invest in potentially market return beating companies, companies that will return more than their opportunity costs of capital – if only in time. Its often significant shareholdings may give it a useful, active role in improving the performance of the operating companies it invests in.
While shareholders in a listed investment holding company cannot force any liquidation of assets, they can always sell their shares. At a price that would have to be attractively low enough to promise the buyer a return at least as good as is promised elsewhere in the market place – for a similar degree of risk.
This market-clearing price, multiplied by the number of shares issued will determine the market value of the holding company. And this market value, as in the case of Naspers (since 2014) and Remgro (continuously since 2010 )– has been well blow their Net Asset Value (NAV). That is the holding company is likely to be worth than the sum of its parts – were the parts unbundled to its shareholders. No doubt to the chagrin of its managers when their company is judged to be worth more- sometimes much more – dead than alive. And who may well have delivered market beating returns in the past.
The market and net asset value of the holding company will always have much in common. The market value of its listed assets and its net debt would be included in both- as would the value of its unlisted assets- though the market may judge them to be worth less than the director’s estimates included in NAV.
The market value will however be influenced by two other important forces, not reflected in its marked to market, balance sheet, its NAV. Included in market value, but not NAV, will be two unknowns -the expected implicit costs to shareholders of running the head office- and the present value of its ongoing investment programme. Past performance may not be a good guide to expected performance as we are often reminded. The economic value expected to be added by the extra capital to be invested by the holding company may be presumed by the market place, to be insufficiently promising to compensate for the costs of running the head office. Hence reducing market value relative to NAV
The way for the managers of a holding company to close the value gap between NAV and Market Value is clear. That is to adopt a highly disciplined approach to acquisitions and investments. And be as disciplined in the rewards offered managers. A plan to list major unlisted assets to prove their value and to unbundle them when their investment case has been proved, will help add market value. Market value adding – performance related pay – can also be well aligned with the interest of shareholders if made dependent on closing this gap between NAV and market value.
The restructuring of Naspers has been very well received by the market- place. What does the future hold for its shareholders?
The Naspers value gap (net asset value less market value) has narrowed significantly since the restructuring – which will see a Newco being listed in Amsterdam – was announced to the market. What does this mean for shareholders?
The proposed restructuring of Naspers, first mooted in March and now confirmed in a circular to shareholders on 29 May, has been favourably received by the market. The intention is to restructure Naspers into two linked companies: a Newco (to be named), with a primary listing in Amsterdam and a secondary listing on the JSE, and a new Naspers with its primary listing still in South Africa.
The Newco will hold the international assets of Naspers, including its 31% of Tencent, and will focus on global opportunities. The South African Naspers will have a 73% share of the Newco, will hold the local assets of Naspers and will also pursue investment opportunities – presumably mostly in South Africa.
Naspers shareholders in absolute terms were, at the start of June, about R120bn better off than they were three weeks previously, according to calculations by my colleague Thane Duff of Investec Wealth & Investment. The Naspers share price has outperformed that of Tencent recently.
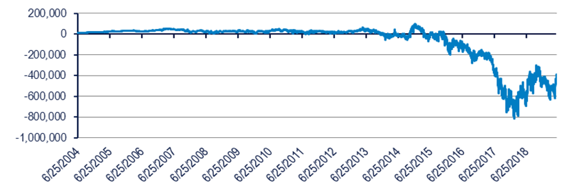
To explain, the large gap between the net asset value (NAV) of Naspers (the sum of its parts of which the holding in Tencent dwarfs all the others) and the market value of Naspers (now R1.462 trillion rand) has narrowed by as much as R120bn in recent weeks.
This value gap (NAV less market value – which we can describe as the difference in the value of Naspers were all its assets unbundled to shareholders and its value as an ongoing business) however, remains a considerable R386bn. The value of the Naspers holding in Tencent is currently worth 127% of the market value of Naspers – or as much as R1.85 trillion.
This value gap emerged only in 2015, with the appointment (coincidentally?) of Bob van Dijk as CEO. The value gap has been as much as R800 billion since then and is now close to its post-2015 low. Its further direction will be of crucial importance to shareholders and, one hopes, also the senior managers of Naspers who control its destiny through the high voting shares they own.
Figure 1: Naspers – NAV minus market value (R billion)
The NAV and market value of Naspers have much in common. Common to both is the market value of the listed assets it owns (Tencent and MailRu being the most important). Also common is the value accorded to the unlisted assets of Naspers, though the value ascribed to these unlisted assets by the directors and included in the balance sheet may well be greater than the value accorded them by the market.
This could be one reason why NAV exceeds market value. What will not be recorded in the Naspers balance sheet or in NAV, but will affect the market value, is the expected cost of running the Naspers head office, as assumed by investors and potential investors. The more shareholders are expected to pay management for their services in the future – including the extra shares to be issued to managers that will dilute their share of the company – the less Naspers shares will be worth today.
A further force that can add to or subtract from the value of a company is the expected value to its shareholders of the business that the company is expected to undertake in the future. The more profitable the investment programme of a company is expected to be, the more value a company will offer its shareholders. Profit in the true economic senses means the difference between the internal rate of return on shareholder capital invested by the firm and its opportunity cost, that is, the returns its shareholders could expect from similarly risky investments made with its capital when invested outside the company. It is the economic, not the accounting profit earned after allowing for the cost of utilising equity as well as debt capital, that matters for the market value.
This cost of their capital for SA shareholders – or the required return on the capital they have entrusted to Naspers – is of the order of 14% a year. This 14% is equivalent to the returns currently available to wealth owners in the RSA bond market (about 9% a year for a 10-year bond) plus a premium, to compensate for the risks that these returns may not be met from the averagely risky SA company.
If Naspers were expected to achieve consistent returns of more than 14% on the large capital investments it makes every year, this programme could be expected to add to its market value. If the market expected otherwise, where the returns on the investments would fall short of their costs, then the investment programme would be expected to destroy the wealth of shareholders. And the more Naspers was expected to invest, the more value destruction would be reflected in its share price: that is, the larger the difference between NAV and market value would become.
We draw on the Credit-Suisse-Holt database for estimates of the recent investment activity of Naspers. The sums invested are large in absolute terms as may be seen in figure 2 below: they’re estimated as of the order of R200bn per annum in recent years. Holt also estimates a currently negative return on capital invested by Naspers – that is, a negative cash flow return on investment (CFROI). If the estimate of the scale of the Naspers is correct, then the investment programme is large enough to account for a large reduction in its market value accorded by a sceptical share market.
The recent sale by Naspers of 2% of its Tencent holding realised nearly US$10 billion. A large additional war chest it must be agreed, but not perhaps enough to result in as much value destruction of the order recently observed.
It suggests that shareholders also attach significant costs to them of the rewards expected to be awarded to managers – perhaps particularly in the form of share issues and options – that over time can consistently dilute their share of the company. If the number of shares issued as remuneration amounts every year to as much as 1% of the shares in issue, this becomes an expensive exercise for shareholders.
Figure 2: Naspers – gross investment
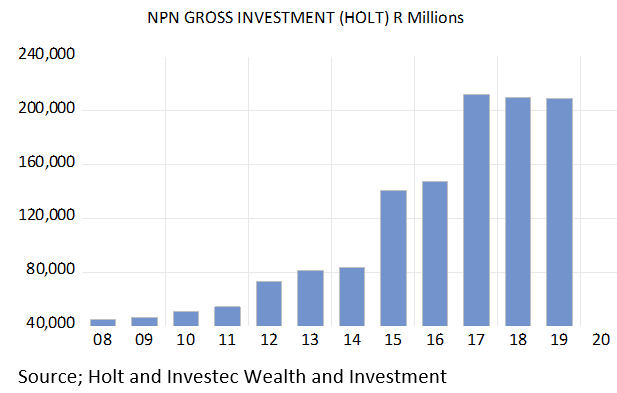
Source: Holt and Investec Wealth & Investment
Will the future be much different for Naspers shareholders?
The critical issue for shareholders in the restructured Naspers remains as before. How successful – how economic value adding or destroying – will its investment programme become, and how generous will the company be to its managers?
There seems little likelihood of much change in behaviour of either kind that would cause investors to change their assumptions about Naspers. The managers are unlikely to become less ambitious in their search for game-changing investments of the kind it made in Tencent. But it will soon be doing so out of two highly interlocked companies.
The international investment activities will presumably be conducted out of Amsterdam. The South African company will also have an investment programme of its own, presumably in South African and African opportunities. One imagines, however, that the larger investments bets will be made internationally by the Amsterdam-listed company, given the much larger opportunity set. Dividends (largely from Tencent) that flow out of Amsterdam back to South Africa will presumably be influenced by the scale of this investment programme.
One anticipates that both companies will not easily convince investors that they are capable of undertaking enough value-adding investments to compensate for the cost of management. Therefore, the Naspers shares will be priced lower (to compensate for value destruction and head office costs) for an expected return in line with market averages. Given a lower than otherwise share price for both companies, both are likely to stand at a discount to NAV and should continue to offer a value gap of significance.
Yet the Amsterdam company will also be priced to offer a market-related return for a company listed in Amsterdam and, under the jurisdiction of the Netherlands, a developed economy. The owners of the 27% free float in the new Amsterdam company will accordingly attach a lower real discount rate to the expected benefits of their share of the company. They will be satisfied with lower expected nominal and real returns, because they will attach less risk to doing business with the government of the Netherlands than with the SA government.
The lower returns required of a company in the Netherlands will be equivalent to the yield on a Netherlands government bond (close to zero, even negative) plus the same 5% risk premium. This makes for a required nominal return of 5% rather than the 14% required of a South African-listed company, where inflation is expected to be much higher and the sovereign risk premium is higher.
The important difference in real expected returns (returns adjusted for expected inflation) is an expected average real 5% in the Netherlands (given no expected inflation, only a risk premium) and a real return in South Africa of about 3% higher (8% real return expected from the average South African company). This 8% real is the equivalent of the 14% nominal required return, less the 6% inflation rate expected in South Africa.
This lower real discount rate makes Naspers shares worth more in Amsterdam than they would be worth in South Africa (all else remaining unchanged) and also worth more for shareholders in Naspers South Africa with their Amsterdam investment.
But all else will not remain the same, including the market value of Tencent shares. This will still be the main force driving the value of the Naspers companies. What could change the game for shareholders – and help further lower the gap between NAV and market value – would be for the company to reward its managers on their ability to close this value gap. That surely would align the interest of managers and shareholders and therefore add value.
What matters for shareholders is return on capital. Managers should be rewarded accordingly
The best managers can do for their shareholders is to realise returns that exceed the opportunity cost of the capital entrusted to them. That is to generate returns that exceed the returns their shareholders could realistically expect from alternative, equivalently risky investments.
This difference between the returns a firm is able to earn on its projects and the charge it needs to make for that capital, is widely known as Economic Value Added (EVA).
This economic profit margin is sometimes described as a moat that protects a truly profitable firm from its competitors. But more than intellectual property or valuable brands that keep out the competition and preserve pricing power, a truly valuable firm will have a long runway of opportunities to invest more in cost of capital beating investments. It is the margin between the internal rate of return of the company and the required risk adjusted return, multiplied by the volume of investment undertaken that makes for EVA and potentially more wealthy owners- not margin alone.
The task for managers is to maximise neither margin nor scale – but their combination – EVA. For investments today in SA in rands an averagely risky project, given long term RSA interest rates of about 9% p.a. would have to promise a return of more than 14% p.a on average to hope to be EVA accretive.
The leading advisor on corporate governance in the US now agrees with the all importance of EVA when evaluating managers. Fortune Magazine of the 29th March reported that
“On Wednesday, ISS, the U.S.’s leading adviser on corporate governance, announced that it’s starting to measure corporate pay-for-performance plans using a metric that prevents CEOs from gaming the system by gunning short-term profits, piling on debt, or bloating up via pricey acquisitions to swell their long-term comp. ISS’s stance is a potential game-changer: No tool is better suited to holding management accountable for what really drives outsized returns to investors, generating hordes of new cash from dollops of fresh capital……”.
Positive EVA’s or improvements in EVA do not translate automatically into share market beating returns. The share market will always search for companies capable of realizing EVA. And who reward their managers accordingly in ways that align their interest with those of their shareholders. Such remuneration practice provide investors with useful clues about prospective EVA. It will help them follow the money. Managers after all will do what they are incentivized to do.
When EVA is positive, realizing as much of it as may be possible, calls for raising cash rather than paying it out- negative rather than positive cash flow – after spending to sustain the established capital stock. Not only retaining cash – not paying dividends but raising fresh capital- equity or debt- can make every sense if EVA enhancing.
Paying up for prospective EVA will raise share prices and reduce realized market returns. And investment activity that is expected to waste capital will reduce share prices to improve prospective returns. Investors may change their minds about how sustainable EVA will be. Investors, by adding or reducing the period of time before margins inevitably fade away in the face of predictable competition, can make large differences to the market value of a company- and can do so overnight.
These expectations as well as changes in the climate for doing business, as in interest rates that help determine the cost of capital, are often well beyond the control of managers. Managers should be encouraged by shareholders and investors to maximise EVA – not their share prices or total shareholder returns over which they can have little immediate influence, given all the other value creating or destroying forces always at work. They should neither be indulged, when by luck more than their good judgment, the market takes all share prices higher. Nor should they be penalized when the market turns sour.
Shareholders and their managers with EVA linked rewards- should hope that positive EVA surprises – when sustained – will be appreciated by investors willing to pay up for their shares. It may take time to convince investors of the superior capabilities of a management team and their business models. But superiority can only be demonstrated by consistently adding economic value beating the cost of capital.
Updated: Banks and the next financial crisis- a refutation of the Mervyn King thesis
Summary- a shorter version of the full analysis to be found below
I recently read Mervyn King’s The End of Alchemy: Money, Banking and the Future of the Global Economy, (2016 and 2017) with some concern. The alchemy of which the former governor of the Bank of England is much concerned is the money multiplier, that bank deposits that serve as money are a multiple of the cash supplied to the banks by their Central Banks. This shibboleth, that banks have some dangerous magical power to create deposits, that is money, has long been disabused.
It was argued by Tobin and others in the sixties that banks are a particular kind of saving intermediary that funds its lending by suppling an attractive payments facility. The willingness of banks to supply this costly service depends on their profitability. Without income from lending – funded by deposits – the banks might not have been able to supply the costly payments system on the scale they have done. And the economy would have had to rely much more on receiving and delivering cash- a very costly alternative.
That is unless the banks could have charged fees to cover the full costs of managing the payments system. However such fees might have discouraged the demand for deposits and increased the demand for cash. Hence the banks in effect cross-subsided the transactions depositors would make with the revenue earned from their lending activities. The profitability of banks depends in part on managing their cash reserves, keeping them as small as possible – and by holding no more than prudent reserves of equity capital to cover non-performing loans and improve the return on shareholder’s capital. In other words from leveraging their balance sheets.
It is not the deposit multiplier but the leverage of the banks that exposes their shareholders (and the broader economy that depends upon sound banks) to the danger that non-performing loans may exceed the equity of the bank – hence bankruptcy or the necessity to raise more equity or debt capital . However it is not only the deposits (liabilities of the banks and assets of depositors) that may be destroyed by the failure of a banking system. Of greater importance is that the payments system, of which deposits are an essential part, can go down with the banks, with truly catastrophic effect for any modern highly specialized economy.
Perfect safety can only come with deposits fully backed by cash issued by the central bank. Banks as we know them however would not have been able to supply transaction balances and be profitable enough to survive- without taking on leverage. Leaving banks to make the trade-off between risk and return, has worked well enough most, but not all of the time. The Global Financial Crisis of 2008 demonstrated why it is very important to be able to deal with a banking crisis – should banks or more specifically, the payments system delivered by banks be threatened with failure. The solution to any run on the banking system is for the central bank to supply more than enough cash to stop the run. Or to prevent it in the first place should it be recognized that the banking system is indeed too important to be allowed to fail
As the responses (on the fly) to the GFC proved it is not beyond the wit of man to preserve the payments system from failing should such a melt-down threaten. It is moreover not beyond our wit to develop bankruptcy laws for banks that will always in all possible circumstances preserve the payments system. Such a fail-safe system does not have to allow bankers and their governors to escape the consequences of failure.
That is the known fear of failure and its consequences will be enough to focus the minds of bank lending officers on the trade-off between reward and risk – enough to reduce the threat of banking failures in the first instance. But there can be no guarantee of permanently responsible behavior- of too much rather than too little leverage and bank lending. Too little bank lending is another danger to an economy as the European banks may be demonstrating today.
What should be guaranteed by the government is the survival of a payments system that is indeed too big to fail and might have to be taken over in a severe emergency. Via a predictable, legitimated process that would forestall any panic by depositors that they would not have access to their deposits to make payments with.
Perhaps modern information technology will in due course allow a 100 percent, central bank deposit backed, fee collecting payments providers to survive and compete with the deposit taking banks. And so eventually take over the responsibility of the payments system from private banks- if the fee structure is attractive enough to compete with the banks for the transactions balances of households and firms. If so deposit taking banks, supplying a bundled service of payments with the aid of leverage may fade away to be replaced by other forms of financial intermediation- with leverage – but without responsibility for making payments.
This brave or rather more cautious new world may be the next wave in the evolution of a financial system. One that would provide for the separation of the payments system from the dangers of leverage. Wisdom would be to let a profit seeking competitive financial system evolve in response to the preferences of lenders and borrowers and for regulators to stay out of the way. Other than to design a predicitable rescue operation- that could be called upon in extremis – and be expected to save the payments system – but not lenders or borrowers from the consequences of their own follies.
The full analysis
Banks and the next financial crisis- a refutation of the Mervyn King thesis
Mervyn King who led the Bank of England between 2003 and 2013, and through the global and British financial crisis of 2008-09, is a very worried man. In his book The End of Alchemy: Money, Banking and the Future of the Global Economy, (2016 and 2017) he argues that another financial crisis is all but inevitable given the essential character of a modern banking system. I have serious reservations about the King monetary diagnosis and prognosis for the banking system. They have stimulated this discussion on the nature and future of banking.
The apparently dangerous alchemy that King identifies, the reason for his pessimism about the financial future, is the ability of private banks to create money. It is not a concern shared by most monetary economists.
Referring to the seminal work of James Tobin
The work of James Tobin, Nobel prize winner and inventor of portfolio theory in the nineteen fifties and sixties was highly influential in this regard. Tobin explained that banks do not magically “create money” in the form of deposits that are a substitute for the cash that would otherwise be held and exchanged.
Rather following Tobin banks are better understood as profit seeking businesses supplying deposits (not creating them) in response to the demands for them. A supply that is accompanied by significant costs of production that have to be recovered through interest charges for the loans they make and the fees they charge customers for the transactions they facilitate. The wealth banks create for their shareholders will depend on successfully covering the significant costs of supplying these deposit facilities and managing the associated payments system. It is the increase in the value of the equity of a bank that constitutes wealth creation. Raising deposit liabilities is a means to this end. Tobin emphasized that the real size of any banking system, its role in the economy measured perhaps by the ratio of bank liabilities to GDP, will be determined by the profitability of banking.[1]
The importance of the payments system provided by banks
A large part of the reason why customers of banks (firms and households) hold deposits with banks, is that they can be withdrawn on demand – to easily make and receive payments. Bank deposits give access to the payments system that is indispensable for the working of any complex economic system. The loans banks provide and the interest spread they earn, help support the provision of a payments system.
A banking and financial crisis does not only threaten the value of deposits and other credit supplied to the banks, and the value of bank shares. It threatens the ability of the banking system to maintain the payments system. This is perhaps the more important reason to rescue a financial system from implosion. If left to its own devices a financial crisis could destroy the payments system causing incalculable damage to the economy.
The money multiplier and how it evolves for good and helpful reasons
King’s alleged alchemy is the fact that these deposit liabilities of the banks are, as may be easily observed, a multiple of the cash supplied to the economy by central banks. This money multiplier (the ratio of bank deposits to central bank money) sometimes described evocatively as “high-powered money” emerges when banks cover only a fraction of their deposit liabilities in the form of cash- notes or deposits issued by the central bank. These reserves of cash are to be found on the asset side of the balance sheets of banks.
The banking regulators usually impose a minimal cash to deposits reserve ratio on the banks. Banks for good business reasons would hold a cash reserve, even when not regulated to hold minimum balances. They would do so to guarantee the convertibility of their deposit liabilities- a prime attraction for the depositor. But given low rates of interest or zero rates of interest earned on their cash reserves they would always have an incentive to minimize such holdings of low return cash. Until the global financial crisis of 2008 banks typically kept minimal excess cash reserves- over and above required reserves. They relied on the ability to borrow cash from other banks or the central bank should they have to supplement their cash reserves, given some unexpected outflows of cash to customers or other banks.
No cash will be lost to the banking system, as opposed to an individual bank, when the loans made by one bank, when drawn upon to pay for goods and services or to pay rent, interest or dividends, end up as deposits with another bank- as they mostly do. That is the banking system will set off credits and debits in an electronic version of an old fashioned clearing house without suffering any net drain of cash. That is unless notes are withdrawn from the banking system should customers in general increase their demands for notes to hold in their purses or pockets. Or funds are transferred to banks abroad to settle in deficit of the financial accounts of the balance of payments.
It is the fraction of deposits that the banks hold as cash that sets the upper limit to the supply of deposits and the money multiplier. The smaller the fraction of cash reserves to deposits held by all banks the larger will be the multiplier. And the more the economic system relies on banks for making payments, as an alternative to cash payments and receipts, the slower will be the rate at which cash drains out of the banks. And the smaller will be the optimum cash reserve ratio.
Individual banks compete with other banks to attract deposits. There is no guarantee that the loans they make will return to them in the form of a deposit made by another customer to automatically fund their loan book. The funds loaned and used to fund spending are very likely to flow to other banks and lead to a claim on their cash reserves held with the central bank.
If the banks kept or had to keep full cover for their deposits – a hundred per cent reserve- against their deposit liabilities – there would be no money multiplier. There would also be no banks as we know them. Because without leverage and an interest rate spread there would not be enough reward for providing the payments system as well as cover the costs of attracting deposits. The access to a comparatively low-cost payments system- transferring deposits (now electronically) rather than delivering cash – is the essential attraction of a bank deposit. The interest spread between the rate offered to depositors and the rate charged to borrowers was used to compete down the fees that banks might otherwise have charged to make or receive a payment. Fees that might have limited the appeal of their deposits. And improved that of other banks offering a less expensive transactions service. The mixture of interest offered to depositors- perhaps even zero interest -was part of a bundled service that included the transaction facility.
By supplying deposits in exchange for cash a banking system serves to mobilise what would otherwise have been idle cash. Cash that would be held under the proverbial mattress and not pooled by a banking system able to extend credit. Surely such a development is helpful to economic growth because it adds to the rewards for saving – if only in the form of convenience and safety – and by adding to the supply of credit- makes it possible for others to borrow more?
Or put alternatively, the more developed a financial system – the more involvement in it by financial intermediaries including banks – the more debits and credits recorded in aggregate and relative to GDP – the more specialization of economic function is likely to follow. The decisions to save and the decision to add to the capital stock can be separated, encouraging more of both.
For their holders the deposit balances they hold with banks are naturally regarded as a part of their wealth -part of their portfolios, part of their bundle of more or less liquid, assets that make up their chosen portfolios. Their bank deposits are as much the result of decisions to save and not spend income as would be any decision to add to a stock of financial securities held by any wealth owner.
As Tobin and others demonstrated banks are but a class of financial institution that offers services to both savers (lenders) and borrowers (spenders) and intermediates between them. What makes banks different and important is more than their often-large share of the total market for financial assets and liabilities. This share is under constant competitive threat from other potential borrowers and lender- sometimes called ‘shadow banks”. It is the role banks play in facilitating payments that makes them a special kind of financial intermediary. A threat to a banking system becomes a threat to the payments system without which an economy could not function.
Banks can fail- so what should be done about such possibilities?
But banks can make mistakes as may any enterprise. They can fail if they make very poor lending decisions. Perhaps so poor that the losses on its loan book are enough to wipe out the equity on its books and on the stock market. Banks are usually very highly leveraged. That is the ratio of all their debts- including deposits – to their assets, is typically very high. Of which cash and other easily liquidated assets at predictable prices are but a small proportion.
The equity capital supplied by shareholders to fund bank lending may constitute as little as 10% per cent of their assets. This means that banks have little room for the mistakes, their non-performing loans with little market value. Such mistakes- poor lending decisions- can exceed the value of their equity and make a bank worthless to its shareholders.
The danger posed by banks to the system is not that they keep fractional reserves of cash to cover their deposit liabilities- hence the money multiplier -as Mervyn King appears to believe. The danger is that bad loans can destroy a highly leveraged bank. The losses made by a bankrupt bank may mean depositors and other creditors of the bank also suffer losses. It is leverage, not the money multiplier, that represents danger to the banks and the economic system that depends on them.
When the failure of one important bank threatens the solvency of other banks, who may be amongst its important creditors, more than the wealth of its creditors may be at risk. A banking crisis threatens the viability of the payments system that the banks provide and that is essential to the functioning of the economy. It is not so much that banks cannot be allowed to fail – it is the payments system that cannot be allowed to collapse. This would bring the economy down with the banks.
Any sustained run on the banks – for fear of depositors that they will not have ready access to their deposits- or because the value of their deposits is threatened by a banking failure- will bring the system down. Banks as we have indicated only hold a fraction of their demand deposits in cash to cover any rush by their depositors to cash in. The attempts to find cash by the forced sale of ordinarily sound assets will destroy the balance sheets of even the most conservatively managed bank.
The solution to any potential banking crisis is obvious enough- create enough cash to meet any panic demands for cash
There is only one solution to a widespread banking crisis. That is for the central bank to create as much cash as is required to allay the panic that there may not be enough cash to satisfy depositors and other creditors of all the banks in the system. Hence the quantitative easing (QE) practiced by the US Fed, the Bank of England, the European Central bank and the Bank of Japan in response to the Global Financial Crisis (GFC) of 2008.
QE made cash available in historically unprecedented quantities to the banks under siege after 2008. It represented a new very special case of central banks acting as lenders of last resort, as such a rescue operation would have been described before QE.
We show below how this money multiplier in the US (bank deposits/cash supplied by the central bank) collapsed after the global financial crisis (GFC) and quantitative easing (QE) The Fed issued very large additional supplies of cash to the US system- in exchange for government bonds and mortgage backed securities they bought from clients of the banks- who deposited the proceeds of such sales with their banks. The banks in turn added to their deposits with their central banks.
The reserves held by member banks with the Federal Reserve System grew from 10.5 billion dollars in July 2008 to $67.5 billion by the end of August 2008, the first round of (QE) – and increased further to a peak amount of 2.7 trillion dollars in March 2015, after further rounds of QE. The money multiplier, the ratio of broadly defined money M2 (mostly bank deposits ) in the US therefore fell from between 8 and 10 times central bank money before the crisis, to a low of about three times in 2014. (see figure 1 below)
As may be seen in figure 3 below, this growth in reserves were almost all in excess of the reserves the banks were required to hold, approximately 10b in July 2008.
The money multiplier in South Africa has remained consistently at much higher levels. The SA Reserve Bank did not undertake quantitative easing. (See figure 2)
[1] The seminal Tobin paper is Commercial Banks as Creators of “”Money”, Reprinted from Banking and Monetary Studies,edited by Deane Carson, for the Comptroller of the Currency, U.S.Treasury (Homewood,Ill; Richard D. Irwin,Inc., 1963), pp 408-419. Reprinted in Financial markets and Economic Activity, Donald D. Hester and james Tobin, editors, Cowles Foundation for Research in Economics at Yale University, Monograph 21, John Wiley and Sons, New York ( 1967)
Fig.1; The US Money Multiplier (M2/Money Base)
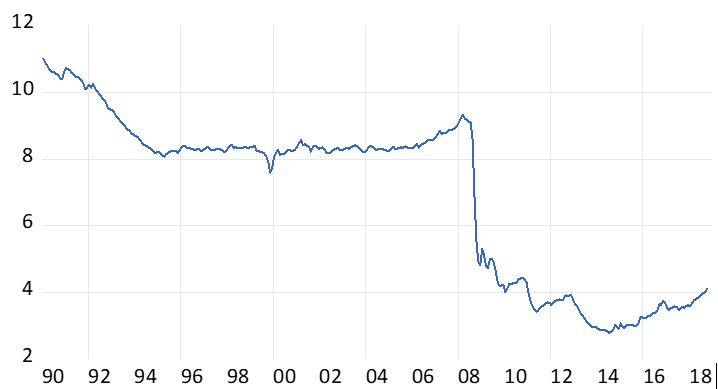
Source; The Federal Reserve Bank of St Louis (FRED) and Investec Wealth and Investment.
Fig.2; The South African Money Multiplier
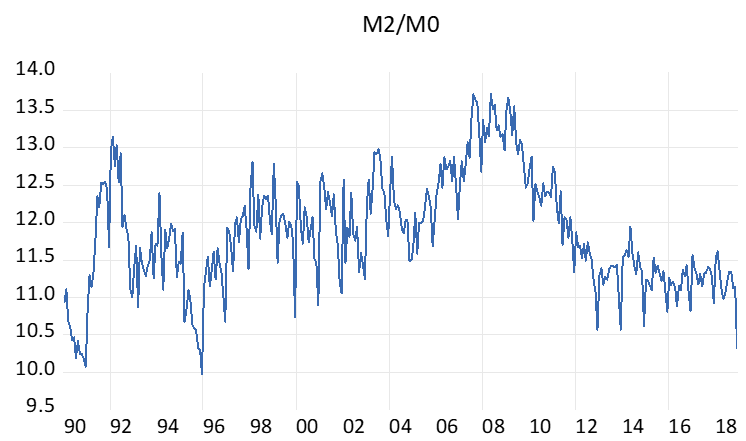
Source; South African Reserve Bank and Investec Wealth and Investment
US Money Base Currency in Circulation + Reserve Balances with Federal Reserve System
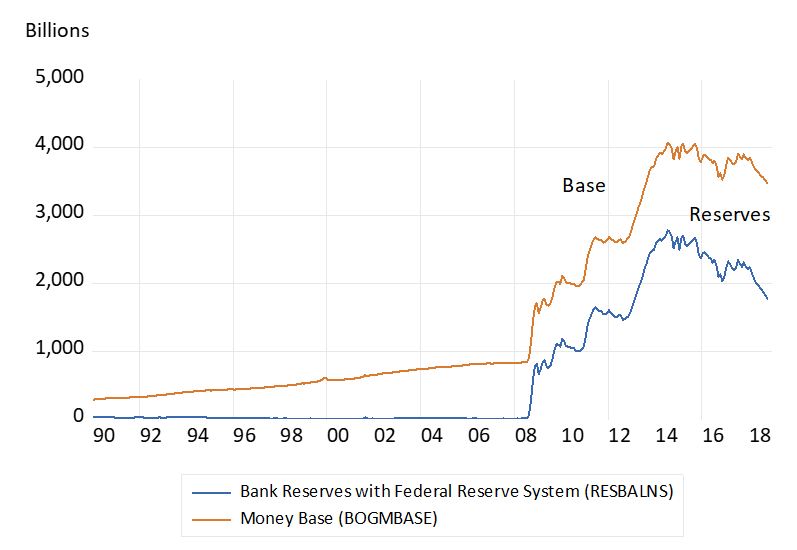
Source; The Federal Reserve Bank of St Louis (FRED) and Investec Wealth and Investment.
The demand for cash reserves by banks in the US increased as rapidly as did the supply of cash after 2008. By holding much more cash as a reserve against their deposit liabilities, the multiplier accordingly collapsed. The more cash the banking system holds the smaller will be any money multiplier. If the banks kept a 100% cash reserves to deposit ratio there would be no multiplier and no danger of a run on banks. But if 100 per cent cover of its deposit liabilities were demanded of banks so there would be no banks as we currently know them. That is banks that take deposits, transfer and receive them at the depositors instructions, and make loans utilizing and leveraging their deposit base to do so.
The quantity theory of money. Did it survive the test of QE?
The unpredictable increases in the demand for cash after 2008 may have disproved the quantity theory of money (QT). That is the based on the observation of many an episode in monetary history that an increase in the supply of money will lead, with variable lags, to proportionately higher prices. This has not happened if the supply of money in the US and elsewhere is defined narrowly – as central bank notes and private bank deposits with it.
But M2 in the US grew much more slowly than the money base. And so the defence or rejection of the quantity theory between 2008 and 2019 will depend on the definition of the money supply. If it is defined narrowly, the QT failed the recent test. If money in the US is defined more broadly to include deposits (M2) the QT can be said to have held up rather better. Since 2008 growth in the US money base has averaged 17.6% p.a, growth in M2, 6.2% p.a and inflation has been 1.8% p.a on average. (see figure below)
Fig.4; US annual growth in money base, money supply (M2) and consumer prices (Monthly data)
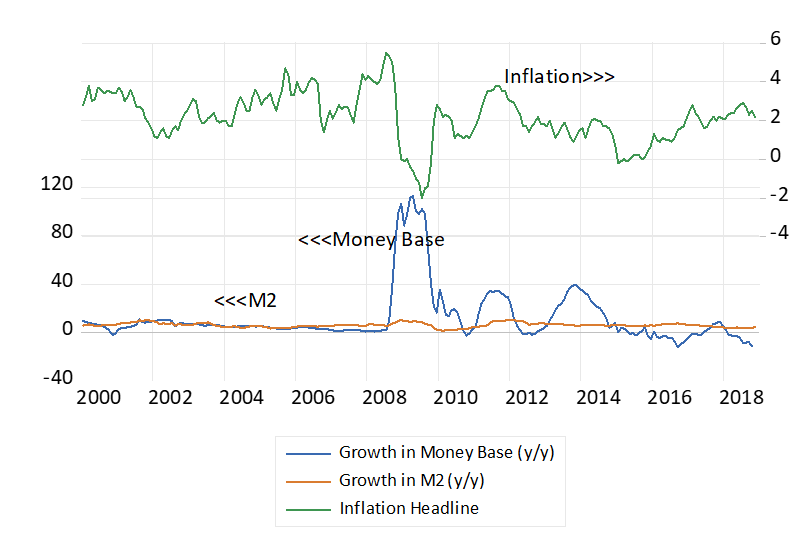
Source; The Federal Reserve Bank of St Louis (FRED) and Investec Wealth and Investment.
There is a very important difference between central bank and private bank money. The central bank – as an agency of the government- can create wealth by creating, printing money (cash) at close to zero cost. This additional supply adds immediately to the wealth of those holding the additional money supplied. But if the quantity theory of money holds, this extra wealth will be dissipated as prices rise. The monetary stimulus to spending becomes a temporary one until prices have risen in the same proportion as the money supply.
Prices will rise when the money is spent rather than held idle. It is the banks extra demands for idle cash reserves after 2008 that has meant not much more bank lending in the US and the spending associated with more lending. We show the differences in the growth rates of the US money base and M2 and consumer prices in figure 4.
It is changes in the supply of money and bank credit that matter – not the amount of money demanded and supplied.
It is not the level of the money supply, defined narrowly or broadly, or the size of the multiplier that can pose an inflationary threat to an economy. It is changes in the supply of money that can threaten inflation, or indeed deflation, should the money supply contract or grow more slowly than the output of goods and services. Usually the source of an inflationary increase in the supply of money will be the role played by government. Governments have the power, exercised through their central banks, to create “print” money that economic agents will accept. They may create money to fund their spending- as an alternative to raising taxes or competing fairly in the market for savings to help fund their budgets. They do so by forcing the central bank to make loans to the government that when utilized by government agencies end up as additional deposits made by customers of the banking system and as additional deposits held by the banks with the central bank. The money-multiplier gets to work with the injection of central bank cash into the system This increase in the money supply so created to initially serve a spendthrift government can be very rapid indeed. Rapid enough to induce hyper inflation as monetary history reveals.
The banking system, on a much more moderate scale, can contribute to money and credit creation by reducing their own demand for cash reserves in order to provide more credit. They may be able to borrow cash from the central bank to fund a larger loan book. They may lend, more or less, by lowering or raising their lending standards. Such developments deserve close attention by any central bank attempting to moderate the business cycle. But banks cannot create or have access to more central bank cash, unless the central bank agrees to supply them with more cash.
The necessity to keep a cash reserve limits the potential size of the money multiplier. And the central bank controls the supply of cash or perhaps more accurately the terms upon which cash is supplied to the banking system. An unlimited increase in the money multiplier or in the money supply cannot occur without government or central bank complicity. Banks cannot perpetuate inflation or deflation on their own- that is without the active involvement of a central bank.
Protecting a payments system from the danger of a breakdown
The challenge to the economy is how the payments system can be rescued and be expected to be rescued without encouraging the banks to take on undue risks with their lending and leverage that can eventually threaten the solvency of banks and the survival of the payments system. That is how can the rules that govern banking can help to avoid the temptation known as moral hazard. Or in other words encourage bankers to seek the rewards that may come with risk taking without depositors, shareholders and the bank management paying enough attention to the dangers of failure.
Insuring depositors against any losses they may incurr following a bank failure is in itself a kind of moral hazard. It relieves depositors from having to choose carefully between different banks to hold their deposits safely and thereby encourage banks to act responsibly- in order to attract deposits.
It is vital that the shareholders in a failed or recued bank must lose and expect to lose all their capital in their bank if it fails. Or be willing to raise additional equity capital enough to meet the claims of their creditors to keep the bank a growing concern. Such fears of loss would normally encourage a bank to manage the risks of non-performing loans with great care. As it would all the other creditors of a bank – including other banks that might be a source of funding.
If shareholders are unwilling or unable to recapitalize a failed bank the government can take over the bank and provide enough fresh capital to keep it and the payments system going. The government can realistically hope to recover its investment in due course. The rescue operation conducted for US banks included infusions of equity capital as well as cash. The recovery of its banks and insurance companies has meant good returns for tax payers money invested by the government- as might have been expected.
Any well governed banking and financial system needs a well-designed (legislated for) process that can be called upon on declaration of a financial emergency. The discretion to do so must be part of executive authority provided in advance. It must include well designed bankruptcy proceedings for banks that can be instituted at short notice. And they should include the certain prospect that shareholders and debt-holders and even bank executives will suffer significant losses should any emergency have to be declared. Claw backs of bonus payments made earlier to managers could be a further deterrent to excessive risk taking. Any certainty of how the system can and will react to the potential danger of a banking and payments shut-down itself will help secure the system. It should not be beyond our wit to design a financial rescue operation that hopefully will not need to be called upon. The best laws are those that are self-enforcing. Cricketers are very unlikely to be given out hitting the ball twice. They just don’t do it.
Safety does not come without a cost
Additional regulations forcing the banks to hold more equity capital as cover for their assets have been widely instituted. Forcing creditors of banks to accept in advance the possibility of a hair cut on the value of their loans to banks – or the compulsory automatic conversion of outstanding loans into equity- should a bank be unable to meet its obligations – can make banks safer. But avoiding the risks banks might otherwise take will inevitably reduce their expected returns and the useful lending role they might otherwise play in the economy.
Mervyn King would have banks hold a significant proportion of safe assets held in some kind of escrow account that can be sold off automatically should a bank have to be rescued. The problem with all such regulations designed to inhibit risk taking may reduce the profitability of banking enough to force banks out of business. Regulations that reduce profits – returns and risk – have a trade-off – it means less of what could be useful economic activity. The economy depends on its financial intermediaries as much as the owners and managers of financial institutions of all kinds – depend on a healthy economy.
Tolerating the discipline provided by market forces with back up in the form of credible and politically acceptable rescue plans for when markets fail- as they do occasionally and unpredictably – may be the right approach. Rather than introducing apparently fail-safe regulations and have undesirable consequences in the form of too little rather than too much credit supplied. It needs to be recognized by the broader society that financial crises may well happen but that we will know how to deal with them.
Will technology provide us with a very low cost fee based payments system that does not have to be combined with leverage?
Technology may be coming to provide a fee paying, low cost payments system that can be provided independently of any lending and borrowing and the interest spread and risks that come with leverage. Pure transactions ‘banks” that cover transactions balances with 100% cash reserves- held with the central bank- and that charge fees high enough to cover all costs, including a return on the capital invested, may change the nature of banking as we know it. And avoid any danger that the payments system can fail.
This brave or rather more cautious new world may be the next wave in the evolution of a financial system. That is provide for the separation of the payments system from the dangers of leverage. It would make banking failures much less dangerous than they now are because the payments system would survive. Wisdom would be to let the profit seeking competitive financial system evolve in response to the preferences of lenders and borrowers and for regulators to stay out of the way. Other than to design a predicitable rescue operation- that could be called upon in extremis – to save the payments system – not lenders or borrowers from the consequences of their own follies.
Mervyn Allister King, Baron King of Lothbury, KG, GBE, DL, FBA (born 30 March 1948) is a British economist and public servant who served as the Governor of the Bank of England from 2003 to 2013.
Born in Chesham Bois, Buckinghamshire, King attended Wolverhampton Grammar School and studied economics at King’s College, Cambridge, St John’s College, Cambridge, and Harvard University. He then worked as a researcher on the Cambridge Growth Project, taught at the University of Birmingham, Harvard and MIT, and became a Professor of Economics at the London School of Economics. He joined the Bank of England in 1990 as a non-executive director, and became the chief economist in 1991. In 1998, he became a deputy governor of the bank and a member of the Group of Thirty.
King was appointed as Governor of the Bank of England in 2003, succeeding Edward George. Most notably, he oversaw the bank during the financial crisis of 2007–2008 and the Great Recession. King retired from his office as governor in June 2013, and was succeeded by Mark Carney. He was appointed a life peer and entered the House of Lords as a crossbencher in July 2013. Since September 2014 he has served as a professor of economics and law with a joint appointment at New York University’s Stern School of Business and School of Law.[2]
Naspers managers – how to play defence
There is a much better defence for the R1.6bn of employment benefits received recently by Naspers CEO Bob Van Dijk than that only R32m so far has been taken in cash, as Naspers has argued so extraordinarily. Try telling Steinhoff or Facebook shareholders that they have not in fact made a loss until they cash out, or for that matter inform Naspers shareholders who have held on to their shares that they paid R300 a share for in early 2010, now worth over R3000, that they are not now much better off.
The defence I would make on behalf of Naspers managers is that the difference between the market value of Naspers and the market value of its stake in Tencent and other listed entities has narrowed sharply, to the clear benefit of Naspers shareholders. This difference between the value Naspers and the value of its stake in Tencent has been widening almost continuously since 2014 and was as much as R800bn in early 2018. It has recently however halved to about R400bn.

I would argue that such an improved rating in the market is to the credit of the Naspers managers. Clearly they have very little ability to influence the market value of its stake in Tencent, by far its most important asset. Were they to have done nothing but hold their 30% plus stake in Tencent, their shareholders would now be R400bn better off.
But the Naspers managers have done much more than this. They have undertaken a very active and ambitiously expensive investment programme. They have invested the growing flow of dividends they receive from Tencent into this programme and have raised much extra equity and debt capital in order to fund their investments.
Given the difference between the value of Naspers and the value of its listed assets (overwhelmingly Tencent) it is clear that the market place has a very poor regard for the ability of this investment programme to add value for shareholders. That is to say, to earn returns from it that will exceed the returns shareholders could realise for themselves if the cash derived from Tencent were distributed to them. And the extra equity or debt capital had not been raised on their behalf. The share market expects Naspers to lose rather than add value with its investments and ongoing business activity. Hence the company is valued at much less than the sum of its parts. But the value gap has closed significantly recentl,y for which management deserves credit.
The difference between the market value of its assets net of debts and the market value of Naspers itself can be attributed to one of three essential forces and judgments of them. Firstly, and surely the most important influence, is the expected net present value (NPV) of its investment programme. That is the market’s negative estimate of the difference between what the (large) sum of capital expected to be allocated and the value to shareholders these investments (however funded) are expected to deliver. All such estimations will be calculations of expected present values – that is estimates of cash out and cash expected to flow back to the company in the future, with all such flows discounted with the appropriate discount rate or cost of capital to repreasent the opportunity cost of the investments.
Ideally the expected NPV would have a positive value. In the case of Naspers, given the R400bn value gap, the estimated NPV can be presumed to register a large negative number. Though this pessimism about the value of the investment programme may not be the only drag on the market value of Naspers. The expected cost to shareholders of maintaining the Naspers head office – including the benefits provided to its CEO in cash or in shares or in options on shares – also reduces the value of a Naspers share- as it does for all companies.
A further factor adding to the gap between the sum of parts valuation and the market value of a holding company might be differences between the book or directors’ value attached to unlisted investments by the holding company and the market’s perhaps lower estimate of their value. Listing the assets and/or unbundling or disposing of them may prove that the market had been underestimating their value, and so help to close the value gap.
All these value adding or destroying activities (including deciding how much to reward themselves) are the responsibility of the senior managers and the directors of Naspers. It would appear that, in the opinion of the market place, their recent efforts in these regards have been more rewarding for shareholders, some R400bn worth. It’s the result, perhaps, of a more disciplined approach to allocating fresh capital that the market place has appreciated. It may reflect the more favourable market reaction to a more predictable, less dilutive approach taken by managers to rewarding themselves with additional shares. And also perhaps by a greater apparent willingness to list and sell off subsidiaries capable of standing on their own two feet.
We would suggest to Naspers that incentives provided for managers in the future be based upon one critical performance measure: closing the gap between the sum of parts value of Naspers, that is its NAV and its market value. Shareholders would surely appreciate such an alignment of interests. 30 July 2018

Making sense of the earnings and dividend cycle
The JSE earnings and dividend cycles – a May 2018 update. What the market may be telling us
The growth in reported JSE All Share Index earnings per share appear to have peaked. The year on year growth in earnings have fallen back from the 30% rate realised in late 2017 to the current rate of 10% realised by the May 2018 month end. Index dividends per JSE share were growing at a 20% annual rate at the May month end. A time series forecast of both earnings and dividends suggests that their growth will slow down to less than 5% in the next 12 months.

The resource companies listed on the JSE have grown their earnings and dividends more rapidly than the other sectors over the past year – off a lower base. Resource earnings in January 2017 were 34% down on earnings the year before, while All Share Index earnings were 15% lower in January 2017 than in January 2016.
We show some of the trends in sectoral earnings growth rates in figure 2 below. Industrial Index earnings were trending higher at a 19% a year rate by May 2018, Banks at a 7% rate while the General Retail Index earnings per share were declining at a 3% rate. Resource earnings were trending at a 34% rate in May 2018 – though well down on the peaks of 80% growth realiised in late 2017.

When calculating an earnings cycle the base effects- what happened a year before – is important for current growth. It is much easier (more difficult) to realise high (low) rates of growth when growth was subdued (or buoyant) in the same month the year before. Perhaps it is more helpful when interpreting the performance of listed companies and the values attached to them to examine the level of rather reported earnings.
Perhaps even more illuminating about the state of play on the JSE would be to examine the level of earnings or dividends in constant prices, as we do in figure 3 below.

Real dividends have outpaced real earnings – they are now close to peak real dividends of 2014, while real earnings are still well below real earnings realised before the global financial crisis and recessions of 2009. This is surely a very sobering statistic- it shows that the real earnings front of the JSE have moved backwards since 2006.
The movement of the JSE since 2000 therefore appears to be better explained by dividends than earnings. Were it not for the stellar performance of Naspers, a play on Chinese internet firm Tencent the JSE All Share Index, in which Naspers has comprised an ever more important weight, would have fallen back.
It would appear that JSE-listed companies have performed better than the SA economy. They have accordingly returned relatively more cash to shareholders, presumably for want of investment opportunities. A corollary is that had they invested more of their cash in South Africa, the economy would have performed better. However it is unrealistic to expect capital expenditure of business enterprises to lead household spending (accounting for 60% of all spending in SA) that has remained consistently depressed by the standards of the past.
In figure 3 above we compare real JSE Index earnings and dividends with the real value of the JSE. The All Share Index seems better explained by the upward trend in real dividends than the sideways move in real earnings. We can confirm this by regression analysis. An equation that links the nominal value of the JSE All Share Index with the contemporaneous level of reported dividends and short term interest rates provides a good statistical fit. Indeed the current level of the JSE is almost precisely as would be predicted by this valuation model. When we add the rand value of emerging markets (EM) generally as an additional explanation of the level of the JSE – we get an even better fit. The R squared rises from 94% to 99% with all the explanatory variables attaining highly significant and plausible values.

This provides for the conclusion that the JSE may be slightly undervalued by the standards of the past, given the level of the EM benchmark that the JSE has lagged behind. Perhaps giving a degree of safety to the JSE at current levels. Yet as before, the strength of the JSE will depend upon the flow of dividends, interest rates, the value of the rand and the level of the EM benchmark that the JSE always tracks closely.
We could add as a further important influence the value of Information Technology stocks worldwide that Naspers will follow closely. Perhaps it is easier to be confident about the supportive role to be played by the EM benchmarks and the role of IT within them, than the benefits a stronger rand and accompanying lower interest rates could bring to the flow of dividends and earnings from the JSE All Share Index. The strong dollar and therefore the weaker rand and the more inflation that will follow it has become a headwind for the SA economy and the companies dependent on it. 5 June 2018
The Tencent effect
A good day for Naspers shareholders. Dare they hope for Tencent-like performance in the future?
Naspers had a very good day yesterday. It ended up over 5% in rands and almost as much in US dollars. It took the JSE higher with it thanks to its large size and share of the JSE by market value (approximately 20% of the All Share Index). Demand for Naspers shares from abroad may even have helped the rand recover on the day. The JSE All Share Index ended up by 15%. Naspers is now worth approximately R1.4 trillion.
The reason for this renewed enthusiasm for Naspers shares was a surprisingly good set of results from Hong Kong-based Tencent – reported after the Hong Kong market closed. Tencent is currently up by 6% in New York. Naspers has a 31.01% share of Tencent worth approximately R2 trillion at the close of trading on the JSE the day before. Naspers understandably rises and falls on a daily basis with the value of Tencent – though not necessarily to the same degree.
That is because there is more to Naspers than its stake in Tencent. We show in the figure below that the market value of Naspers has trailed behind that of Tencent, when both are measured in US dollars. Tencent is up 12 times since 2010 and Naspers has added (only!) about six times to its 2010 value.
Tencent and Naspers have also outperformed the S&P 500 Information Technology sector that includes all the big names in US technology stocks (the famous FAANGS) Facebook, Apple, Amazon Netflix, Google (Alphabet) to which Microsoft could be added, another superb IT company. On a day-to-day basis there is also a highly correlated movement between Tencent and the S&P Information Technology Index. Tencent and Naspers are high beta plays on global IT, but with significant alpha to add to returns.
Yet Naspers, while worth R1.4 trillion, is valued at significantly less than its stake in Tencent. Naspers furthermore has other assets – as well as debts and cash – that would add further to the difference between the sum of Naspers’ parts – its net asset value (NAV) and its market value. This difference between what Naspers would be worth if broken up and sold off and what it is worth as a going concern is a mammoth R700bn. Put another way, the Naspers management, while to be congratulated on their decision to invest in Tencent in the early 2000s, could possibly be accused of wealth destruction elsewhere. Everything else that it has done, other than invest in Tencent, has reduced the wealth of its shareholders.
Naspers conducts a very large investment programme, investing far more than the cash it has received as dividends from Tencent – US$248m in 2017. According to David Smith of Investec Securities, Naspers injected net cash into its ventures of US$3.43bn in 2014, US$1.43bn in 2015 and US$1.98bn in 2016. In 2017 it extracted cash (reduced debts) by US$1.8bn.
Recently Naspers enjoyed a major success when it sold its stake in Flipkart – an Indian internet company for US$2.2bn, realising a gain of US$1.6bn, or a rate of return of about 21% p.a. over six years and for about 30% or US$500m more than the market had thought it was worth. Clearly value adding but not as value adding as the 41% p.a. returns generated by its investment in Tencent over the same period.
The proceeds of this sale, as well as the R10bn received from reducing the Naspers share of Tencent to 31%, has since been added to the Naspers cash pile. Were investors of the view that this cash could produce cost of capital-beating returns of the Flipkart kind, the market value of Naspers would benefit and the gap between NAV and market value would narrow. Or equivalently, Naspers could then perform more closely in line with Tencent.
But this appears not to be the case. The market appears of the view that the stronger the Naspers balance sheet, the more its stake in Tencent is worth and the more cash it has to invest, the more it will be inclined to invest in ventures that destroy value for shareholders. That is to say, the cash invested by Naspers is expected to earn less than if the cash were returned to shareholders and invested by them. The large difference between NAV and the market value of a Naspers share reflects in part the losses expected to be incurred in the investment decisions the company will make in the future. The market value of Naspers is set lower to compensate shareholders for this danger that their capital will be wasted on a large scale. Only a lower Naspers share price can then offer market equaling returns; hence the gap between NAV and the market value.
A further reason why Naspers has lagged behind Tencent is that Naspers has issueda large number of shares. Shares have been issued not only to fund its investment programme but also to reward its managers. There were 290.6m Naspers N (low voting) shares in 2006. By 2017 this had grown to 431.5m shares in issue, an increase of 48%. Between 2012 and 2017, Naspers issued an extra 46.8m shares with 58% of the new issues going tp staff compensation. Tencent by contrast has issued very few shares over the years. Clearly the value of a Naspers share reflects in part the danger of further dilution of this order of magnitude.
Naspers could add market value and close the value gap by adopting a more disciplined approach to its investment and incentive programmes and convincing investors that it would do so. In other words, to quote its one time MD and now chairman, Koos Bekker, to throw less spaghetti at the wall so that perhaps more will stick. And to align the interests of managers and its shareholders by rewarding both in some proportion to a reduction in the absolute gap between the NAV and market value of Naspers.
Perhaps some progress in this regard is being made. This year the performance of Naspers and Tencent has been better aligned – as we show below and is reflected in a more stable ratio Naspers/Tencent over recent months. Shareholders in Naspers will hope for more of this more comparable performance. 17 May 2018
The reality of state-owned companies in SA
The Budget Review for 2018-19 informs us that “in cases where state owned companies are making large investments in infrastructure, capital expenditure reduces profitability. Even after these investments are paid for, profitability is unlikely to match private-sector profit rates because these entities often provide public goods and services below the cost of production to enable economic activity……”
Capital expenditure whenever properly managed should be a source of improved profitability and returns rather than of additional waste. Moreover, the requirement a government might make on any enterprise to subsidise some of its customers can be paid for directly and transparently by the government, that is taxpayers. There is an obvious distinction between public enterprises able to charge for their services and public works – as in supplying rural roads – where charges cannot be levied in any realistic way to cover costs.
The Review goes on to tell us (that) “in many cases, however, falling profitability reflects mismanagement, operational inefficiencies and rising financing costs. Over the medium term, state-owned companies need to raise their returns to generate value, and to reduce their reliance on debt and injections from the fiscus”. (2018 Budget Review p 96)
A combined balance sheet of state-owned companies provided in Table 8.2 of the Review indicates how poor the financial performance has become over the years. The combined total assets of these companies totalled R1 225.2bn in 2016-7. Total liabilities (debts) were R869bn. The net asset value or equity of the companies fell by 1.5% in the last financial year and the average return on equity was a mere 0.3% or about R10m. Adding back interest on the liabilities, at say 10% a year, would give them earnings before interest and taxes (also paid to the state) of approximately R97m and so a return on assets of less than 8%, less than the interest cost.
This begs the question as to why they are publicly funded in the first place. It is not because they may provide public goods. They might have been founded – backed by the taxable capacity of the nation – because at the time private capital (correctly so) would not have been willing to undertake the risks involved. There may have been strategic or nationalistic objectives that taxpayers had to accept. Such constraints on the availability of private capital sourced globally to fund SA infrastructure have long since gone. Private capital would fund the essential SA infrastructure on favourable, market-determined terms provided they could be satisfied with the terms and conditions.
This could take the form of government (taxpayer) guarantees for well ring-fenced projects with clearly earmarked revenue streams, as with the so intended infrastructure bonds. A much better deal for the tax payers of SA guaranteeing the leasing charges would be private ownership and management of these assets, with these companies broken up and sold off. Ports and pipelines can be separated from railways and compete with each other and the generation of electricity by a number of independent power producers could be separated from its distribution. Partial private ownership or private-public partnerships of various proportions might also attract private capital. But without private sector control of the performance of the managers, workers and their remuneration, the efficiency with which the infrastructure is operated and expanded is unlikely to improve.
The reason for the state-owned companies to remain state-owned has little to do with efficiency. It is the political influence of the managers and workers that have kept them so. The have been able to defend their superior employment benefits at the expense of taxpayers and customers. This largesse has brought the system into disrepute and strained the ability of taxpayers to keep the gravy train running. We must hope for reforms of the essential kind that change the goal of the managers of these companies from serving themselves to serving their owners. By doing so they would relieve taxpayers from the risks they now carry and help their customers for whom they would compete, and help the economy to grow faster. 1 March 2018

The Investment Holding Company. How to understand the value it adds or destroys for its shareholders and how to align the interests of its managers and shareholders.
This report has been written with the managers of Remgro, an important Investment Holding Company listed on the JSE, very much in mind. Their managers having received a less than enthusiastic response of their shareholders to their remuneration policies, the company engaged with shareholders on the issue. An action to engage with shareholders that is to be much welcomed.
I have given much thought and written many words explaining why investment holding companies usually worth less than the value of their assets less debt they owned, why in fact they sell at a discount to their Net Asset Value. It occurred to me, as a Remgro shareholder in response to the invitation from the Remgro managers, that my approach could be used to properly align the behaviour of the managers of Remgro with their shareholders. I then engaged with other shareholders in a Remgro webcast and offered to extend my analysis- an offer that was respectfully accepted. This is the result
Applying the logic of the capital market to the managers of companies that invest in other companies
The managers of companies or agencies that invest in operating companies – be they investment holding companies or unit trusts or pension funds –should be judged by the changing value of the share market and other opportunities they invest in. Their task is to earn share market beating risk adjusted returns. They can only hope to do so by accurately anticipating actual market developments. They can do so anticipating the surprises that will move the market one way or another and allocating capital accordingly in advance of them.
The managers of a listed investment holding company, for example a Remgro, a PSG, a Naspers in South Africa or a Berkshire-Hathaway, the most successful of all Investment Holding Companies listed in New York, unlike the managers of a Unit Trust or Mutual Fund, are endowed with permanent capital by shareholders. Capital that cannot be recalled should shareholders become disillusioned with the capabilities of the managers of the holding company. This allows the managers of the HC to invest capital in operating companies for the long run, without regard to the danger that their shareholders will withdraw the funds invested with them- as can be the case with a Unit Trust.
A Unit Trust always trades at values almost identical to the value of the assets it owns, whether funds are flowing in or out or its value per unit has declined or increased- of great relevance to unit holders. This is because these assets can and may have to be liquidated for what they can fetch in the market place.
This is not the case with an Investment Holding Company (HC) The HC cannot be forced to liquidate assets if its shareholders lose confidence in the ability of its managers to beat the market or meet the expectations of shareholders. Therefore the value of the HC shares will go down or up depending on how well or poorly the shares of the holding company are expected to perform relative to the other opportunities available to investors in the share market.
The price of a HC share will be set and reset continuously to satisfy the required risk adjusted returns of potential investors. A lower share price will, other things equal, compensate for any expected failure of the HC to achieve market beating returns through its holdings of assets and its ongoing investment programme. Vice versa a higher HC share price can turn what are expected to be excellent judgments made by the HC, into merely normal risk adjusted returns. In this way through changes in share prices that anticipate the future, the outstanding managers of any company, be it an operating company or a HC that invests in operating companies, that is capable of earning internal rates of return that exceed their costs of capital, will only provide their shareholders with market related returns. Successful companies expected to maintain their excellence charge a high entry price in the form of a demanding share price. Less successful companies charge in effect much less to enter their share registers. Expected returns adjusted for risks therefore tend to be very similar across the board of investment opportunities.
This makes the market place a very hard task master for the managers of a company to have to satisfy. Managing only as well as the market expects the firm to be managed will only provide market average returns for shareholders. And so the direction of the market will have a large influence on share price movements over which managers have little immediate influence. Better therefore to judge the capabilities of a management team by the internal returns realised on the capital they deploy – not market returns.
The managers of the holding company must expect that the operating companies they invest in, are capable of realising (internal) returns on the capital they invest that exceed the cost of capital provided them. That is capable of realising returns that exceed their required risk adjusted returns.
These potentially successful investments may be described as those with positive Net Present Value or NPV. If indeed this proves so, and the managers of subsidiary companies succeed in their tasks, the managers of the HC must hope that the share market comes to share this optimism in their ability to find cost of capital beating investment opportunities. This would add value to the HC whose shares will reflect the prospect of better returns to come from the capital allocated to subsidiary companies in their portfolio. Other things equal, the more valuable their subsidiary companies become over time , the greater will be the value of the HC.
Past performance may only be a partial guide to future performance
Past performance, even a good track record, a record of having found cost of capital beating investment opportunities, may only be a partial guide to future success. The capabilities of the holding companies’ managers to add further value by the additional investment decisions they are expected will be under continuous assessment by potential investors in its shares.
Therefore the market’s estimate of the Net Present Value of the investment programme of the holding company can have a very significant influence on its market value. This value will depend on the scale of the additional investments expected to be undertaken by the HC , as well as the expected ability these investments to realise returns – internal rates of return on capital invested, (irr)– in excess of their costs of capital or required risk adjusted returns.
These expectations will determine the market’s assessment of the NPV of the investment programme. If the irr from the investment programme is expected (by the market place) to fall short of the cost of capital, then the NPV will have a negative value- a negative value that will be in proportion to the value destroying scale of the investment programme. If so the investment programme will reduce rather than add to the market value of the holding company.
The difference between the usually lesser market value of the holding company and the liquidation value of its sum of parts – its NAV – will reflect, we argue, mostly this pessimism about the expected value of their future investment decisions. A lower share price paid for holding company shares compensates for this expected failure to beat the market in the future – so improving expected share market returns.
How managers of the holding company can add to its market value
That an investment holding company may be worth less than the value of the assets it owns is a reproach that the managers of holding companies should always attempt to overcome. They can attempt to do this by making better investment decisions, positive NPV decisions, and convince potential shareholders that they are capable of doing so. They can also add to their value for shareholders by exercising supervision and control over the managers of the subsidiary companies, listed and unlisted, they hold significant stakes in and therefore carry influence over.
They may be able to add to their market value by converting unlisted assets, whose true market value can only be estimated, into potentially higher valued listed assets with an objectively determined market price. They may also succeed in adding value for their shareholders by unbundling listed assets to shareholders when these investments have matured. This would mean reducing the market value (MV) of the holding company but also its NAV and so possibly narrow the absolute gap between its MV and NAV.
Increases in the market value of the listed assets of the holding company adds strength to its balance sheet. Such strength may encourage the managers of the holding company to raise more debt to invest in an expanded investment programme. This extra debt raised to fund a more ambitious investment programme can only be expected to add market value if the returns internal to the holding company exceed its cost of capital. If it is not expected to do so, these investments and the debt raised to fund them will reduce rather than add to NPV. The influence of the NPV estimates on the value of the holding company will however depend on scale of new investment activity compared to the size of the established portfolio. The greater the risks additional acquisitions imply for the balance sheet, the greater will be the influence of the NPV calculation.
A further influence on the value of a holding company will be the costs of maintaining its head office and complement of managers employed at head office. Clearly the net expenses of head office- costs less fees earned from subsidiary companies will reduce the value of the HC.
Our view is that the difference between the value of the holding company and the assets it has invested shareholders capital in is the correct measure of the contribution of managers to shareholder welfare. Hence improvements in the difference between the market value of the holding company and the market value of the assets it has invested in (it may be a negative number) should form the basis with which their managers should be evaluated and remunerated.
A little mathematics to help make the points
In the analysis offered below we support these propositions by identifying, using the logic of algebra, the forces that influence the market value MV as well as the NAV of an investment holding company and the differences between them.
A conventional calculation is made of the Net Asset Value (NAV) of the holding company as the sum of its parts- the sum of the market value of its assets less its net debts.
The NAV of a holding company is defined as
NAV = ML+ MU- NDt …………………. (1)
Where ML is the market value of its listed assets, MU the assumed market value of its unlisted assets less its net debt – debts-cash (NDt) held at holding company level. MU will be an estimate provided by either the holding company itself or independently by an analysis making comparisons of the market value of the holding company with its sum of parts, its NAV. Any difference between the valuation of unlisted assets included in NAV and the market value accorded to such assets by investors in the holding company (a valuation that cannot be made explicit) will have consequences as will be identified below.
The market value (MV) of the listed holding company is established on the stock exchange and can be assumed to be the sum of the following forces acting on its share price and market value
MV=ML+MUm-NDt+HO+NPV………………………… (2)
Where ML is again, as in equation 1, the explicit market value of the listed assets, MUm is the market’s estimate of the value of the unlisted assets that may or may not have a value close to that of the MU included in NAV in equation 1. NDt is the sum of the holding company debt less cash, also as in equation 1, recorded on the balance sheet of the holding company. HO is the cost or benefit to holding company shareholders of head office expenses, including the remuneration of head office management and other employees, less any fees paid to head office by the subsidiary companies for services rendered. HO would usually be a net cost for shareholders in the holding company and if so would reduce the market value of the holding company.
The final force in determining the market value of any holding company is NPV as discussed previously. NPV is defined as the present value attached by the share market to the investment programme the holding company is expected to undertake in the future. The more active this expected investment programme and the larger the programme – relative to the current composition and size of the holding company balance sheet, the more important will be the value attached to NPV. Furthermore it should be recognised from equation 2 that the scale of the investment programme, relative to the size of the established portfolio of listed and unlisted assets will determine how much the dial, so to speak of market value, moves in response to NPV.
Were the holding company managers be expected to undertake investments, be they acquisitions or greenfield projects, that returned more than their cost of capital, this would reflect in a positive NPV. That is to say the greater the (expected) spread between realised and required risk adjusted returns, the greater will be the value attached to NPV for any given (estimated) monetary value attached to the investment programme. However, as discussed previously, the holding company may be expected to be unable to find cost of capital beating investment opportunities. If so NPV would have a negative value and the more the holding company were expected to invest in new projects, the larger would be the negative value that will be attached to NPV. A negative value accorded to NPV would clearly reduce the market value MV of the holding company as per equation 2.
The success or otherwise of the ability of the holding company to add value for its shareholders can be measured as the difference between NAV, net asset value, the sum of parts, and the market value (MV) of the listed holding company or
Value Add= NAV-MV …………………. (3)
It should be noted in the formulation of equation 3, that NAV is presumed to be larger than MV. This is a usual feature of holding companies that are usually worth less than their sum of parts. This negative value is often expressed as a percentage discount of NAV to its market value- as defined below in equation 5.
If we substitute equations 1 and 2 into equation 3 the forces common to the determination of market value (MV)and NAV in equations 2 and 3 that is MU, Net Debt, Debt less cash, cancel out and we can conveniently write the difference between NAV and MV as simply
(NAV-MV) = – (NPV+HO- (MU-MUm))…………………… (4)
It will be noticed that the higher the absolute value of NPV the smaller the difference between NAV and MV. Were however the NPV to attract a negative value the variables on the right hand side of equation 4 would (other things held constant) take on a positive value and increase the difference between NAV and MV. Other forces remaining unchanged, head office expenses and differences between the estimate of the value of the unlisted assets included in NAV and its “true” unobservable value will also narrow the difference between NAV and MV.
The net costs of head office (HO) as mentioned, is likely to have a negative value for shareholders, as would any overestimate of the value of the unlisted assets. If so, to have MV exceed NAV and so for the holding company to stand at a premium rather than a discount to its NAV, the NPV would have to attain enough of a positive value to overtake these other negative forces acting on MV.
A further value add indicated in equation 4 would be to narrow any difference between the value of the unlisted assets included in NAV and its true market value, which cannot be directly observed. Listing these subsidiary companies may well serve this purpose. It will provide them with an objectively determined value that may well exceed its lower implicit value as unlisted companies. If so this can add market value to the holding company.
It would seem clear from this formulation (equation 4) that for those holding companies with an active investment programme, the key to value destruction or creation, the difference between NAV and MV, will be the expected value of its investment programme (NPV) It would seem entirely appropriate for shareholders in the holding company to incentivise the managers of the holding company by their proven ability to narrow this difference and improve VA. Positive changes in VA- that is less of a difference between NAV and MV –that would take an absolute money value that can be calculated continuously – could form the basis by which the performance of the managers of the holding company are evaluated.
We have shown that much of any such improvement in the market value of the holding company and its ability to add value for shareholders should be attributed to improvements in NPV, a variable very much under the control of the managers of the holding company. The reduction of head office costs, or better debt management, or some reassessment of the value in the unlisted portfolio, is perhaps unlikely to significantly move the market value of the holding company.
Were the managers of the holding company able to make better investment decisions and more important perhaps, were expected to make better investment decisions, the market place would reward the shareholders in the holding company accordingly. Though further any contribution they might make to increase the market value of listed companies under their influence or control, could also help reduce the difference between NAV and MV, as we will demonstrate further.
Investment analysts give particular attention to the discount to NAV of the holding company. The notion is that there is will be some mean reversion of this discount and so an above average discount may indicate a buying opportunity and the converse for a below average discount. This discount is defined as
(NAV-MV)/NAV % …………………………………………… (5)
This notion of a (normal) positive discount is also consistent with the notion as indicated previously that the NAV usually exceeds MV. If we divide both sides of equation 4 by NAV and substitute the components of NAV in the denominator we derive the positive discount to NAV as
Disc%=- (H0+NPV-(MU-MUm))/(ML+MU-NDt) …… (6)
As may be seen in equation 6, if the combined value of the numerator is a positive number, then the discount attains a negative value- that is the market value of the holding company would stand at a premium to the sum of its parts – Berkshire Hathaway might be an example.
Clearly any change that reduces the scale of the numerator (top line) or increases the denominator (bottom line) of this ratio will reduce the discount. Thus a less expensive head office (HO) or an increase (less negative) in the value of future business (NPV) will reduce the discount. (These forces represented in the numerator of equation 6 are preceded by a negative sign. As per the denominator, any increase in ML or MU or a reduction in net debt will reduce the discount.
However while reducing the discount is unambiguously helpful to shareholders and will be accompanied by an improvement in NPV, this will not always or necessarily be the result of action taken at holding company level. Any increase for example in the market value of the listed ML or unlisted investments MU will help increase the absolute value of the denominator of equation 6 and reduce the discount and add NPV. But such favourable developments may have everything to do with market wide developments that influence ML or MU and have little to do with the contributions made by the management team at holding company level.
Thus it is the performance of the established portfolio relative to some relevant peer group rather than the absolute performance of the established portfolio should be of greater relevance when the performance of the managers are evaluated. These influences on the value add might be positive or negative for the value add for which management should not be penalised or rewarded.
It would therefore be best to measure the contribution of management by a focus on the underlying drivers of NPV seen as independent of the other forces acting on the market value of the holding company. Furthermore the focus of the managers of the holding company and their remuneration committees should be on recent changes in the absolute difference between NAV and MV and not on the ratio between them.
Unbundling may prove a value added activity – the interdependence of the balance sheet and the investment programme- for which the algebra cannot illuminate.
Unbundling listed assets to shareholders might well be a value adding exercise. It would simultaneously reduce both NAV and MV, but possibly reduce the absolute gap between them. Because such action could illustrate a willingness of the management of the holding company to rely less on past success and to focus more on the merits of its on-going investment programme. Reducing the size and strength of the holding company balance sheet may make the holding company less able and so less likely to undertake value destroying investments. An improvement in (expected) NPV and so a narrowing of the difference between NAV and MV might well follow such an unbundling exercises to the advantage of shareholders. That is helpful to shareholders because even as the absolute size of the holding company’s NAV and MV decline, the difference between them may become less negative- even become positive should MV exceed NAV
Conclusion
We would reiterate that the purpose of the managers of the holding company should be to serve their shareholders by reducing the absolute difference between NAV and MV and be rewarded for doing so. A focus on this difference, hopefully turning a negative number into a (large positive one) would be highly appropriate to this purpose.
Appendix
Remgro: chart reflecting estimated difference between the market value of Remgro and our calculation of its net asset value
Source: Investec Wealth & Investment analyst model
Naspers: chart reflecting estimated difference between the market value of Naspers and our calculation of its net asset value
Source: Investec Wealth & Investment analyst model
US earnings and tax rates – a temporary conundrum
You may think that cutting company tax rates in the US from 35% to 21% of their earnings would boost after-tax earnings. But not so fast – while the longer run impact of the lower taxes will clearly benefit shareholders and employees, the immediate impact of a lower tax rate can significantly reduce, rather than improve the bottom line. This is the case with a number of the very large US banks reporting or about to report their latest results.
Citibank, according to the Wall Street Journal, is about to report a large loss for the final quarter of 2017. It will be making enough of a tax charge to its earnings – as much as US$20bn – for the bank to become loss making in 2017. Some of the other major US banks, for example JPMorgan, will also be deducting large sums (in its case $2.4bn) from its earnings as a once-off adjustment for lower tax rates to come. Wells Fargo by contrast was able to add $3.35bn to its earnings, as was another large bank, PNC, which added about 9c to its reported earnings of $4.18 a share.
The banks and firms that are able to immediately boost earnings have net deferred liabilities, some $2.37bn worth in the case of PNC. In the past, these provisions against future tax liabilities had been deducted from earnings. Now with lower tax rates, this reserve can be reduced and added back to earnings. JPMorgan and Citibank, by contrast, have on balance accumulated tax assets rather than liabilities. They include tax benefits to be realised in the future as an asset on their balance sheets. The accumulation of such potential benefits has boosted earnings over the years. At a lower tax rate, these assets are worth less when they are written off against current earnings.
Incidentally, the Journal article while commenting on the generally very favourable operating performance of the bank as a whole also reports a further charge to JPMorgan earnings, as follows:
“JPMorgan’s corporate and investment banking unit was weighed down by weak trading, slumping 17% to $3.37 billion after stripping out the tax-overhaul impact. It also was hit with losses as high as $273 million related to client Steinhoff International Holdings NV, which is dealing with a wide-ranging accounting probe that is expected to also dig into other large banks’ results.” (WSJ, Peter Rudegeair)
These important recent developments on the earnings front raise the issue about the usefulness for investors or operating managers of these heavily and frequently adjusted bottom-line earnings. Quarterly reported earnings cannot be regarded as a reliable measure of the long run potential of the companies reporting. Nor, since the definition of earnings has changed so much over the years, can these reported earnings be helpfully compared to earnings in the past, nor to historic share prices, in the hope that price earnings ratios will revert to some long run average.
But there is one measure of the performance of a company or of a stock market that has the same meaning and significance today that it has today as it did 50 or 100 years ago. That is the cash paid out to shareholders as dividends. Companies do not easily pay away real cash unless they are confident they can maintain such payments. As such their dividend payments constitute a very real measure of normalised earnings.
A comparison between S&P 500 Index earnings and dividends makes the point. As we show in figure 1 below, dividend flows are far smoother than earnings; smooth enough to be regarded statistically as well as for economic reasons as a normalised measure of earnings.

Of particular significance is that dividends survived the financial crisis of 2008 far better than earnings, as may be seen. Earnings in that period collapsed dramatically as all the failed loans and less valuable assets of the banks and financial institutions were written off earnings. Dividends held up relatively to earnings to reflect the future of US business rather than its immediate past.
And share prices since the crisis are much better explained by the flow of dividends than the flow of earnings. As may also be seen in figures 2 and 3, dividends payments by S&P 500 companies grew steadily between 2014 and 2016, even as earnings fell away sharply in 2014. This helped to support further improving share prices.
S&P Index dividends moreover have continued their steady advance even as earnings have rebounded very strongly, as the figure shows. Dividends since 2012, a period when the S&P Index gained an average 13% p.a., have grown on average by 10.5% p.a, while earnings grew by 3.5% p.a on average, with twice as much volatility. It would appear investors bidding up share prices were taking more notice of normalised than actual earnings, that is of the consistent growth in dividends.


As we show below the quite stable dividend yield on the S&P 500 is very much in line with its post-2000 average. This does not appear to indicate an overvalued market, especially when this dividend yield is compared to interest income which is the alternative to dividends. And lower tax rates will surely encourage US businesses to raise their dividend payments. 16 January 2018

The Naspers logic – getting our Tencent’s worth
The recent Naspers annual general meeting saw shareholders at serious odds with management about the value of their contribution to the company.
Amidst all the Sturm und Drang and misconceptions about how to measure the performance of the Naspers managers, some facts of the matter deserve proper recognition. Chief among these is that is Naspers managers are expected – emphasis on expected – to destroy shareholders’ value on an heroic (or is it a tragic?) scale.
To explain, were Naspers simply a clone of Tencent, that is the company did nothing but collect and distribute to shareholders the dividends it received for its 34.33% share of Tencent, it would be currently valued as is Tencent itself. Currently it would be worth close to R1.6 trillion. The current market value of NPN is much less than this, about R1.3 trillion, or a staggering near R300bn less than the value of its stake in Tencent.
The correct logical conclusion to come to about this fact is that the market expects the Naspers managers to destroy value on their behalf. In other words, the ambitious capital investment programme of Naspers is currently worth much less (on a net present value basis) than the capital NPN management is expected to deploy over the economic life of the company. To be more precise: worth some R300bn less than it is expected to cost. Why not liquidate all those investments and return the money to shareholders, which would surely close the gap?
Unfortunately for Naspers management, the market has recently become more pessimistic about the capabilities of the Naspers managers. In January 2017, the expected destruction of value was a mere R98bn compared to the current R300bn. It may be concluded that the better Tencent performs, and so adds to the balance sheet strength of Naspers, the more ambition and so the more value destruction the market expects from Naspers. (See chart below)
Independently of the success Tencent has enjoyed in the market place, in which Naspers shareholders share to only a lesser degree, given more value destruction expected, the recent operating performance of the Naspers subsidiaries gives very little cause for believing that their fortunes are about to turn around for the better. We rely here on the Credit Suisse HOLT lens for these observations. Naspers’s cash flow return on investment (CFROI) on its operating assets dropped from -3.6% in 2016 to -10% in 2017. In other words, the operating core of Naspers is destroying value by generating a return on capital far below its opportunity cost of capital. This is nothing new. CFROI has been dropping since March 2011.
The expense missing from every income statement is a charge for the use of shareholders’ equity. Equity is not free and no rational investor wants to give it away for nothing. If we apply a capital charge on the use of Naspers operating assets, its economic profit drops from -R6.2bn in 2016 to -R11bn in 2017. Consistent with these negative returns is that the growth in the sales of these operating subsidiaries has turned negative and the operating margins (expressed as an EBITDA percentage), which were well over 20% between 2004 and 2010, are now barely positive. In 2015 and 2016, the growth in Naspers assets, which includes cash but excludes Tencent and other associate investments, has been at an ambitious rate of over 40% p.a.
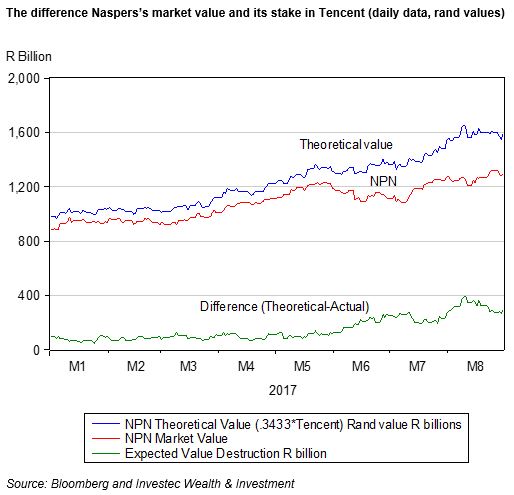
Naspers managers and its shareholders clearly have a very different view of its prospects. Time will tell who has the more accurate view of the capabilities of Naspers management. One would recommend however that the Naspers management put a time limit on their ability to prove the market wrong. If the market in five years continues to value Naspers as a serial value destroyer, its managers should be willing to cut its losses, by radically reducing its investment spending and to unbundle or dispose of its loss making subsidiaries. Any expectation that Naspers is willing to adopt a much more disciplined approach to its capital allocation would add immediate value for its shareholders. 1 September 2017
The avoidable risks Eskom assumes on behalf of all South Africans.
A shorter version published in Business Day is available here
The avoidable risks Eskom assumes on behalf of all South Africans.
The owners of Eskom (all South Africans) should be aware of the grave risks Eskom’s managers and directors have taken on their behalf. The risks that is to the value of the many billions of rands that have been deployed on their behalf building plant and equipment (PPE) to generate and distribute electricity.
The danger is that all this PPE may be worth much less than it cost. There is also the matter of servicing and repaying the over R300bn in debt that has been incurred funding these developments, much of it that is tax payer guaranteed. These debts are large enough to threaten the credit of the Republic itself, as has become apparent.
The essential, unsatisfactory nature of a state-owned business is only part of the problem, namely that the primary purpose of the business easily becomes that of serving the interests of its employees, from top to bottom. The interests of its customers and owners become secondary and are poorly served. However the main problem is when the operations are of such an order of scale that any mistaken investment programmes or operational failures become significant for the economy at large, as has become the case with Eskom.
The further danger is that the burden of these mistakes and servicing the debt incurred are passed on to the consumers of electricity in SA in the form of further increases in prices. But Eskom’s monopoly applies only to the electricity delivered over its grid. Thus increases in electricity prices may prove self-defeating for Eskom as well as highly damaging to the competitiveness of the SA economy. Higher prices lead to lower levels of demand – perhaps the point where sales revenues decline rather than increase as key customers become more energy-conserving and turn to alternative supplies off the grid.
Potential customers can shut down operations or not start new projects when the economic case for their operations make much less sense, given higher real electricity prices. Investing in solar panels, small wind turbines or increasingly efficient gas turbines installed onsite, can make good sense as drawing on the grid becomes ever more expensive. And who knows what opportunities innovation and invention may bring for the generation of electricity on a small scale in the near future?
A further threat to Eskom and us, its owners, is that its largest customers, energy intensive miners and refiners of metals, who account for about 50% of demand for Eskom’s output, have publicly indicated a profound loss of confidence in it as a reliable competitive supplier of energy. They refer to operations being shut down or transferred outside of SA and a much weaker case for expanding capacity to upgrade (beneficiate) the metals and minerals brought to the surface.
There is in reality no good reason for all South Africans to have to carry these risks to the supply of and demand for electricity in SA. Such risks could be readily absorbed by willing new owners of the PPE – at the right price. Owners perfectly capable of raising their own sources of debt and equity capital to the purpose. The capital market has a proven taste for the predictable income streams that electricity utilities can deliver.
The Eskom assets could be divided up sensibly and auctioned off to a number of independent, capable operators. Hopefully the prices realised for the assets would be sufficient to pay off the Eskom debts. But even if not, it would be better to realise as much as possible, as soon as possible, for these assets, than to incur more debt to keep Eskom on its present path.
One advantage of perhaps lower-than-replacement-cost prices paid for the Eskom assets would be that it might enable its new owners to offer more competitively priced electricity – while still providing an adequate return on the capital they have invested. Prices for energy that could then encourage miners and manufacturers who would then be more internationally competitive thanks to lower energy costs. Competitive electricity prices, by international standards, could prove to be a stimulus for a revival of SA manufacturing and mining and the accompanying employment.
The SA economy stands to benefit from a much more competitive market for energy; from many more generators and distributors of electricity who would compete for customers on price and reliable supplies; from contracts that would facilitate the raising of capital on favourable terms for new owners and managers; and from the alternative technologies, relying on wind, solar or gas, that would have every opportunity to compete for custom on the same competitive terms. This would be a system much more like those that apply in the US or UK, a system designed
On Eskom: act soon or it will be too late to get back our investment
One offers commentary on matters of broad SA national interest that might helpfully respond to and benefit from the analysis and arguments raised. It is a tradition that – perish the thought – goes back to colonial times.
The notion that a concern for economic efficiency and economic development in the interests of society at large will prevail in the policy choices SA makes and the economic direction we take, has alas, become increasingly suspect. No other set of policies will be as important for the ability of our economy to raise future incomes, output and employment and to compete globally as taking the right path for delivering energy. Yet following the tempting money trail open to a few potential beneficiaries of energy procurement as currently practiced is much more likely to predict the future of energy production and consumption in SA than any objective analysis can do. But however objective such analysis could be it is still very unlikely to make the right choices- given the unpredictability of the future of energy. The best the government of SA and its agencies – Eskom and the municipalities that have monopoly powers over the generation and distribution of electricity in SA – could do for SA, would be to get completely get out of the business as soon as possible and on the best possible terms. Terms that are very likely to deteriorate the longer they delay their exit.
The reason for getting out and handing over the responsibilities to the fullest possible set of competing privately owned generators and distributors is that the future of energy is impossible to predict with any degree of confidence. Therefore the decisions to be taken in this regard by a government monopoly (with its narrow interest as a monopoly even an honest monopoly) are almost certain to be the wrong ones from which the society and economy will suffer permanent damage.
The most efficient, lowest cost methods of delivering energy in the future cannot be known. It will be discovered in the market place as all such discoveries are made. Discovered, as will be the case with every product and service to be delivered over the next thirty years, by trial and error in the market place, by constant experimentation by owners and managers with their open capital at risk where winners may be rewarded handsomely and losers punished severely with the loss of their capital. It may well turn out to be a future where the cheapest energy is delivered off-grid, making large capital intensive generating plants generating electricity with coal, uranium or gas redundant in time – but just how much time?
Permitting and encouraging such a market place in energy to fund the future demands for electricity on competitive terms , is the right path for SA to take. Adding further highly capital-consuming power plants using whatever kind of input, is surely a most dangerous step for the SA tax base or electricity consumers to have to support. Such plants supported by monopoly powers as were granted their developer Eskom fifty years ago, were arguably then the right way forward. They delivered satisfactory outcomes until recently, in the form of what were globally competitive electricity prices. But they are surely not the way forward today given the risks that technology poses and especially since Eskom itself has become close to bottom of its class of electric utilities on efficiency criteria – as judged by a recent study commissioned by the Intensive Electricity Users Group in SA – who have much at stake.
Eskom has proved very good (predictably so given its monopoly) only at providing employment and generous employment benefits as well as it would appear generous terms to its suppliers – at the expense of its users – who could have proved much better at delivering employment, profits and taxes (with lower electricity costs) including benefits of energy intensive beneficiation of metals and minerals.
There is little time to be lost if the SA tax payer is to recover its investment in and debt guarantees provided for Eskom given the uncertain future. If the plant and equipment were to be privatised soon, they might well fetch a price that would pay off the debts and avoid subsequent white elephants. And help open up, perhaps only gradually, a competitive market for electricity where different owners of generating capacity could compete for customers through the privately owned grid, treated perhaps as a regulated private utility.
The plants Eskom is now mothballing could attract bids and be kept running at a low enough asking price. And help produce electricity at highly competitive prices, enough to cover operating costs and a return on capital, that could perhaps, for a while, keep alternative electricity generators at bay, long enough for SA to get its money back.
*The views expressed in this column are those of the author and may not necessarily represent those of Investec Wealth & Investment
The curious case of Curro
To reward shareholders you have to over deliver- executing well is not enough
When the CEO of a highly successful JSE-listed business aims to “reward shareholders” with a maiden dividend, as Curro CEO Chris van der Merwe has recently promised, one takes notice (Business Day 1 March 2017), particularly because the company is undertaking an impressive programme of investing in new private schools (now 128 of them) with room for the company to grow further and faster. Its plan is to open seven new campuses a year, housing 15 to 18 new schools, intended to take the company to 80 campuses and 200 schools by 2020 and to increase its enrolment from the current 47 000 to 80 000. A longer term potential market for as many as 500 fee paying schools in SA has been suggested.
The 2016 financial year was an extraordinarily good and busy one for Curro. It raised an additional R1.75bn in equity capital to fund about the same amount of capital expenditure. Since 2013 Curro has been investing over R1bn a year in expanding the business. But the growth in the operating lines in 2016 were equally impressive, so helping to maintain a superb track record in executing its business plan. Profits after tax (which was minimal thanks to large depreciation allowances) have grown from R40m in 2013 to R168m in 2016 while the growth in cash generated from operations (helped by the same heavy depreciation and amortisation) has been even more impressive, from R106m to R404m in 2016. These were excellent improvements in organically generated cash flows, but not enough to fund the large current capital expenditure programme.
Why then pay out cash to shareholders rather than continue to reinvest in additional assets? These assets appear to be able to return more than would ordinarily be required by shareholders from other investments with similar risks. Is the value added for Curro shareholders in the form of returns on their capital that are well in excess of the (opportunity) cost of such capital, not reward enough to encourage retaining cash on behalf of shareholders rather than paying it out?
After all the rewards for shareholders come in the form of total returns: capital appreciation plus dividends. And as Warren Buffett has long demonstrated, paying dividends is by no means essential for generating high total returns, indeed dividends may reduce them if paying out cash constrains the scale of value-adding investment programmes that shareholders would have great difficulty in finding for themselves.
The problem however for Curro and its shareholders and managers is that, despite its considerable operational achievements and well executed growth plans, the company has not in reality rewarded shareholders since late 2015. It was then that the value of Curro shares reached a peak of over R52 but are now trading below R48. As may be seen in the figure below, Curro shares performed spectacularly well between 2011, when they traded at R8.92 and its peak of R52.65 in December 2015, equivalent to an annual average compound return of about 42%.

Curro has run into a problem faced by many well-managed companies. That is investors come, understandably, to expect excellent operating results and re-value the company and its management accordingly. They expect more and therefore prove willing to pay up more in advance to own a share of the much appreciated company and its management.
Hence it becomes ever harder for the company to perform well for shareholders given the much more demanding starting values. Unusual share price appreciation (best measured relative to the market as a whole) of the Curro kind, realised until year-end 2015, comes with surprisingly good outcomes, not just good outcomes. Surprisingly poor performance is as likely to be punished in the share market. Under promising and over delivering is the mantra for rewarding shareholders, of whom managers will be an influential minority. Curro clearly greatly surprised the market between 2011 and 2015 as it delivered fully on its promises, but since 2015 has not been assisted by the share market, which has moved mostly sideways. In recent years it has performed well but not better than expected (though offshore investors, measuring performance in US dollars, will regard 2016 with much more favour than their SA partners, given the stronger rand, which was up by about 20% in 2016).
To address this issue, Curro has indicated not only a willingness to pay dividends but to raise debt and debt ratios to supplement internally generated cash flows to fund growth. Cash flows are still expected to increase even though they are somewhat depleted by dividends to be declared.
The company has also revealed an intention to list separately a further entity on the JSE to pursue promising opportunities in tertiary education in SA. Why then list a separate company rather than pursue this opportunity from within the existing structures?
The answer may be that to do so would raise a new opportunity (Curro reprised) to surprise the market with a successful new listing, that is to surprise investors and so achieve capital appreciation more easily than it could do within the established Curro. To expand the tertiary education offering within Curro, with its already large scale, such a build-up of tertiary capacity may not make a very obvious difference to its growth trajectory and the already highly favourable expectations of investors revealed by a demanding share price.
Therefore paying dividends to shareholders will help them fund the new company. Note that the controlling shareholder, PSG, which helped launch Curro and owns 52% of it, must support any new listing. Cash withdrawn from Curro will help PSG fund its share of the new venture that with its small beginnings could surprise the market all over again and reward its shareholders accordingly by over delivering.
It might be sensible for the minority shareholders in Curro to follow any lead given by the controlling shareholder – that is to receive cash dividends from Curro and invest in the new venture and hope to be rewarded for doing so. 15 March 2017
Lessons from Edcon
The Edcon story – was it a failure of capital structure or of management? Or a bit of both?
Bain and Company, a private equity fund, has thrown in the towel on its involvement with Edcon, a private company that it has owned and controlled since 2007. When it took over, it immediately converted the equity stake it had acquired from Edcon shareholders for some R25bn (with almost no long term debt on the Edcon balance sheet) into additional Edcon debt of some R24bn, with some additional finance of about R5bn provided as loans from its controlling shareholders. It has now reversed this transaction, converting the considerable outstanding debts of Edcon back into equity. Edcon is the owner and manager of Edgars, a leading clothing retailer as well of other retail brands, including CNA and Boardmans.
The 2008 balance sheet reported total Edcon assets of R38.1bn, up from R9.5bn the year before. Much of the these extra assets were created by writing up the intangible assets, including goodwill, that Bain had paid up for and raised Edcon debt against. The cash flow statement for 2008 reports “investments to expand operations: R24.4bn”. This was a euphemism – the cash was patently used to reconstruct the balance sheet, not to expand operations.
More important for the new shareholders than the description in its financial reports, it failed to persuade the SA Revenue Service (SARS) that the extra borrowing was undertaken to produce extra income. As a result, Edcon continued to have to use some of the cash it was generating from operations to pay significant amounts of tax as well as the interest it was committed to paying. In the early period, the 47 weeks to 29 March 2008, it paid cash taxes of R246m. And despite the fact that large ongoing accounting losses that were incurred as interest expenses greatly exceeded trading profits, it continued to deliver cash to SARS at the rate of over R100m per annum. More recently, according to the cash flow statement in the 13 weeks to 26 December 2015, cash taxes paid amounted to R32m.
This appears as a large mistake when Edcon was originally reconstructed. Presumably, had Bain registered a new company to buy out the Edcon assets from its shareholders and this company had then funded the purchase with debt, the interest expense would have been allowed as incurred in the production of income. And the consequent losses could have been carried forward to offset future income and to raise the current value of the company.
Much of this debt was to mature in 2014-15 (a commitment that Edcon was unable to fulfil) as was long apparent and well-reflected in the much diminished market value of its debt that traded on global markets. It will be appreciated that the Edcon financial losses have mostly been incurred by its creditors, not by Bain and Company. The statement of Edcon’s financial position in December 2015 reports a shareholders’ loan of R828m, well down from the more than R5bn recorded in 2008. Clearly Bain and its co-shareholders have walked away with nothing to show for their efforts. The company is by all accounts now worth less than was paid for it in 2008.
In the charts below we convert the 71% of Edcon euro debt it incurred into rands at current exchange rates. In January 2008 a euro cost R11.12. As may be seen, the rand value of this euro debt is now significantly higher than it was in early 2008. But the rand value of this original debt had actually fallen significantly by 2010, providing an opportunity to restructure the debt with profit that apparently was ignored.

And if the burden of this euro debt burden was dragging down the operating performance of the retail operations (denied essential working and other capital, as it has been argued by management) then there was ample opportunity surely to add more equity capital with which to compete with the competition. And the competition has been doing very well, partly at Edcon’s expense, as measured by value of the General Retail Index of the JSE.
We have rebased this index and the retailers’ dividend per share to January 2008. We have also converted these additional rand values into euros at current values. As may be seen, the share market backdrop for clothing retailers and their ilk on the JSE was encouraging, but more so in rands than in euros (until very recently) with its combination of weaker retail share prices and a weaker rand. It seems clear that had Edcon operated in line with its competition, it could have added value for its shareholders and its debt, particularly had it been converted to rand debt (which would have been manageable).

With the agreement of its creditors, who now own all of the shares in Edcon in exchange for cancelling its loans, and with new debt raised of about R6bn, Edcon can continue to operate normally, much to the relief of it managers, workers and landlords. The horrors of business rescue have thus been averted, to the presumed advantage of its creditors and its future prospects. Given that Edcon continues to realise significant trading profits, it makes every sense for it to stay in business to deliver value for its new shareholders. For the third quarter of F2016 Edcon reported a trading profit of R763m and depreciation and amortisation of R248m, making for cash flows from operations of over R1bm for the quarter (though down by 7.7% on Q3 of F2015). Net financing costs of R958m for Q3 F2016 were also reported, 10% higher than Q3 in F2015. Coincidentally the debt on the Edcon balance sheet of F2016 was of about the same rand book value of about R22bn it reported in F2007. Its euro value, as may be seen, is considerably lower.
Bain and its funders clearly failed to realise the prospective gains they envisaged when they geared up the Edcon balance sheet. The potential rewards to the owners of the much reduced equity capital were potentially very large had the company proved able to service its debts. On returning to public company status, the possibly R5bn of equity finance provided might have doubled in value had the market value of the company gained an additional R10bn of value over the 10 years.
To put it another way: had Edcon performed as well as the average general retailer did on the JSE over the period, these gains would have been realised. But the average JSE-listed clothing retailer was not encumbered by nearly as much debt, particularly the 71% of its debt denominated in euros. This appears as the major original strategic error made by Bain to which it never made the adjustment. Combining rand revenues that Edcon would generate, with hard currency debt, represents a highly risky strategy. Perhaps the SA debt market would not have been willing to subscribe the large amount of the extra debt raised. But there was surely always the opportunity to fully hedge the foreign currency risk. But this would have meant paying interest at a South African rather than a euro or dollar rate, a cost that, had it been incurred, may well have (correctly perhaps with hindsight) undermined the investment case for a highly leveraged play on the SA retail market.
The Edcon experience has unfortunately not been able to add to the case for private equity over the public equity alternative in SA, that is to say, to use public money to take a (large) listed company private. The case for private equity is not based on its superior financial structure of more debt and less equity, though clearly the leverage adds greatly to the potential returns for equity holders (assuming all turns out well for the company). Moreover, the conversion of a public company to a private one, through private equity funds, or more or less the same thing, through a management buyout, may not be possible without significant reliance on debt finance. The case for private equity is that the few shareholders with much to gain and lose have every incentive to closely and better manage their stake in the company. They will be very active shareholders with highly concentrated investments, unlike those of the average listed company with wider stakeholders, as opposed to shareholder interests, to serve. The large publicly funded private company represents therefore a very helpful competitive threat to the public company, from which shareholders (including pension funds) the economy and its growth prospects can benefit.
It is thus no accident that the number of companies listed on all the US stock exchanges has declined dramatically over recent years, by between 40% and 60% over the past 25 years according to different estimates, as pension funds and endowments have increased their allocations to alternative investments and especially to private equity funds. Private companies may well, on a balance of full considerations, serve their owners better than public companies.
The competitive threat therefore should be encouraged and not discouraged (including by SARS). The objective of tax policies should be much wider than merely protecting the tax base. Private equity, by adding to the growth potential of an economy and especially adding to the willingness of the system to bear additional risks for the prospect of additional returns, deserves no less or more than equal tax treatment.
For its errors of commission and omission, Bain and the managers it chose for Edcon, were unable to improve its operating performance. How much this equity is now worth is a matter of conjecture that can only be resolved when, as is the intention, these Edcon shares are re-listed on the JSE. The sooner the current Edcon shareholders get to know what their shares are worth, surely the better and the sooner the shares can be listed and so could pass into the hands of perhaps more active investors, the better the company can be expected to perform. 27 September 2016
The paradox of competition
The paradox of competition. You can lose because you have won the game.
When portfolio managers and active investors value a company, they are bound to seek out companies’ advantages that can keep actual and potential competitors at bay. Moreover, they seek companies with long lasting, hopefully more or less permanent, advantages over the ever likely completion, advantages that will not “fade away”, in the face of inevitable competitors.
The talk may be of companies protected by moats, preferably moats that surround an impregnable castle filled with crocodiles that keep out the potential invaders, that is the competition. Reference may be made to protection provided by loyalty to brands that translate into good operating profit margins; or to intellectual property that is difficult for the competitors to replicate and reduce pricing power. It’s a search for companies that generate a flow of ideas that lead to constant innovation of production methods and of products and services valued by customers; and those with good ideas that will receive strong encouragement from large budgets devoted to research and development that can help sustain market leading capabilities through consistent innovation that keeps competitors at bay.
Such advantages for shareholders will be revealed in persistently good returns on the capital provided by shareholders and invested by the team of managers – managers who are well selected and properly incentivised, and also well-governed by a strong board of directors, including executive directors with well aligned financial interests in the firm. Furthermore, the best growth companies will have lots of “runway” – that is a long pipeline of projects in which to successfully invest additional capital that will be generated largely through cash retained by the profitable company. By good returns on capital is meant returns on capital invested by the firm (internal rates of return: cash out compared to cash in) that can be confidently predicted to consistently exceed the returns required of similarly risky shares available on the share market, that is market beating returns.
Such companies that are expected to perform outstandingly well for long, naturally command very high values. Their high rates of profitability – high expected (internal) rates of return on the shareholder capital invested – will command great appreciation in the share market. High share prices will convert high internal rates of return on capital invested into something like expected normal or market-related returns. The virtues will be well reflected in the higher price paid for a share of the company. Thus the best firms may not provide exceptional share market returns, unless their excellent capabilities are consistently under appreciated. This is an unlikely state of affairs given the strong incentives active investors and their advisers have to search for and find hidden jewels in the market place.
Such excellent companies – market beating companies for the long run – are therefore highly likely to enjoy a degree of market dominance. Their pricing power and profit margins will be testament to this. In other words, they are companies so competitive that they prove consistently dominant in their market places.
But such market dominance – that has to be continuously maintained in the market place serving their customers better than the competition – has its own downside. It is bound to attract the attention of the competition authorities. The highly successful company – successful because it has a high degree of market dominance – may have to prove that it has not abused such market dominance. The fact that the returns on capital are so consistently high may well be taken as prima facie evidence of abuse that will be hard to refute. It may well be instructed to change business practices that have served the company well because they do not satisfy some theoretical notion of better practice. Such companies have become an obvious target for government action.
Foreign-owned companies that achieve market dominance outside their home markets may be particularly vulnerable to regulation. These interventions are designed perhaps to protect more politically influential but in reality less competitive domestic firms. Hence the actions taken by the European competition authorities against the likes of Google, Facebook and Microsoft who have proved such great servants of European consumers.
And so one of the risk of competitive success is that such success will be penalised by government action. A proper appreciation that market dominance is the happy result of true competition that has proved to be disruptive of established markets, through the innovation of products and methods, would avoid such policy interventions that destroy rather than promote competition.
Market forces and market dominance can be much better left to look after themselves, because innovation is a constant disruptive threat for even the best-managed and dominant firms. These firms will know that dominance may well prove to be temporary and so they will behave accordingly, by serving their customers who always have choices and by so doing satisfying their shareholders. 14 September 2016
Taking a bite of the Apple
The European competition authorities have ruled that Apple has wrongly benefitted from a tax deal with Ireland that allowed Apple to avoid almost all company taxes on its sales in Europe, the Middle East and Africa. The €13bn company income tax Apple is estimated to have saved on the taxes has been classified as state aid to industries. Hence illegally and to be refunded to the Irish government in the first instance- plus interest. No doubt other European governments and maybe even South Africa (assuming the Treasury is not otherwise engaged) will be looking to Ireland for their share of the taxes unfairly saved on the Apple income generated in their economies and transferred through their tax haven in Ireland.
The principle that taxes should be levied equally – at the same rate – on all companies generating income within a particular tax jurisdiction seems right. But it is a principle much more honoured in the breach than the observance. The effective rate of tax (taxes actually paid on economic income consistently applied) will vary widely within any jurisdiction, with the full encouragement of their respective governments. The company tax rate may vary from country to country – in Ireland it is a low 12.5% is levied on income that may be defined in very different ways from one tax authority to another from company to company.
A company may benefit from a variety of incentives designed to stimulate economic activity generally and capital expenditure in a particular location, perhaps in an export zone or a depressed region or blighted precincts of a city. They may utilise incentives to employ young workers or to train them. Investment allowances may far exceed the rate at which capital is actually depreciating to encourage capex. And governments may well collaborate in R&D that effectively subsidises the creation of intellectual property. A further important source of tax savings comes from the treatment of interest payments on debt. The more debt, the higher the tax rate, the less tax paid or deferred. And so every company everywhere (not just Apple) manages its own effective tax rate as much as the law allows it to do. It would be letting down its owners (mostly affecting the value of their shares in their retirement plans) if it failed to pay as little tax it can.
But then this raises the issue that Apple has already raised in tis defence as has the US government. How does one value the intellectual property (IP) in an Apple device? And who owns the IP and where are the owners of the IP located? In Europe – at the head office post box in Cork or in California where much of the design and research is undertaken? Operating margins are very large – maybe up to 90% of the sales price in an Apple store. What if Apple California charged all its subsidiaries everywhere heavily for the IP that accounts for the difference between revenues and costs? Profits and income in Europe and Africa could disappear and profits in the US explode given very high US company tax rates. The reason Apple does not or has not run its business this way is obvious enough; it has been able to plan its taxes and cash holdings to save US taxes.
The insoluble problem with taxing companies and determining company income is that company income is not treated as the income of its owners – or as it would be in a business partnership. In a partnership (which can be a limited liability one) all the wages and salaries, interest, rents, dividends or capital gains are treated as income and taxed at the individual income tax rates. Total taxes collected (withheld) by the partnership could easily grow rather than decline given that there would be no company tax to shield. And the value of companies absent taxes would increase greatly, calling for a wealth as well as a capital gains tax on their owners. The problem with company tax is company tax. The world would be better without it.1 September 2016