Below follows an update on this piece from Monday.
The immediate outlook for the economy depends on who governs SA after December 2017. Will it be the Zuma faction or some other ANC coalition calling the shots? That is the essential question for the economic outlook and the value of the financial claims on it. The market in SA assets has made its preferences for much less of President Zuma very clear. RSA risk premiums rise and fall as the expected Zuma influence on policy gains or loses momentum.
On Thursday and Friday last week the market suddenly came to reverse recently very unfavourable trends to register less SA risk. The rand strengthened, not only against the USD, but more meaningfully, also gained against other EM exchange rates.[1] Furthermore not only did RSA bond yields decline late last week – they declined relative to benchmark US yields. Still less SA risk has been registered this week in the foreign exchange markets. The ratio of the USD/ZAR to the USD EM basket (Jan 1st 2017=1) had moved out to 1.104 on the 13th November is 1.065 a relative SA gain of 3.6%
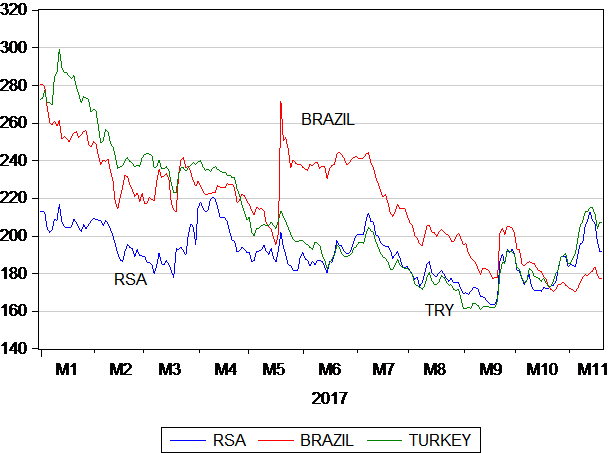
The behaviour of these foreign exchange indicators in 2017 is shown in figure 1 below. As may be seen, despite this recent improvement in sentiment, 2017 has not been a good year for the ZAR. The USD/ZAR weakened relative to its EM peers when Finance Minister Gordhan, in public dispute with the President over spending plans, was sacked in March 2017. It also suffered in response to the Budget statement presented by his successor, Milusi Gigaba in late October, as may also be seen.
The budget disappointment was perhaps not in the details about the revenue shortfall – this was well telegraphed – but that no revised plan to address the widening fiscal deficit was offered. The concern was presumably that Zuma and his cohort would soon announce more government spending, on nuclear power or students, rather than less, regardless of the fiscal constraints.
Fig.1; The USD/ZAR and the USD/EM exchange rate basket in 2017. Daily Data January 1st=100 to November , 23rd OR ratio (LHS) =1
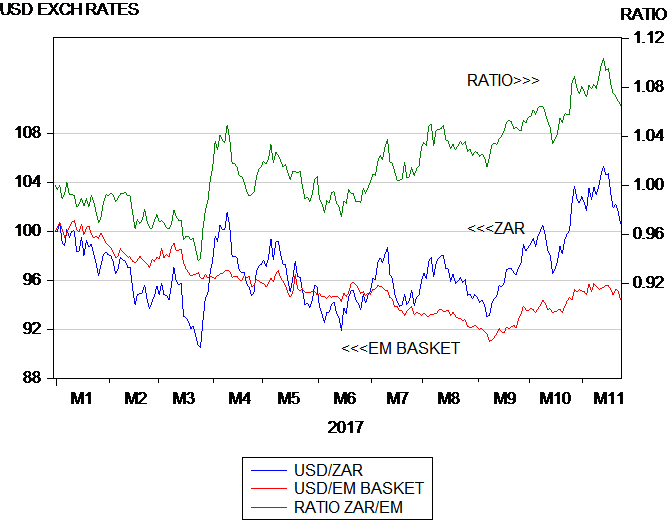 Source; Bloomberg and Investec Wealth and Investment
Though perhaps a little longer perspective on SA risk indicators is called for, as is provided in figure 2 below. There it may be seen that the ratio of USD/ZAR exchange rate to the USD/EM currency basket, weakened significantly in December 2015, when Finance Minister Nene was so surprisingly sacked. However as may be seen in the figure, the rand in a relative and absolute sense did very much better in 2016. Perhaps because the decision Zuma made under pressure from colleagues and the business community to immediately reappoint Pravin Gordhan, indicated less rather than more power to the President. A sense perhaps that the market had gained of Zuma overreach and a degree of vulnerability. Just how vulnerable is President Zuma remains to be determined- hence market volatility.
Fig 2; The ratio of the USD.ZAR to the USD/EM currency basket (January 2017=1) Daily Data
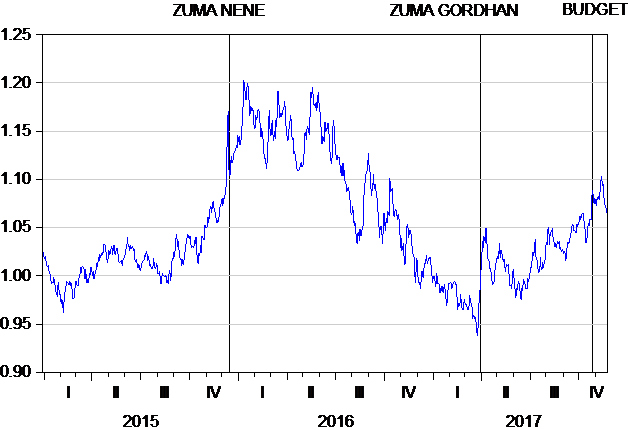 Source; Bloomberg and Investec Wealth and Investment
The indicators derived from the Bond market make the same statements about SA risk. As shown in figure 3 below the spread between RSA and USA government bond yields, the so called interest rate carry that reveals the expected depreciation of the USD/ZAR exchange rate, widened sharply as the rand weakened in late 2015. They then narrowed through much of 2016, stabilized in 2017 until the Budget disappointment pushed them higher. The difference however between RSA rand bond yields however has widened gain to 7.2% p.a. and is back to levels recorded on the 14th November. The default risk premium attached to five year RSA dollar denominated bonds though has declined further from 208 b.p on the 14th November to 187 b.p on the 23rd November
In figure 4 it may also be seen how the RSA sovereign risk premium has behaved in 2017. Sovereign risks are revealed by the spread between the yield on a USD denominated RSA (Yankee) Bond and its US equivalent. As may be seen this spread has been variable in 2017 – that it increased by 40 b.p. in October – and then declined sharply in the week ending on November 17th. These spreads indicate that SA debt is already being accorded Junk Status by the market place, ahead of any such ruling by the rating agencies. The spread on the lowest Investment Grade debt would be of the order of 1.6%.
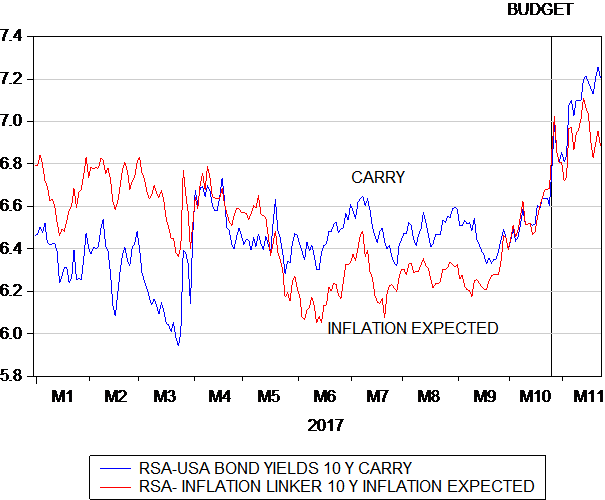
In figure 5 we show the interest carry- the rate at which the USD/ZAR is expected to weaken over the next ten years and inflation expectations. These are measured as the spread between a vanilla bond that carries inflation risk and an inflation linker of the same duration that avoids inflation risk. As may be seen more inflation expected is strongly connected to the rate at which the ZAR is expected to weaken. It should be recognized that the weaker the rand the more it is expected to weaken further. It will take a stronger rand to reduce inflation expected- a welcome development that is beyond the influence of interest rates themselves.
Fig.3; The USD/ZAR and the Interest Rate Spreads. Daily Data 2015 to November 23, 2017
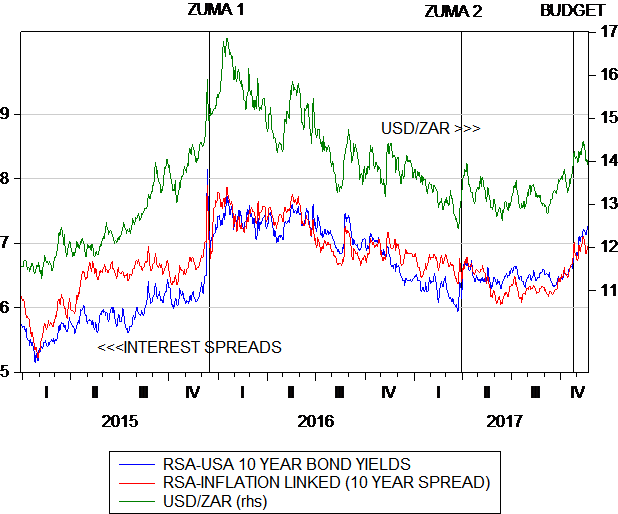 Source; Bloomberg and Investec Wealth and Investment
Fig.4; The RSA sovereign risk premium and the interest carry. Daily Data 2017.
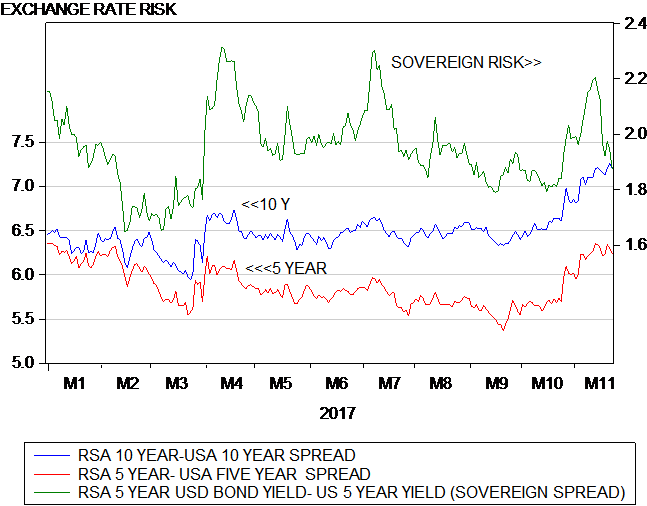 Source; Bloomberg and Investec Wealth and Investment
Fig.5: The interest rate carry and inflation compensation in the RSA bond market. Daily Data 2017.
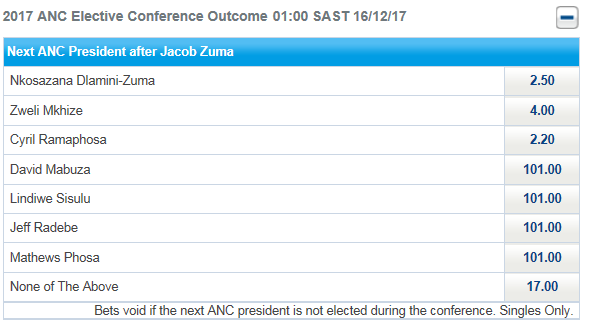
The market place, as well as the bookmakers, will continuously update the odds of one or other candidate for the Presidency of the ANC ( now very probably) being determined in December 2017. The odds offered by Sportingbet at 13h00 on November 20, 2017 are shown in the Table below. (www.sportingbet.co.za ) They have not changed since- indicating perhaps a lack of betting activity. These odds imply a 40% chance of Dlamini-Zuma winning the nomination and a 45% chance for CR. As they say in racing circles- the favourite does not always win- but don’t bet against it.
Lower South African risks and the stronger rand and lower interest and inflation rates associated with rand strength are good for the economy and all the businesses and their stakeholders dependent on the economy. One prediction can be made with some degree of conviction. That is without less SA risk any cyclical recovery in the SA economy is unlikely.
Additional Figures
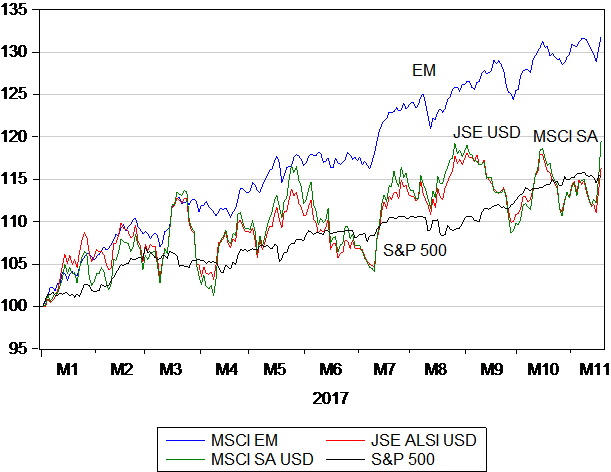
Equity performance in 2017 to November 17th Daily Data
Credit Default Swap Spreads over US Treasuries 5 year; Daily Data 2015-2017
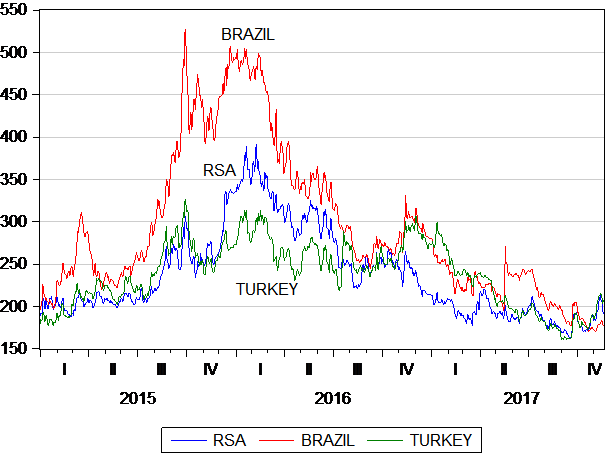
Credit Default Swaps over US Treasuries, 5 year Daily Data to November 17th 2017.
[1] Our construct for Emerging Market exchange rates that exclude the ZAR is an equally weighted nine currency basket of the Turkish Lire, Russian Ruble, Hungarian Forint, Brazilian Real, Mexican, Chilian and Philippine Pesos, Indian Rupee and Malaysian Ringit