The Census reports good real progress in household incomes and household numbers
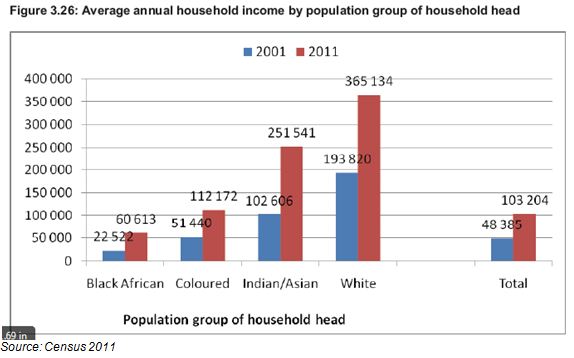
The general impression provided by the census is that significant economic progress has been made in SA over the past 10 years. There are now 14.45m identified households, 28% more than were counted in 2001. Average household incomes of R103 204 were reported compared to R48 305 in 2001. That is an increase of 113% in money of the day terms. Given that the CPI increased by 77% over this period, this implies a real increase of approximately 36% in average household incomes over the 10 years.
The poorest SA households are those led by black Africans. However they did significantly better than the average SA household. Households headed by black South Africans increased their average household incomes by 169% in current prices or by nearly double, when adjusted for inflation between the censuses of 2001 and 2011. The objective of advancing the previously disadvantaged has been met about as well as the government could have realistically hoped for.

The census is consistent with National Income estimates
These increases in self assessed incomes, in response to the question asking respondents to estimate “gross monthly or annual income before deductions and including all sources of income” compare very well with the growth in per capita incomes as estimated by the National Income Accounts. Gross National Income per capita in real terms grew by 35.5% between 2001 and 2011 or at a compound average growth rate of 3.04% p.a. Such growth rates in per capita or average household incomes represent much more than the much despised trickle down. If growth is maintained at this rate over the next 10 years this would represent a doubling of average incomes in 20 years and significant economic progress indeed.
One of the benefits of higher incomes is more and smaller households
It is not surprising, given an improved standard of living, that the number of identified households has increased much faster than the population itself. The population grew from 40.58m residents in 2001 to 51.77m in 2011, an increase of 14.2%, compared to the larger 28% increase in the number of households. Many more family members have had the means able to form households of their own.
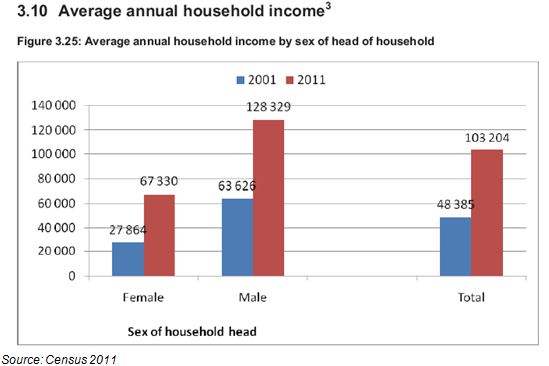
The average SA household therefore consists of a surprisingly few 3.58 average members in 2011 compared to a similarly few 3.62 members in 2001. Perhaps this small average household is attributable to the large number of female led households with presumably no males of working age to add to household income or numbers. Households led by women earn significantly less than the average. (see below)
The composition of the housing stock
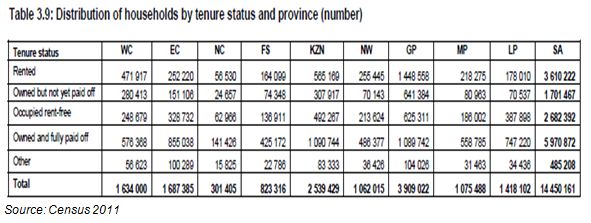
Of the 14.4m housing units identified by the census the great bulk are formal houses or apartments. 1.14 units are described as traditional, 1.249m as informal dwellings (stand alone shacks) with a further 713 thousand shacks in back yards. The ownership structure of these housing units makes interesting reading. Nearly 6m of the units are identified as owned and fully paid off (See below). It is these owners who surely make the most reliable and sought after recipients of unsecured loans.
Stuff at home
These homes – owner rented and mortgaged – seem very well provisioned with household appliances and consumer goods. 10m refrigerators and 11m stoves were identified, together with 4.5m washing machines and more computers, 3m, than vacuum cleaners. 10.7m TV sets entertain the stay-at-homes backed up by as many as 8.5m DVD players and unsurprisingly, 13m cell phones.
Large differences in provincial income –or is it an urban / rural divide?
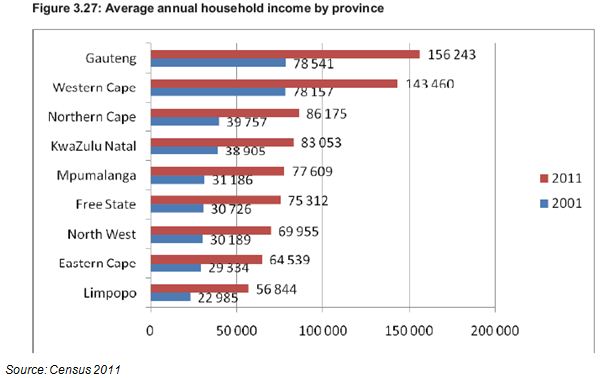
Much larger differences in household incomes are however recorded by the different provinces. Average household incomes are highest in Gauteng (R156 243) and the Western Cape R143 460 – almost three times as high as average household income in the poorest provinces (See below).
These income differences may be regarded as more of an urban-rural divide than a provincial one. The gap between household incomes in the Durban metropolitan region and that or rural KwaZulu-Natal is probably every bit as wide as it is between Gauteng and Limpopo.
Higher incomes mean greater opportunity and so migration – a force to be recognised in advance and encouraged
It is these differences in incomes and income earning opportunities that understandably have led to large numbers (presumably mostly younger men and women) migrating to Gauteng and the Western Cape. Over a million people have migrated to Gauteng over the past 10 years and over 300 000 to the Western Cape. The Eastern Cape has seen net outward migration of 278 000 persons, mostly to the Western Cape, and in Limpopo Province: a net 152 000 residents have migrated to other provinces, mostly to Gauteng.
Migration plus population growth has seen the population of Gauteng increase from 9.38m in 2001 to 12. 27m in 2011, an increase of 30%. This makes Gauteng by far the most populous SA province. The population of the Western Cape has increased by 28% over the 10 years to 5.8m people, more than the population of the much poorer Eastern Cape.
Since transfers from the central government to the provinces are based on the size of their populations, these developments have significant budgetary implications. The argument that the governments of the Western Cape and Gauteng will make is that with migration of this order of magnitude, 10 years is too long to wait to adjust budgets in recognition of population growth and the additional demands growth n population makes on provincial budgets.
However the logic behind the allocation of funds to the provinces based on existing populations, rather than their economic potential, should be questioned. If economic and employment growth were the objective of economic policy then it would surely be better to back the winning provinces – those that offer significant employment and income opportunity – rather than redistribute taxpayers’ contributions to those provinces where economic prospects and achievement are so lacking. The economic potential of SA, as everywhere in the world, lies in the urban not the rural areas. Brian Kantor


