Brian Kantor and Carig Evans
27th May 2026
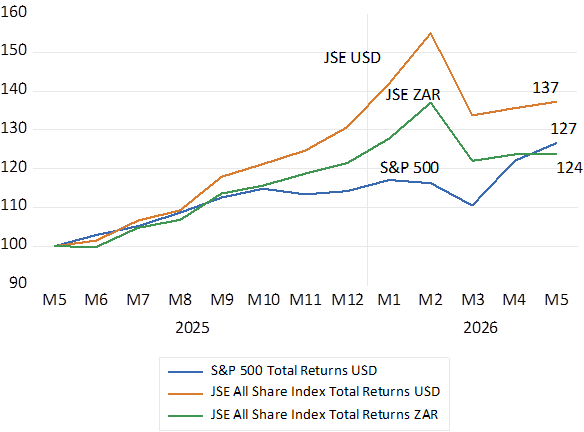
Investors who over the past year (since May 2025) have invested in a portfolio of shares that passively replicate the S&P 500 Index or the JSE All Share Index have every reason to be pleased. The value of their US portfolio, with dividends reinvested in the S&P Index will have grown by 27% over the past twelve months. This year, despite the Middle East war and despite significantly higher US bond yields, the Index has returned nearly 11%. It has gained further momentum, after the war began. Up about 9% up since February. US 10 year Treasury Bonds yielded 4.17% p.a. in early January. They now offer 4.5% p.a.
Investors replicating the JSE All Share Index have gained even more – up 24% in ZAR and 37% in USD since May 2025. But the war has damaged the JSE down nearly 11% in USD since February 2026.
Share Market Indexes S&P 500 and JSE All Share Indexes (2025.05=100) Month End Data
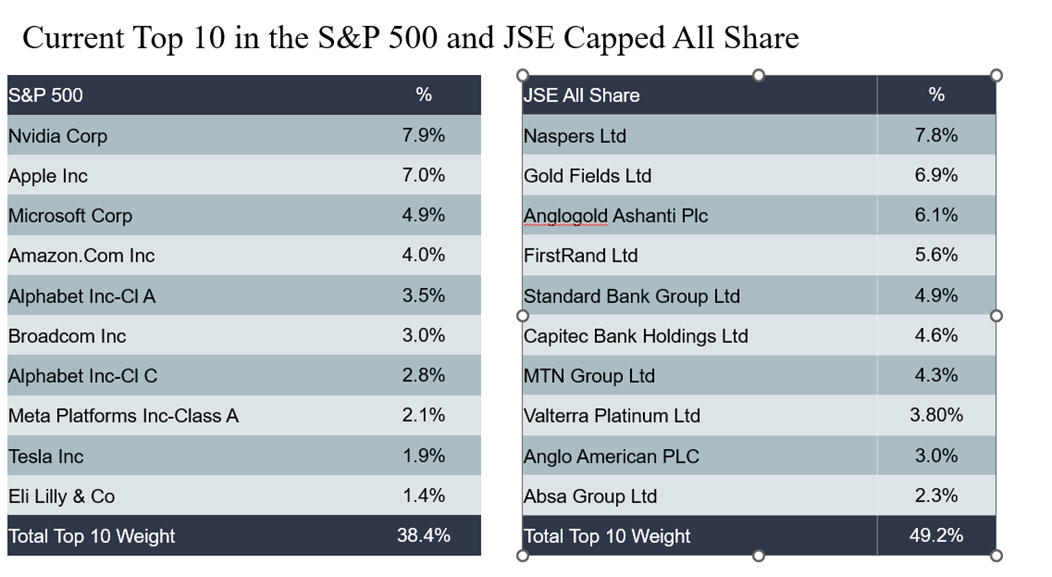
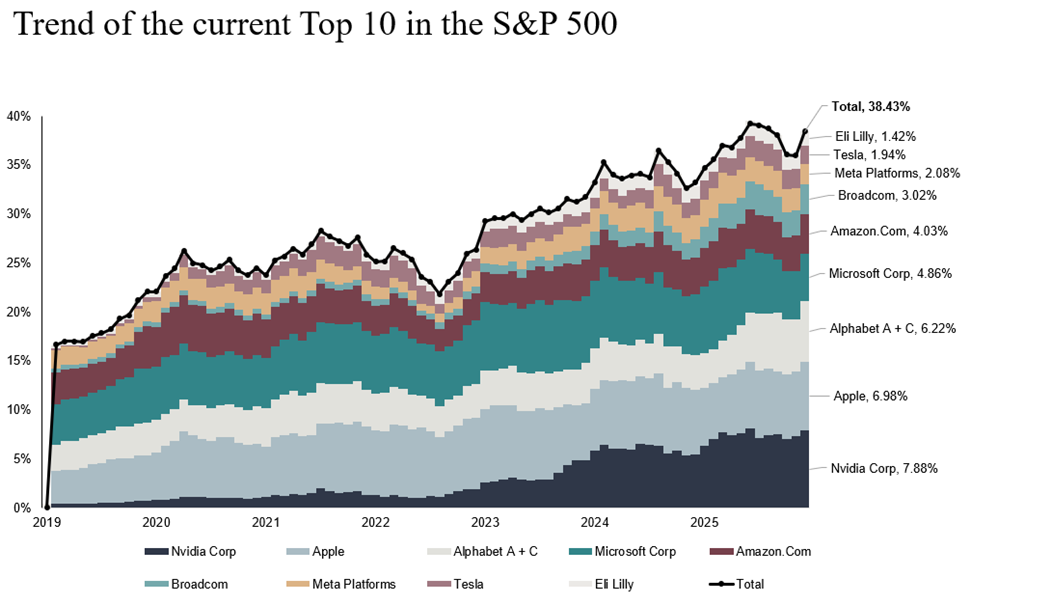
But Investors in the S&P 500 and the JSE should also be highly cognisant of the risks they are running holding shares strictly in proportion to their market value represented in an Index. The S&P 500 Index, while storming ahead, has become ever more concentrated and dependent on the performance of a very few stocks. The S&P Index has become significantly less diversified and thus more exposed to the risk of a draw down. The top ten counters, included in the Index, by market value, now account for 38% of the Index. A top ten share that has probably never been higher. In 2019 a different top ten contributed a mere 16% to the Index.
Source; Bloomberg and Investec Wealth & Investment
Source; Bloomberg and Investec Wealth & Investment
Source; Bloomberg and Investec Wealth & Investment
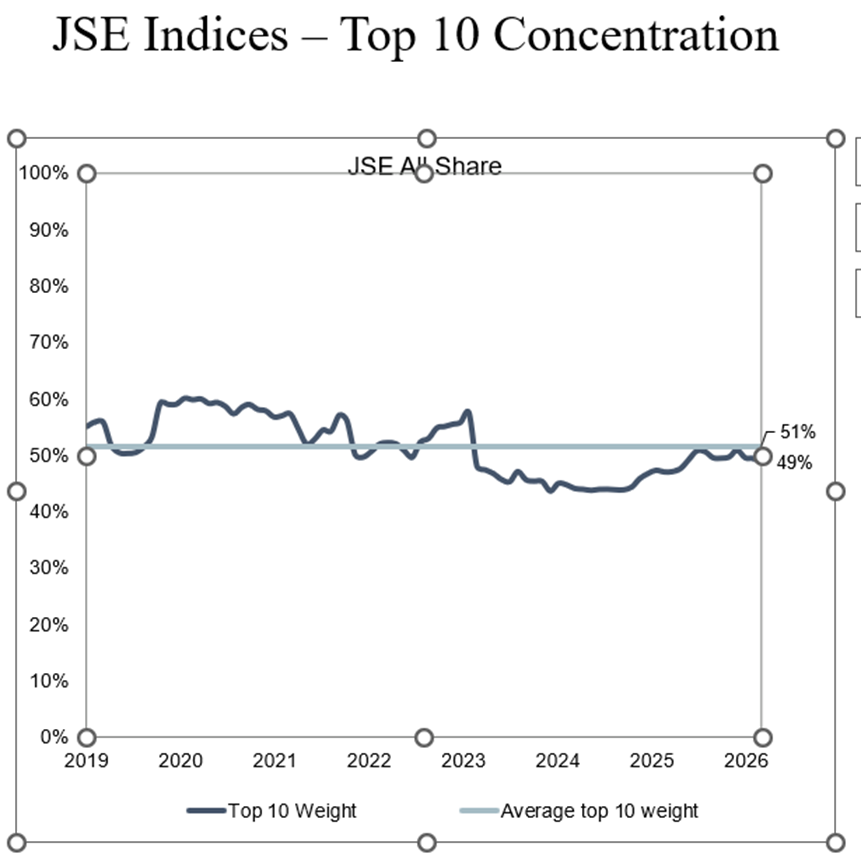
The JSE has on average over the years has been more highly concentrated than the S&P 500. Since 2019 the top ten companies by market value included in the All Share Index have accounted for about 50% of the Index and this average has not varied much over recent years. Though in recent years the Index has come to be dominated by Resource Companies buoyed by much improved prices for precious and other metals.
Of the 49% share of the ALSI accounted for by the top ten, Resource companies account for nearly 20% of the Index. With gold mining companies Anglogold and Goldfields making up 13% of the Index between them. Clearly these concentration risks are risks that the average risk averse active fund manager would be reluctant to take. It is not safety first to hold 8% of a portfolio in a chip producer or 13% in two gold mining companies.
Source; Bloomberg and Investec Wealth & Investment
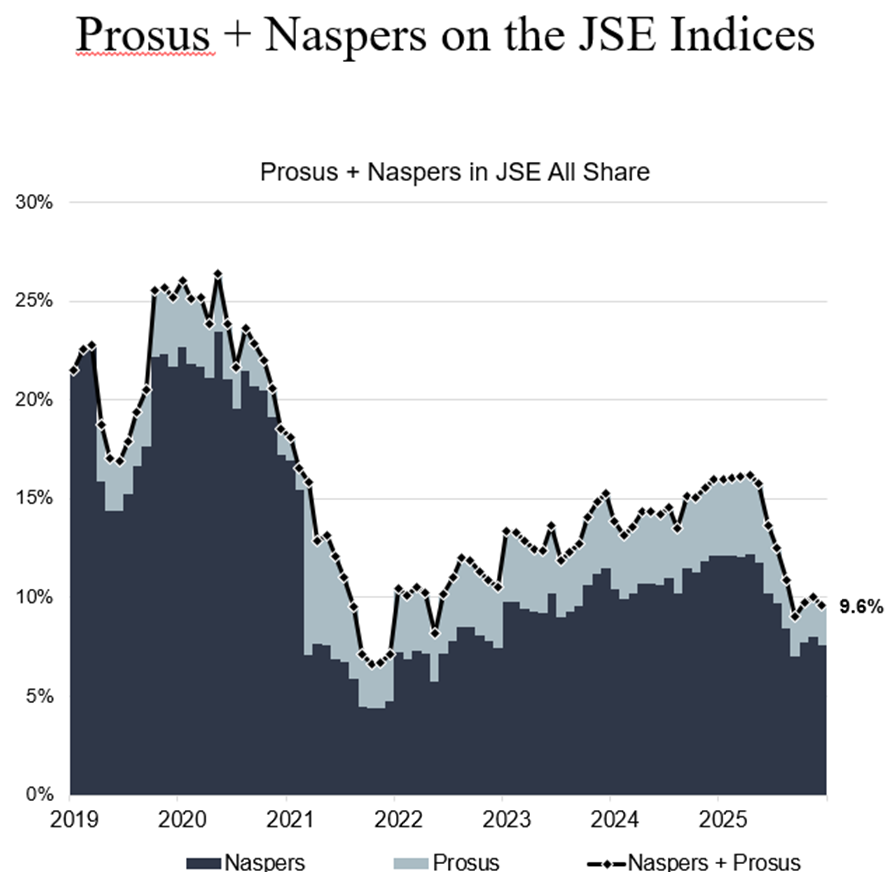
The JSE provides at least one conspicuous example of how blind index tracking can hurt. After an extraordinary run – a ten bagger and more -Naspers came to dominate the JSE All Share Index with its extraordinary growth in market value. In 2020 Naspers and its associated company Prosus accounted for over 25% of the JSE All Share Index. That share is now down to 9.6% but still enough to make Naspers the largest company on the JSE with a near 8% share. However, after it peaked at 25% in early 2020 Naspers and Prosus significantly underformed the Index to fall away in relative size on the JSE Holding 25% of a share portfolio in Naspers and Prosus in 2020 proved to be a very bad idea that presumably most risk conscious active investors had hopefully not subscribed to. But a danger Index trackers could not avoid.
JSE Vs Naspers Vs Prosus. Total Returns (2019=100)
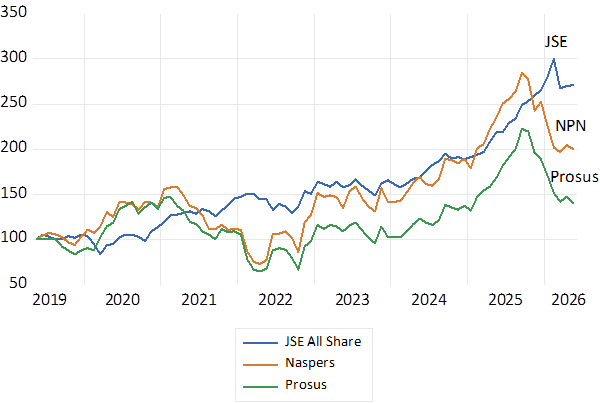
Source; Bloomberg and Investec Wealth & Investment
Much of the underperformance of Naspers and more so of Prosus came in 2021 and 2022. These two counters are currently again lagging well behind the Index.
Differences in Total Returns JSE- Naspers and Prosus. 2019=0
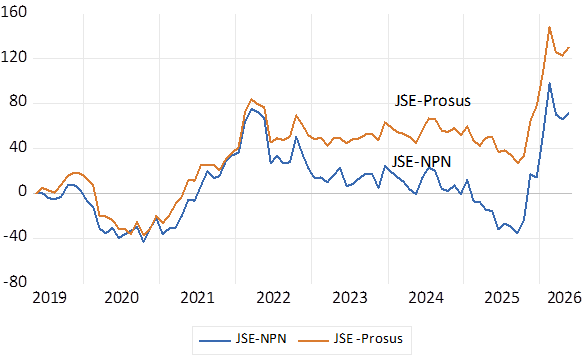
Source; Bloomberg and Investec Wealth & Investment
Undiversified portfolios are risky by nature. Nature demands that higher expected returns come with increased risks of failure. Stocks that come to dominate an Index may also be more volatile day to day than the average stock adding market risk and one time market leaders can become laggards that will drag down the value of an Index tracking portfolio.
Financial history tells and warns us so. Passive Index tracking is clearly not without risks. It all depends on the Index tracked and the less diversified they are or become, the more risky they are. Some Indices will be more concentrated than others. The Korean Kospi – also now running strongly – is dominated by two only chip producers. Nokia used to account for 90% of the Helsinki Index. Gold mining companies at one point, when the gold price took off in the seventies, accounted for 60% of the JSE.
Active investing is not only about realising market beating returns. It is as much about managing risks of the ultimate shareholder in a sensible way. But the risk averse investor would almost inevitably underperform the Indices when they are running hard led by a few counters as has been the case recently in New York and Johannesburg. Be they Nvidia on the S&P or Goldfields on the JSE driving the Index consistently higher.
When the race has been run and the outcomes are known future conscious risks, the before race odds, become irrelevant. And too few appreciate risk avoiding strategies when the risks, with good luck or perhaps judgment have proved to be over-estimated. It takes a market draw down to appreciate risk avoidance and appropriate diversification strategies. Not to be wished for but to be planned for.