The odds on a US recession in the next twelve months have receded in the light of the continued willingness of US households to spend more- despite much higher interest rates and reductions in the supply of money and bank credit. Spending on goods and food services rose by 0.7% in September on top of a robust increase of 0.8% in August. The annual increase in retail sales is 3.7% and the increase over the past three months is running at an annual equivalent of 8% p.a. Prices at retail level are falling. They stimulate demand but they also devalue the inventories held to satisfy demand. Prices have their supply and demand causes. They also have their effects on demand- and supply. Lower prices stimulate demand and incomes are now growing faster than prices.
All that is holding up the US CPI – now 3.7% up on a year ago – are house prices – and what are imputed as owners’ equivalent rent. That is at what the owners could earn if they rented their homes They are up 7% on a year before. They have a huge weight in the CPI – over 25% – and if excluded from the CPI – would have headline inflation running in the US below the 2% target. Cash rentals account for a further 7% of the US CPI. By contrast food eaten at home carries a weight of only 8.6% in the CPI and food eaten out is 4.8% of the US CPI Index. SA also includes owners’ equivalent rent in its CPI with a weight of 12.99% and actual rentals account for only 3.5% of the index. Both rental series in SA are up by a below average 2.6% on a year before. The headline inflation rate in SA was 5.4% in September.
Owners equivalent rent is a very different animal to other prices. Higher implicit rentals based on the improved value of an owner’s home are not the usual drag on spending. The extra wealth in homes, as would all increases in household wealth, more valuable pension plans, more valuable share portfolios, etc. will encourage more, not less spending. The boom in US house prices post Covid has had much to do with the ability and willingness of US households to spend more and help push up prices generally. Average house prices in the US are now falling under pressure form much higher mortgage rates and house price inflation to date will be falling away rapidly as will owner’s equivalent rentals. Thus helping to reduce headline inflation.
The question investors are asking about both inflation (falling) and the state of the economy ( holding up) is what will it all mean for interest rates. The stronger the economy the lesser the pressure on the Fed to lower short rates. And the greater will be the pressure on long term rates in the US. The key ten-year Treasury Bond is now offering 4.9% p.a. reaching a 16 year high. In the share market what is expected to be gained on the swings of earnings may be lost on the roundabouts of higher interest rates, used to discount future earnings. But if inflation is subdued, any visible weakness in the economy, can be followed immediately by lower interest rates. This thought will be consoling to investors.
The attention paid to GDP by investors is fully justified. Where GDP goes so will the earnings reported by companies. Their correlation since 1970 is (R=0.97) Though helpfully to shareholders in recent years earnings have been running well ahead of earnings indicating widening profit margins from the IT giants. GDP , on a quarter-to-quarter basis, is a highly volatile series. Though growth in earnings is much more volatile.
US GDP and S&P 500 Earnings. Current values. (1970=100)
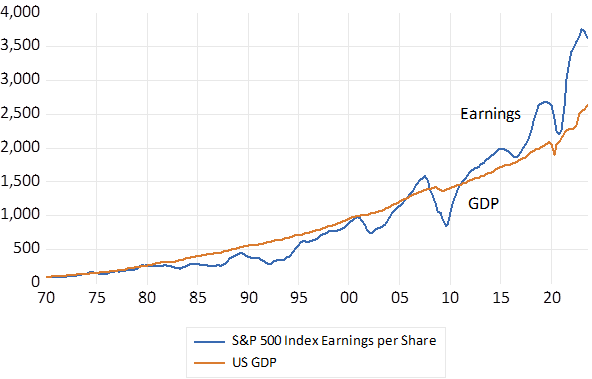
Source; Bloomberg, Federal Reserve Bank of St. Louis and Investec Wealth and Investment.
The underlying trend in GDP and earnings will never be obvious. To make sense of their momentum, to recognize some persistent cycle, the data has to be smoothed and compared to a year before. Thus we will know only in a year or more whether the US economy has escaped a recession. It is not recessions that move markets, only expected recessions do so. And the jury will always remain out.
GDP and S&P 500 Earnings Growth Quarter to Quarter % Annualised.
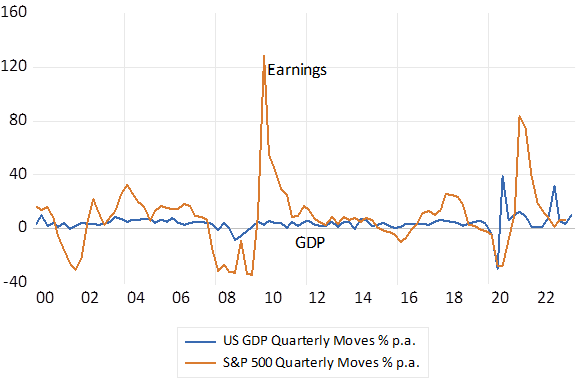
Source; Bloomberg, Federal Reserve Bank of St. Louis and Investec Wealth and Investment.