South Africans would benefit greatly if the country’s state-owned enterprises were to be privatised. Full story as published in FinWeek here.
Category: SA Economy
Out with the credit regulator
I have a very radical policy proposal, which is to repeal the National Credit Act. Repeal would allow lenders and borrowers complete freedom to contract with each other for credit on any terms they found agreeable. It would help transform the economic prospects of many South Africans who do not benefit from regular incomes and so do not qualify for credit under current regulations.
Freer access to credit would be particularly helpful to informal traders and aspirant farmers and entrepreneurs. By saving the significant costs of complying with current regulations, a repeal might well lead to less expensive borrowing terms for the many who currently receive credit. Strong competition for potential credit business would convert lower compliance costs of providing credit into lower charges for all borrowers. The reputation of the lenders for fair treatment of its customers would become even more critical in attracting new and repeat credit business. A lender would not have to proclaim it is an authorised financial service provider as if this were some kind of guarantee that absolves borrowers or lenders of the need to undertake proper diligence.
The importance of maintaining reputation – brand value – in which so much is invested, including training employees to deliver their services better than their rivals, is what keeps profit-seeking businesses honest and efficient. It attracts the most valuable type of business, repeat business.
Perhaps, given their knowledge and experience, the regulators and compliance officers that would be rendered unemployed should my proposal come to pass, could be converted into useful predictors of the ability of potential borrowers to deserve the credit on offer. Identifying much more accurately and easily the credit rating of any potential borrower would allow for well-targeted, attractive offers of credit – perhaps initiated at very low cost over the internet. Credit markets are particularly well-placed to apply the new science of big data management that is revolutionising all business.
There is a long history of limiting (defined as usurious) interest rates that may be charged to borrowers, which has disturbed and complicated the contracts borrowers and lenders agree to – and in turn has encouraged regulation of these complicated terms. If lenders were free to declare all revenues they expect to receive from a borrower as simply interest or capital repayment, at whatever rate agreed to, borrowers could easily make comparisons of the costs or benefits on offer. This is the case when a motor car is leased for a monthly payment. How much of this payment pays for the car and how much for the motor plan is irrelevant to the driver. It is simply a question of how much car the monthly payment buys. The benefits of the transaction to the motor dealer, the lessee and the lessor are bundled into one convenient monthly payment. We do not pay a hotel separately for towels, linen, or air conditioning – ‘free’ breakfast may even be included in the daily rate. And no regulator (yet) tells the hotel to itemise its menu or what services they are allowed to charge for and how much they can charge
The National Credit Regulator however allows the lender only clearly defined fees and payments that include the repayment of the principal debt; an initiation fee, a service fee, interest, the cost of any credit insurance, default administration charges and collection costs. It has argued that a fee charged to retail customers to join a club of customers cannot be levied. The jury or, rather, the judges are out on this one.
Club fees, delivery, insurance or other charges are all contributions to the lender’s revenue, in addition to interest payments that are controlled. Reducing the lender’s ability to raise revenues from explicit interest charges or to protect themselves with capital repayments leads inevitably to a complicated array of fees to supplement interest received. Restricting the flow of revenues therefore means less credit supplied to well- qualified borrowers. This is an unsatisfactory outcome that an unregulated credit market would overcome. 7 July 2017
Slides: Get South Africa growing
Rand strength surprise
A shorter version of the below article was published in the Business Day – Available here
The rand does not always perform as expected, thanks to the US dollar, to which we should always pay close attention
Rand strength almost always surprises the market. The large spread between SA interest rates and US or other developed market interest rates indicates that the market expects the rand to weaken consistently against the US dollar and other developed market currencies. By the close on 18 July this spread for 10 year money was 6.43%. To put it another way, the rand was expected at that point to lose its exchange value in US dollar at the average annual rate of 6.43% over the next 10 years.
This difference, or interest carry, is also by definition the annual cost of a US dollar or euro to be delivered in the future. And so, the forward rate of exchange for the USD/ZAR to be delivered in a year or more always stands at a premium to the spot rate. This year, the daily interest spread on a 10 year government bond has varied between 6.4 and 5.94 percentage points while the USD/ZAR has varied between a most expensive R13.20 to a best of R12.42, using daily close rates of exchange. It should be noticed in figure 1, that while the interest spread- or expected exchange rate has a narrow range – the two series move together. That is a stronger rand leads to less rand weakness expected (less of a spread) and vice-versa.
Another way of putting this point is that the weaker the rand the more it is expected to weaken further and vice versa. This is not an intuitively obvious outcome. Normally the more some good or service falls in price the more, not less attractive it becomes to buyers. This is the case with developed market exchange rates – dollar strength vs the euro tends to narrow the carry. But this is not the case with the rand exchange rate and perhaps also other emerging market exchange rates. For the USD/ZAR exchange rate, rand weakness is associated consistently with still more weakness expected and vice versa as figure 1 and 2 indicates. It would seemingly therefore take an extended period of rand strength to improve the outlook, as indeed was the case between 2003 and 2006 when the spread narrowed to about 2% with significant rand strength (See figure 2).


While a more favourable direction for the USD/ZAR may well come as a surprise – the explanation of rand strength or weakness should be more obvious than it appears to be, judged by much of the commentary offered on changes in the exchange value of the rand. The reality demonstrated below is that the behaviour of the USD/ZAR exchange rate to date has had much less to do with South African events and political developments and much more to do with global forces than is usually appreciated. And such global forces affect the exchange value of the rand and other emerging market currencies in similar ways.
Unless the future of SA economic policy is very different from the past, this is still likely to still be the case in the months ahead. In other words, rand strength or weakness in the months ahead, will have a great deal more to do with what happens to the US economy and the strength or weakness of the US dollar against other major currencies, than political and economic developments in SA. Predicting the USD/ZAR accurately therefore will require an accurate forecast of the US dollar vs mostly the euro, and also to a lesser extent the yen, the Swiss franc, the Swedish kroner and the Canadian dollar.
We show below in figures 3 and 4 below how the USD/ZAR exchange rate moves closely in line with those of other emerging market (EM) currencies. Furthermore it is also shown how all EM currencies strengthen when the USD weakens against other major currencies and vice versa. That is US dollar strength vs its peers is strongly associated with EM exchange rate weakness generally and so also USD/ZAR weakness.
In the correlation matrix below, using daily data from 2012, it may be seen that the correlation between the trade weighted US dollar vs developed currencies, and the JP Morgan Index of emerging market currencies is a high and negative (-0.82) (dollar strength = emerging market weakness) The correlation of the US dollar with our own emerging market nine currency basket (US dollar/EM) that excludes the rand, is even greater at ( 0.98) The correlation of daily exchange rates between the USD/ZAR and the trade-weighted dollar index is (0.89). In other words, the stronger the trade-weighted dollar, the higher its numerical value, the more expensive the US dollar has become. As may also be seen in the table below, the correlation between the USD/EM nine currency basket and the USD/ZAR is also very high (0.95).
These relationships are also indicated in figures 3 and 4 below. In these charts the trade-weighted dollar in these figures is inverted for ease of comparison – higher values indicate weakness and lower values strength. It may be seen that US dollar strength after 2014 was closely associated with emerging market and rand weakness. Very recently, since June 2017, it is shown how a small degree of US dollar weakness has been associated with emerging market and rand strength.


In figure 4 below we show the ratio of the USD/ZAR to our Investec nine currency basket (USD/EM) since 2012. This ratio (2012=1) widened sharply after President Jacob Zuma sacked Minister Finance Nhlanhla Nene, only bring in Pravin Ghordan a few days later. This ratio then narrowed sharply after the second quarter of 2016, indicating much less SA-specific risk was gradually being priced into the rand.

(The nine currencies: Equally weighted Turkish lira, Russian ruble, Hungarian forint, Brazilian real, Mexican, Chilean and Philippine pesos, Indian rupee and Malaysian ringgit.)
The second Zuma intervention in March 2017, when Gordhan was in turn sacked by Zuma, had less of an impact on the relative value of the rand. In figure 5 below, we show a close up of this ratio in June and July 2017 after the independence of the SA Reserve Bank was called into question by the SA Public Protector, Busisiwe Mkhwebane. The ratio initially widened on the statement by the Public Protector, to indicate more SA risk. But the rand and its emerging market peers both strengthened as a result of a degree of US dollar weakness against the other major currencies, as is shown in figures 5 and 6 below.


Given the history of the USD/ZAR it should be appreciated that betting against the rand at current rates is also mostly a bet on the value of the US dollar vs the euro and other developed market currencies. Hence the causes of dollar strength or weakness needs careful consideration. The US dollar strengthens US growth beats expectations, leading to higher interest rates in the US relative to growth and interest rates in the likes of the Eurozone as well as to US dollar strength. Emerging market currencies and the rand can be expected to weaken in this scenario. A weaker US dollar and stronger euro will tend to have the opposite effect, as we have seen recently.
Relatively slower US growth and a more dovish Fed can be very helpful to emerging market exchange rates (like the rand) over the next few months. This is providing the political economy of SA is not to be radically transformed. The financial markets, judged by the ZAR/EM exchange rate ratio and the yield spreads, are currently strongly demonstrating a belief in policy continuity in SA. 19 July 2017
Separating the influences of politics and economics
These are fraught times for South Africans. The Public Protector has attacked the constitutional protection provided to the Reserve Bank and the inflation targeting mandate prescribed for it by the Treasury. The (false) notion of white monopoly capital – introduced to counter the critics of state capture – has become a constant refrain and irritant to white South Africans who play such a crucial role in our economy. The tale of corruption at the highest levels of the state is being continuously reinforced by extraordinary revelations out of cyberspace.
They further drain the confidence of businesses and households, whose reluctance to spend has led the economy into recession. The election of a new head of the ANC and presumptive President is being be contested on the issue of corruption and who bears the responsibility for it.
The ANC is currently debating economic policy. Appointed economic commissions have debated the issues and will reveal soon just how the governing party’s economic policy intentions have changed.
These uncertainties could be expected to influence the value of the rand and of SA equities and bonds listed on the JSE. Such would appear to be the case with a recently weaker rand and upward pressure on bond yields. JSE-listed equities, when valued in rands rather than US dollars, may behave somewhat differently in response to SA political risks. Given that many of the companies listed on the JSE (with large weights in the calculation of the All Share and other indices) derive much of their revenues and incur much of their costs outside of SA, their rand values tend to benefit from rand weakness, especially when this is associated with additional risks specific to South Africa. There are other risks to the share market that are common to the global economy and emerging markets generally. These forces are likely to effect the US dollar value of these companies, mostly established on offshore stock markets that are then translated into rand values at prevailing exchange rates. Rand strength since mid-2016 has been associated with improved global economic prospects identified by higher commodity and metal prices and increases in the US dollar value of emerging market (EM) equities generally.
It is possible to identify SA-specific risks by observing the performance of the rand relative to other EM currencies. Further evidence can be derived from the spreads between RSA bond yields and the equivalent yields offered by developed market governments and other EM issuers of US dollar-denominated bonds. We provide such evidence in figure 1 below.
It should be appreciated that bond yields in the US and Europe all kicked up very sharply last week (Thursday 29 June) after ECB President Mario Draghi indicated a much more sanguine view of the outlook for growth and inflation in Europe. The prospect of higher policy-determined interest rates accordingly improved, as did the likelihood of an earlier, rather than later, end to quantitative easing (QE) in Europe and its reversal, or tapering. This led to a degree of euro strength and dollar weakness – but as we shall see EM currencies, not only the rand, lost ground to the weaker US dollar. An early hint of US tapering in 2013 had led to US dollar strength and EM currency weakness and the responses in EM bond markets did have a mild hint of these earlier taper tantrums, as we will demonstrated. Better news about US manufacturing this week helped the US dollar recover some of its losses against the euro. Late on Friday (30 June) the euro was trading at 1.1426 – early yesterday (5 July) it was being exchanged at 1.132.
As we show in figure 1, the USD/ZAR exchange rate has moved mostly in line with the EM currency basket since 20121. The rand is well described and explained as an EM currency. As demonstrated by the ratio of the rand to the EM basket, the rand did relatively poorly for much of the period under observation, and especially after the first President Jacob Zuma intervention in the SA Treasury in December 2015. Then the rand, at its worst, weakened by as much as 25% more than had the average EM currency.
However through much of 2016, the rand did significantly better against the US dollar than the EM basket, with the ratio ZAR/EM (1 in 2012) back again to 1 in 2017, indicating less SA-specific risk. However the second Zuma intervention, the sacking of Finance Minister Pravin Gordhan in March 2017, reversed some of this improvement in the relative performance of the rand against other EM peers – but then was followed again by a degree of further rand strength compared to the EM average.
This improvement in the relative value of the rand was interrupted again in modest degree towards 27 June, as we show more clearly in figure 2 below. The ratio of these exchange rates, based as 1 in early 2017, was 1.02 midday on 5 July. However at the time of writing (late 5 July) the rand has weakened further against the US dollar and the other developed market currencies and presumably also against other EM currencies.
The impact of the most recent news flow, including the news leak on the morning of 5 July that the ANC had called for state ownership of the Reserve Bank, led to about a 1% decline in the rand against other EM currencies by midday yesterday, 5 July. By then the USD/ZAR had weakened from an overnight R13.2 to R13.398, with more weakness following. The EM currency basket had also weakened that morning of 5 July but by only about 0.42% against the US dollar. It should be recognised that much, of the rand weakness in 2017was caused by global forces reflected widely in the EM financial markets.
We await further news about the resolutions adopted by the ANC gathering and pointers to the election of a new ANC leader. The interpretation of these political developments will reveal themselves in the financial markets in the same direction as they have to date. The change in ownership of the Reserve Bank is symbolic and without operational substance. The operations of the Bank are determined entirely by the executive directors and managers who are appointed by the State. The 600 private shareholders (of whom I happen to be one with 100 shares), receive a constant predetermined 4% annual dividend and have the right only to appoint seven of the central bank’s 10 non-executive directors and to attend the AGM. But as we have noticed, symbols have significance and do point to the future direction of economic policy. Any threat to Reserve Bank independence or to fiscal conservatism is a threat to the rand and to the bond market, but less, as we point out below, to the rand value of the equity market.


When we turn to the bond markets a similar picture emerges: a modest increase in the SA risk premiums in late June and early July. Long term interest rates have all moved higher in response to the words of central bankers in Europe. However the spread between RSA yields and US yields has not widened materially, perhaps by only 8 basis points.
This spread incidentally is now as low as it was in early 2015, despite the downgrading of RSA debt by the rating agencies. It may be concluded from these generally favourable developments in the currency and bond markets, that the market is discounting the threat to SA’s economic policy settings posed by President Zuma. The market may well have been anticipating the end of the Zuma presidency.


The spread between RSA and other EM bond yields has also been well contained – despite political developments in SA. The five year RSA Yankee bond’s Credit Default Swap (CDS) spread vs the US – very similar to the spread between the RSA Yankee bond yield and the Treasury bond yield – has moved marginally higher. The spread between other high yield EM and RSA CDSs has narrowed marginally, indicating a somewhat less favourable (relative) rating for RSA debt in recent days. RSA CDS swap spreads over US Treasuries are compared below in figure 6 to those applying to dollar denominated bonds issued by Turkey, Brazil and Russia. Little change in EM credit ratings, that is what it costs to insure such debt against default, can be noticed.


JSE-listed equities by contrast have significantly underperformed their EM peers in recent weeks, as may be seen in figure 7 below. The strong rand has been a head wind for the JSE, given the preponderance of companies with offshore exposure and whose US dollar values are determined on offshare markets and translated into rands at prevailing exchange rates. Over the longer run the US dollar value of the JSE and the EM benchmarks track very closely, helped by similar exchange rate trends as well as earnings trends.
The SA economy plays on the JSE have not yet had the benefit of lower interest rates that usually accompany a stronger rand and lower inflation. So what has been a headwind for the rand values of the global plays has not yet turned into a tailwind for the SA economy plays: the retailers, banks and especially the mid- and small-cap counters that have trailed the market in general.
A cyclical recovery of the SA economy cannot occur without reductions in short term interest rates. One can only hope that the Reserve Bank does not wish to assert its independence of politics by further delaying reductions in interest rates. These are urgently called for and have every justification, even given its own very narrowly focused inflation targeting modus operandi, of which incidentally, I have also been highly critical of. 6 July 2017
1 Equally weighted Turkish lira, Russian ruble, Hungarian forint, Brazilian real, Mexican, Chilean and Philippine pesos, Indian rupee and Malaysian ringgit.

*The views expressed in this column are those of the author and may not necessarily represent those of Investec Wealth & Investment
An exercise in persuading South Africans that a much better economic way is open to them
My book Get SA Growing (Jonathan Ball 2017) hopes to persuade South Africans that there is a clear and highly realistic way out of our poverty trap. And that is to let all our people exercise much more freedom to help themselves improve their economic circumstances. Or in other words for the economy to rely much more on highly competitive market forces, to determine output, incomes, jobs and wages. There is overwhelming support from economic history, especially from the recent immense poverty reduction achievements of many Asian economies, of how it is possible, using the power of the market place, to lift billions of people out of absolute poverty.
South Africa could be playing much more helpfully to its objective strengths – and that is the competence and competiveness of established businesses and new entrants to business to effectively deliver goods and services and employment and incomes. And are highly capable of doing much more for their stakeholders. Not only for their owners, but for their numerically much more important customers and employees. And their owners, often pension and retirement funds who manage most of our savings, are rapidly becoming as racially representative of the work-force. Something ignored so opportunistically by the politics of empowerment.
The book tries to build trust in and respect for market forces by examining and explaining what goes on in our economy and how and why it could be better organized for the benefit of nearly all of us- and especially the many desperate poor. It is written by an economist for my fellow South Africans who share my frustration with our economic failure.
We should have more respect for the rights of individuals to make their own decisions and bear the consequences of them. And we should not allow adults who have the power to elect their government to be treated as if they were children in need of close supervision- an assumption often convenient for politicians and the officials who direct government spending on their behalf. Private providers of goods and services, now supplied by government agencies, would treat people much more as valued customers rather than as supplicants.
Privatization of the delivery of benefits – currently funded by the taxpayer – would produce much better results- especially in education – where the spending and tax burden is a heavy one and the outcomes so disappointing. The extra skills that would command employment and higher incomes are simply not emerging nearly well enough. Radical reforms are required that would make public schools and hospitals private ones. And convert public enterprises into more efficient private ones that would not convert losses and poor operating procedures into ever increasing public debts. Privatization could be used to pay off the expensive public debt.
A much greater reliance on and encouragement for the free play of market forces is called for in South Africa Much less should be expected from well-meaning national development plans or from even honestly governed state owned corporations to deliver the essential jobs and goods and services. Perhaps even more dangerous to the well- being of all South Africans would be to provide even greater opportunity for doing government business, funded by taxpayers, on highly favourable (non-competitive) terms with the politically well-connected few. The newly promulgated Mining Charter is an exercise in extreme crony-capitalism that will undermine the future of mining in SA and its ability to create incomes, jobs and tax revenues.
Faster economic growth would be truly transformational. Building on the strengths we have- on our skilled human capital that is globally competitive – and so very vulnerable to emigration – and on the proven ability to raise financial capital from global markets when the prospects are favourable – faster growth would greatly stimulate the upward mobility of an increasingly skilled black South Africans. The upper reaches of the economy could soon become as racially transformed as have the ranks of the middle income classes. And the very poor and less skilled (now mostly not working) would benefit greatly from increased competition for their increasingly valuable and scarce services. Forcing transformation of the leaders of the SA economy would have the opposite effect. It would mean further economic stagnation and increased resentment of higher income South Africans.
The hope is that the book will make it more likely that the economic future of South Africa will be decided in a less racially charged way- with more reliance on meritocratic market forces. South Africa in fact undertakes an extraordinary degree of redistributing earned incomes, unequal because the valuable skills that command high incomes are so unequally distributed. That is unusual amounts of income is currently taken from the very well off to fund government expenditure – judged by the practices of other economies with comparable incomes per head. But economic stagnation has now severely limited the capacity to help the poor. More of the higher incomes that come with growth can then be redistributed to the least advantaged -hopefully with much more help from private suppliers of the benefits provided. Growth and redistribution is very possible for South Africa- should we change our ways and grow faster – as the book hopes to persuade South Africans to do.
Interpreting the political messages from cyberspace
Cyberspace has revealed the modus operandi of a group of SA businesses that have excelled (if that is the right term) at doing business with the SA government. We now know just how profitable these favoured procurement exercises have been.
The large modern state, which includes state owned business enterprises with genuine monopoly powers, has significant economic powers to contract for goods and services from private suppliers. Such contracts, we would surely agree, should be determined in an objective way and be subject to genuine competition for such potentially valuable business opportunities.
If objectivity is not to be the guiding principle, the waste incurred is not only in the form of hard-earned tax revenues or borrowing powers supported by the tax base. It also means a sacrifice of the alternative benefits that might have been better provided for – including spending on the least advantaged of society. That officials of government, responsible for such negotiations, might directly benefit from such contracts, is always a possibility, to be guarded against by appropriately vigilant and transparent procedures.
Government practice, anywhere in the world, does not always conform to best practice. A case can therefore be made for not only better, and more honest government, but also for less government. This argues for a smaller, less intrusive role for government as a supplier of goods and services (as opposed to funder of benefits). This would leave space for private hospitals or private schools, for example, to compete for demanding patients or pupils, funded partly or fully by the taxpayer. It would also call for the privatisation of public enterprises, with the proceeds used to pay off government borrowing.
In some societies the degree of corruption can be such as to not only destroy the practice of good government itself, but to undermine the efficiency of the greater economy. Economic growth itself, of the inclusive kind, becomes much more difficult to realise and is replaced by exclusive growth that benefits mainly those in power and their politically-favoured hangers on.
One term that describes such a failing economic system is ‘state capture’. Another is crony capitalism. South Africa is in grave danger of more crony capitalism and of undermining the growth prospects for our economy and benefits for the poor that a competitive market led economy could deliver.
Cyberspace has also revealed that the notion of ‘white monopoly capitalism’ is a creation of a PR company employed by the same group of SA businesses that have benefited so greatly from state largesse. But the notion of white monopoly capital is a politically and racially charged canard. It is an attack on well-established enterprises that compete actively and effectively for customers and employees, and which effectively service their stakeholders – who are mostly black South Africans. If these enterprises are JSE-listed enterprises, their shareowners will be pension or retirement funds, the beneficiaries of which will increasingly be black South Africans. It is convenient for crony SA capitalists and their supporters to ignore such ownership claims in conventional measures of empowerment.
Any constraints on these established businesses to compete freely for customers, skills or capital will harm their many owners, customers and employees. It will also harm the employment and income prospects of many poor South Africans. And by reducing the growth of the economy, they limit the tax base that could be used to support them.
How Orwellian it is to find the enemy in established businesses that are the most capable and competitive element of our economic structure. Arguments are raised to increase the scope for crony capitalism, rather than diminish it. The newly released Mining Charter is unfortunately a charter for more crony capitalism. However its terms of engagement make it very unlikely that more capital will be allocated to risky exploration or mining developments. Giving up 50% or more of the upside in any venture, for no protection on the downside, is a severe impediment to risk taking. Not only will potential employment or income or taxes from mining in SA be sacrificed, the very few intended beneficiaries (the potential cronies) will find the takings hard to realise – if there is no investment. 23 June 2017
The views expressed in this column are those of the author and may not necessarily represent those of Investec Wealth & Investment.
The author makes the full case for genuine capitalism in South Africa in his recently published book, ‘Get South Africa Going’ – Jonathan Ball Publishers, Johannesburg and Cape Town, 2017.
Get South Africa Going
My book has been published. ( See below for details ). It should be available in the book stores and on-line very soon. The chapter outline included in the Foreword is shown below.
Get South Africa Growing
Jonathan Ball Publishers
Johannesburg and Cape Town
Brian Kantor
Published in South Africa in 2017 by
JONATHAN BALL PUBLISHERS
A division of Media24 (Pty) Ltd
PO Box 33977
Jeppestown
2043
ISBN 978-1-86842-763-5
ebook ISBN 978-1-86842-764-2
Chapter outline
In the first chapter, I address the current very unsatisfactory state of the South African economy seen as a whole – the macro environment – and what might be done to improve it. I accept that the global economy has made it more difficult for our economy to grow faster in recent years and I consider what more favourable cyclical forces might spark faster growth. But, I would argue that our problems are not with our stars but with ourselves, and while the challenge to government is to live within the taxpayer’s means, it is a call for not just more competent government but also less government.
In Chapter 2, I make the argument for market forces properly understood – why they are fair to the participants in markets while delivering the goods, services and incomes that people want more of. I make the case for the market meritocracy and why much greater reliance on the free play of market forces is called for in South Africa. As support for this contention, I refer to the proven ability of these market forces, of individuals given essential freedom and encouragement to pursue their economic interests and protection of their gains, to lift billions of people out of absolute poverty in recent years. The global economy bears witness to an unprecedentedly successful poverty relief programme that deserves greater recognition appreciation than it has received and emulation for other economies playing catch-up. The chapter attempts to do this.
Chapter 3 attempts to answer a burning question: given its well-demonstrated achievements, why do these market forces, and the business enterprises that are their prime instrument, not receive more approval? Why are they so often regarded with hostility rather than respect? Why are they regarded as opposed to the economic interests of the many they serve, thought capable of dishonesty unless proved otherwise, rather than the other way around – recognised as beneficent forces for economic progress, unless in exceptional cases proved otherwise? In doing so I challenge those with these attitudes to perhaps reconsider their motives and to change them – so that markets in this country can more easily get on with their important task of delivering goods, services, incomes and jobs in abundance.
Chapter 4 provides further exhortation to South Africans and arguments to back up this essential view of the world and how it works. It attempts to explain how we as a society would do much better to focus on the growth in incomes and wealth rather than their redistribution. The danger to the growth opportunity is redistribution – redistribution not necessarily to the poor that are deserving of assistance, but to the better-off with a strong sense of opportunity. Opportunities that can advance the economic welfare of a privileged minority but are taken at the expense of a better functioning economy and are often to the disadvantage of the objectively poor and disadvantaged. More redistribution – taking from the more successful to give to the economically less successful – inevitably follows economic growth. It has always done so, as the history of other economies reveals. But it is vital to get the sequence right and not to let redistribution – of which we already do significant amounts – get too much in the way of faster growth by undermining the incentives of enterprising and efficient individuals to contribute their skills and assets to the economy. Discouraging rather than encouraging such individuals means that they could easily decide to supply their services to other economies rather than ours.
Chapter 5 and 6 look more closely at the labour market and at policies for regulating the South African economy and encouraging competition. Chapter 7 examines competition policy in more detail and looks at why activist policies are not good for business and so the economy. My scepticism about the beneficence of such policies will be apparent, as will hopefully the reasons for my critique. I hope that public opinion will share such views and help inhibit the ever-flowing tide of more onerous regulation and more active competition policy, which discourages rather than encourages economic efficiency in a world of continuous innovation that effectively threatens what are temporary powers to control markets.
Chapter 8 shares insights about the all-important role played by privately owned corporations and the stock exchanges that help them raise capital and monitor their use of capital. I analyse the sources and uses of savings in South Africa and why our corporations have succeeded, on both sides of the saving–investment nexus, for their owners, who are mostly members of pension and retirement funds and collective investment schemes. I celebrate the opportunities that South Africans, the pension funds that act as their agents for acquiring wealth, and the companies that they own on their behalf have been given in recent years to diversify their wealth across other jurisdictions. I explain why being able to reduce South Africa-specific risks to the wealth of South Africans has been very helpful to the economy. This has encouraged risk-taking in South Africa rather than elsewhere. This chapter also discusses the costs and benefits of black economic empowerment (BEE).
To conclude, Chapter 9 supports the thrust of my argument by turning to measures of South African economic performance. It considers how South Africa ranks relative to our competitors in the global economy. The measures of our standing in the world are mostly very discouraging – and encouraging of reforms that would add freedom and competitiveness and enhance both incomes and standing, as well as respect for our economy as a place to do business.
The text is supplemented by shorter essays, entitled ‘Point of View’, previously published on my www.zaeconomist blog and elsewhere, that substantiate and concentrate the argument without repeating too much. If you like, they offer a short reinforcement of the message.
Brian Kantor
February 2017
Why property rights matter – and could matter more
I recently asked a class of senior law students what they thought the purpose was of all the laws that protect property (wealth or assets or capital by other names) against theft, fraud or seizure, including by the state, and the purpose of the many laws that facilitate the exchange of assets.
The students did have a sense of the fairness of such laws protecting owners. They did not recognise the importance of the economic incentives at work: that unless rights to property were exercised, there would be little incentive to create wealth; to save, to build and to sacrifice immediate consumption for later benefits for society at large.
Who would wish to save up to build a house or a business or improve a tract of land, providing goods, services and incomes to others, if someone more powerful could move in and take over? But I also pointed out that the value of assets owned can be severely damaged by regulations of their use (perhaps of net benefit to society at large) for which compensation is seldom allowed by the courts. I spoke of the proverbial little old lady and her children whose only meaningful asset is a house, whose value is much diminished by declaring it of historical interest – for which compensation could be offered but in practice is never offered or awarded.
I made the point that property rights or their absence (or the dangers of regulation of the use of assets) would be reflected in the market value attached to such always vulnerable assets. Threaten for example a wealth tax or a mining tax and the value of assets and the incentive to create wealth will be undermined in ways that are very likely to harm the poor.
But the state not only has the power to take wealth, it also exercises the power to take from wealth or income from some and give it to others. South Africa has supplied very large numbers of houses to essentially lucky recipients – lucky because the waiting lists for gifts of this value are very long and will never be exhausted. The numbers of such interventions in the housing or accommodation space are not known with certainty, nor is it fully known what happens to the houses once handed over.
The important question is how should the value of these gifts of housing or land or low rentals be best protected by law? Protected surely best by full rights of ownership attached to them, as is the wealth protected when created through the sacrifice of consumption or the sweat of a brow. Living in a potentially valuable home without food on the table has little logic to it. Effectively exchanging the house for more food and cheaper informal shelter may be a sensible choice to make. Leasing out and combining small parcels of farming land can provide a better standard of living for its new owners than subsistence farming on it.
Our laws that most unfortunately restrict property rights – for example that only allow the transfer of RDP homes after eight years of occupancy or prevent formal rental contracts – accordingly leads to widespread losses and waste. To houses that exchange hands at far less than their cost or potential and that can never form part of any inheritance or tax base. To potentially valuable farms that become wastelands.
We should make all transfers of government assets to private ownership immediately come with full rights of ownership. And we should be making every effort to convert currently fallow government owned and tribally managed land to private ownership with full rights, whoever are the initial beneficiaries. This will then allow the market place take over to make the best use of these assets. The impact on the economy will be as favourable for the creation and preservation of wealth and the generation of extra incomes in SA, as secure property rights always prove to be. 28 April 2017
When Zuma goes
Click here for a shorter version of this article
There will be good economic reasons for rejoicing should he go. The rand would strengthen – it would move back into line with its emerging currency market peers. Today this would have meant a USD/ZAR of approximately R12.6. Yesterday, April 12th a day of protest and a day when the probability of Zuma going sooner rather than later improved, saw a basket of EM currencies gain seven cents vs the weaker USD while the ZAR gained 34 cents, indicating less SA specific risk priced into the rand.
If the rand maintains these better values lower inflation will follow the lower costs of imports and the lower prices for exports and would bring lower short term interest rates in its wake. Cheaper than otherwise goods and services and credit would encourage households to spend more- as would the higher house prices and equity in homes that accompany lower mortgage rates and a more hopeful outlook for South Africa. And the firms that supplied them would be much more inclined to add, rather than contract capacity and hire more rather than fewer employees, as they are now doing. The SA business cycle would turn up rather than down.
The yield on longer dated RSA debt would also tend to go back to where it was, reducing the cost of servicing our national debt –easing the burden on SA taxpayers and opening up the possibility of more help for the poor and improve the prospects of growth friendly, lower tax rates. The first Zuma attempt to control the Treasury in December 2015 took the yield on RSA 10 year bonds from 8.5% p.a in early December that year to about 9.6% by early January 2016. This move also widened the spread between RSA and US debt by about the same 100bp ( see figure below) from about 5.7% p.a to 6.7%. The latest Zuma intervention in the Treasury has seen this risk premium rise further, but not dramatically, from a still unsatisfactory 6.46% level in early 2017 to the current 6.6% p.a level.
The ZUMA factor driving SA risk
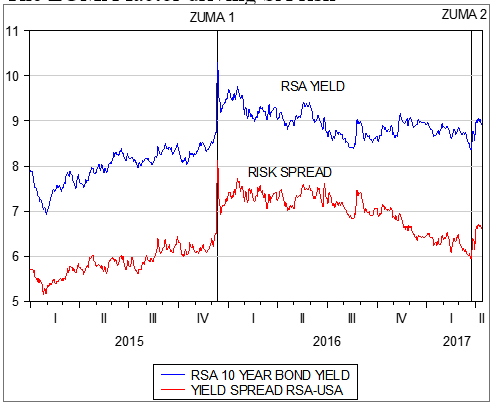
Source; I-net Investec Wealth and Investment
This spread may be regarded as the SA risk premium, the extra returns in rands, all South African investments have to be able to offer to justify their viability – in addition to their covering the additional business risks associated with a particular enterprise. This extra return is also the rate at which the rand is expected to depreciate over the next ten years. And the weaker the rand the more inflation expected. The Zuma interventions have understandably have resulted in the rand being expected to lose dollar value at a faster rate and so also, in a consistent way, to increase the expected inflation rate. The market place understandably expects a weakened Treasury to be less able to control government spending and less conservative in how such spending is funded. That is less able to raise taxes and less willing to pay ever higher rates of interest on its debts and so more inclined to print money, an approach that would be clearly inflationary.
Another way of measuring risks would be to convert the calculation of required returns and risk into to much less inflationary USD. The yield on US dollar denominated debt issued by the SA government provides an appropriate bench mark for measuring required risk adjusted returns on South African assets. As we show below these dollar yields rose significantly from around 3.6% in early 2015 to as much as 5.12% p.a. by year end. Since then this rate has receded but increased by a significant 36bp since mid- February. The cost of insuring SA 5 year dollar denominated debt against default, an accurate measure of real sovereign risk has followed a similar pattern rising from 1.82% p.a at its lowest in 2017 to the current 2.15% p.a. That is when converted into USD an investment in a South African asset would be required to return over 2% p.a. more in USD than an equivalent US investment to justify its value.
Zuma risk measured in USD
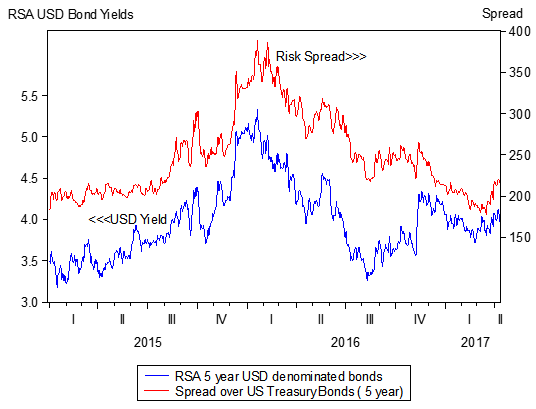
Source; Bloomberg, Investec Wealth and Investment
More risks demand higher returns (sometimes described as the hurdle rate capital raisers have to leap over) and the higher the required returns the fewer investment projects will qualify – to the grave disadvantage of the economy and its growth prospects. The object of economic policy should be to reduce such risks rather than to raise them- something the Zuma presidency has clearly failed at.
These required returns that add business risk to sovereign risk may also be regarded as the discount rate used to present value any flow of income from businesses or government agencies. The higher the discount rate attached to SA assets the less they are worth. Adding risk makes SA immediately poorer as well as undermining their income prospects as less is invested in SA projects that could add to incomes and demands for labour.
Yet given the reactions of the credit rating agencies that have down rated SA credit indicating a higher probability of default on our debt these market reactions as we have identified them must be regarded as surprisingly subdued.
The rand, and the market in RSA bonds, clearly benefit to a degree from the prospect that Zuma might not survive the campaign to remove him. Were Zuma certain to stay rather than possibly go, we would be facing even more risk aversion more inflation expected, higher interest rates and a very likely recession as confidence in the prospects for the SA economy ebbed away.
Were Zuma to go the benefits could extend well beyond the promise of a revival of fiscal rectitude and less inflation and lower interest rates. It would offer the prospect of a radical economic transformation. By which I mean the cleaning of the Aegean stables that the State Owned Companies (SOC’s) have become. It would not require any Hurculean effort to do. A few investment bankers could do the job of converting the SOC’s into ordinarily valuable and well managed business. So converting them into assets from their current state of very expensive and potentially ever larger liabilities, that SA tax payers and consumers have to cover. Converting these burdens into private businesses that will compete for their custom, that will be run efficiently and deliver their goods and services at lower competitive prices – as business have to do to survive the market test would be a large plus for South Africans. And they would become taxpayers rather than incur vast contingent liabilities that damage our credit rating and raise our costs of finance.
Can any SA seriously believe that these SOC’s are essential to the purpose of developing the SA economy? Or fail to understand that their actions are driven by the narrow interests of their managers and employees and what their suppliers can extract from them. Their monopoly powers that make this behaviour possible need to be removed by breaking them up into smaller units by selling off their assets to a variety of owners and operators. And the capital to fund these purchases will be abundantly available from domestic and foreign capital providers at market determined values.
The proceeds from their privatization could be used to pay of much of SA’s debt and dramatically reduce the interest burden of serving it and open up the prospect for genuine poverty relief. This transformation – turning great weakness into strength – would help raise the growth potential of the SA economy – and truly transform the economic prospects of all South Africans
When Zuma goes
There will be good economic reasons for rejoicing should President Jacob Zuma relinquish his post in the near future.
The rand would in all likelihood strengthen and would probably move back into line with its emerging currency market peers. Today this would have meant a USD/ZAR exchange rate of approximately R12.60.
Lower inflation will follow a stronger rand and bring lower short term interest rates in its wake. Cheaper goods and services and credit would encourage households to spend more, as would the higher house prices and equity in homes that accompany lower mortgage rates and a more hopeful outlook for South Africa. And the firms that supplied them would be much more inclined to add capacity and hire more employees. The SA business cycle would turn up.
The first Zuma attempt to control the Treasury in December 2015 took the yield on RSA 10 year bonds from 8.5% p.a in early December that year to about 9.6% by early January 2016. This move also widened the spread between RSA and US debt by about 100bps from about 5.7% p.a to 6.7%. The latest Zuma intervention in the Treasury has seen this risk premium rise further, but not dramatically, from a still unsatisfactory 6.46% level in early 2017, to the current 6.6% p.a level.
This spread may be regarded as the extra returns in rands that South African investments have to be able to offer to justify their viability – in addition to their covering the additional business risks associated with a particular enterprise. This extra return is also the rate at which the rand is expected to depreciate over the next ten years. The weaker the rand, the more inflation expected.
The cost of insuring SA five year, US dollar-denominated debt against default, an accurate measure of real sovereign risk, has followed a similar pattern, rising from 1.82% p.a at its lowest in 2017 to the current 2.15% p.a. When calculated in US dollars, an investment in a South African asset would be required to return over 2% p.a. more in US dollars than an equivalent US investment, to justify its value.
Greater risks demand higher returns and the higher the required returns, the fewer investment projects will qualify – to the grave disadvantage of the economy and its growth prospects. The object of economic policy should be to reduce such risks rather than to raise them, something the Zuma presidency has clearly failed at. Yet, given the reactions of the credit rating agencies, which have downgraded SA credit (indicating a higher probability of default on our debt), these market reactions must be regarded as surprisingly subdued.
The rand, and the market in RSA bonds, clearly benefit to a degree from the prospect that Zuma might not survive the campaign to remove him. Were Zuma to go, the benefits could extend well beyond the promise of a revival of fiscal rectitude and less inflation and lower interest rates. It would offer the prospect of a radical economic transformation. By this, I mean the cleaning of the Aegean stables that the state-owned companies (SOCs) have become. It would not require any Herculean effort to do.
A few investment bankers could do the job of converting the SOCs into a number of ordinarily valuable and well-managed businesses that compete with each other. They would be run efficiently and deliver their goods and services at competitive prices – as business have to do to survive the market test.
Can anyone seriously believe, in light of the evidence, that these SOCs with monopoly powers are essential to develop the SA economy? Or fail to understand that their actions are inevitably driven by the narrow interests of their managers and employees and what their suppliers can extract from them?
The proceeds from their privatisation could be used to pay off much of SA’s debt and dramatically reduce the interest burden of serving it, thus opening up the prospect for genuine poverty relief. This transformation – turning great weakness into strength – would help raise the growth potential of the SA economy – and truly transform the economic prospects of all South Africans. 18 April 2017
Can the strong rand be more than a headwind for the JSE?
South African investors on the JSE will be only too well aware that it has moved mostly sideways over the past few years. The performance of the JSE in US dollars however presents a very different picture, given the strong recovery of the rand last year. The US dollar value of the JSE, the focus of foreign investors, fell away badly in 2015 and then recovered strongly in 2016. The JSE All Share Index (ALSI) is now back to its value of early 2014 and 2015 having gained nearly 20% in US dollars since January 2016 as can be seen in figure 2. The rand itself is worth about 20% more against the US dollar – compared to February 2016.


The reason for these very different outcomes, when expressed in different currencies, is obvious enough – it is the result of rand weakness in 2014 and 2015 and its significant strength in 2016-17.
Clearly the very strong rand, up 20% year on year, represents a strong head wind for the value of shares expressed when expressed in rands. Or, in other words, for a share to have provided positive rand returns over the past 12 months, would have had to have seen its US dollar value appreciate by more than the 20% gain in the rand, a very high rate of return.
Naspers, with the largest weight on the JSE of about 17%, delivered coincidentally about a 20% increase in its US dollar value since January 2016. This was satisfactory enough, but not quite enough to provide appreciation in 20% more valuable rands.

Resource companies on the JSE did much better than the average listed company, especially from mid-year. Their US dollar value has increased by about 50% since early 2016, more than enough to provide highly satisfactory rand returns, despite the stronger rand. It may be a source of some confusion to market observers that JSE Resources could do so well, despite rand strength. In other words, Resource companies did not behave as a rand hedge in 2016: in reality they performed as rand plays (companies that do especially well when the rand strengthens).
They would have enjoyed much higher operating margins had the rand been weaker – other things remaining the same – including underlying metal and mineral prices in US dollars. But the rand was strong because underlying metal and mineral prices in US dollars had risen, by more than enough to offset the pressure on operating margins that comes with a stronger rand.
Therefore it is always important to establish the sources of rand strength or weakness. Rand weakness for SA-specific risk reasons can make Resource companies or companies with largely offshore operations effective hedges against rand weakness. Their rand values will go up as the rand weakens because they are selling into world markets where business continues as usual and so earn more rands doing so. The opposite influences are at work on SA economy companies when the rand weakens, especially on the rand and US dollar value of companies with an important element of imported components and inventories. The weaker rand not only crimps operating margins; it means higher prices and less disposable income. More inflation also is likely to bring higher borrowing costs in its wake, further depressing the demand of households and firms. Rand strength for SA-specific reasons will have the opposite effect, all other things equal, including the state of global markets, especially commodity markets. But as we have seen in 2016, other things do not necessarily remain the same for global growth reasons. Resource companies can benefit from higher commodity prices, in US dollars, and from higher metal prices in rands – even when the rand appreciates.

The increased global demand for commodities and for the shares of the companies that produce them not only increased their US dollar values. They also increased the demand for the rand and other emerging market currencies and equities generally that have a strong representation from resource companies. In the figures below we show the rand has moved in line with other emerging market currencies- represented by eleven such currencies all equally weighted in our basket. It is also shown how the rand in 2016-2017 has been stronger than its emerging market peers have been against the strong US dollar, with its recovery from a relatively weak position in late 2015.


Of particular interest is how strongly the USD/ZAR rate has been connected recently to emerging market equities. (In turn the JSE in US dollars is as usual strongly connected to the average emerging market equity as we have shown above). The rand is more than ever an emerging market equity currency. It can be assumed (Zuma permitting) that the rand will continue to move in line with them (see figure 7 below).

Furthermore, emerging market equities will continue to be strongly influenced by the behaviour of commodity prices, as they have been recently. Hence the performance of the rand and other emerging market currencies and equities (in US dollars) in the months ahead will depend on the behaviour of commodity prices. Commodity prices will reflect the pace of the global economic cycle. If this cycle continues in its upward direction, the rand could continue to gain value against the US dollar, provided SA specific risks are not elevated, as they were in late 2015.

Furthermore, if the USD/ZAR remains well supported, SA inflation will recede and short term interest rates will belatedly reverse direction. This combination of lower interest rates and lower costs of imports will be helpful to those listed business dependent on the spending and borrowing decisions of SA households. Their rand earnings will grow faster to help add rand value to their shares, perhaps even enough to offset rand strength. Headwinds from the strong rand can become tailwinds for SA economy-dependent business, as was the case between 2003 and 2008. 2 March 2017
The recent SA business cycle trends may have become friendlier
The SA economy appears to have gone through something of a cyclical trough, judged by the latest statistics for December 2016 (note issue, vehicle sales and CPI) and for retail sales for November 2016. Encouragingly, Reserve Bank notes in circulation at December month-end increased on a seasonally adjusted basis, enough to raise the annual year on year growth to 11.3%. If these trends continue, the note cycle, having pointed lower since Q3 2015, may well turn higher in Q2 2017.

As we show below, the note issue has proved a reliable indicator of retail sales, though the sales cycle may well lead rather than follow the money cycle. This is because the Reserve Bank accommodates the demand for cash that the economy exercises – via the banking system. It has no target for the supply of either cash (so called high powered money) or broader measures of money. Thus, the more households intend to spend and borrow from banks and the more cash that they will wish to hold, the more cash will be automatically supplied to them as the banks borrow the extra cash from the Reserve Bank.
The information supplied by the Reserve Bank on the note issue (available within a week of the month end) however precedes that of the retail values and volumes, so making it a useful leading indicator of retail activity. Retail volumes picked up in November and it is likely (judged by the demand for cash in December) that the better retail trend was sustained by the year end. The retailers themselves, through their trading updates, appear to support this contention of a marginally improved trend in sales under way.

When adjusted for consumer prices, the real money base cycle also appears to support the view that a cyclical trough in the money supply has been reached, or is about to be reached in the near future. If the past cyclical regularities can be relied upon, then the latest trends in the demand for and supply of cash indicate that real retail sales volumes may well increase from a very subdued pace of about 1% p.a. to a still subdued, but faster pace of about a real 2% p.a. by mid-2017. No reason to break out the Cap Classique nor for a stiff brandy and Coke.

As we reported earlier, the new vehicle cycle looks a lot happier if December 2016 unit sales (down over 15% on a year on year basis) are seasonally adjusted. On a seasonally adjusted basis, sales volumes, having declined sharply by mid-year, picked up by year end. Extrapolating these recent trends suggests that vehicle unit sales in SA could be growing (slowly) again by mid-year.

We combine the vehicle sales cycle with the cash cycle to establish our Hard Number Index (HNI) of the immediate state of the SA economy. Given the better news about both the cash and vehicle cycle, the HNI has picked up, reversing to some extent the declines in economic activity registered earlier, as may be seen in the figure below.
We also compare the HNI to the Reserve Bank coinciding business cycle indicator, updated only to September 2016. The HNI and the Reserve Bank may be regarded as well related over the long run. Therefore the HNI, which can be updated very soon after any month end, should be regarded as a good leading indicator of the SA business cycle; and one that appears to be turning up marginally rather than down. The HNI indicates that economic activity in SA in 2017 will show slow but positive growth, perhaps slightly improved on recent slow growth rates.


The HNI also appears to be doing a much better job of predicting the state of the SA economy than the Reserve Bank’s own leading indicator (updated to October 2016). This indicator has continued to turn down, until very recently, even as the economy made some progress. The role the JSE plays in accurately predicting the business cycle (included as a leading indicator by the Reserve Bank) may have changed as the JSE itself has become much less exposed to the SA economy and much more directly affected by global rather than SA economic forces.

The direction of commodity prices will remain important for the state of the SA economy. As may be seen below, the commodity price cycle, as reported by the Commodity Research Bureau in Chicago has recovered, when measured in US dollars, but has largely moved sideways when converted into rand, thanks to rand weakness and then a degree of rand strength enjoyed in 2016. As may also be seen, industrial metals have had a stronger recent run than commodities in general that include a large weighting (over 20%) in oil.

Higher commodity prices – the result of faster global growth – would translate into a stronger rand and inflows into emerging market equity and bond markets, as they have done in 2016. Less inflation and lower interest rates also become more likely with a stronger rand, a force clearly helpful for the SA economy plays, such as the banks and retailers listed on the JSE. Without lower interest rates, leading to a strong recovery in money supply and bank credit, a meaningful cyclical recovery – with GDP growth rates trending higher to above 4% p.a. – will not be possible.
It needs to be appreciated however that the JSE, when seen from offshore, has provided excellent recent US dollar returns since early 2016 – as have emerging equity markets generally.
The stronger rand has yet to lift the SA economy and the SA economy plays listed on the JSE. It will take a changed view on the interest outlook and stable commodity prices to lift the JSE meaningfully. For now however, the market still believes short rates are more likely to increase than decline. Further rand stability and lower food prices will reverse such expectations and in turn the direction the interest rate cycle itself. 24 January 2017
Brand Trump and the US Presidency
Being President can be very good (and honest) business
Donald Trump likes to remind us what a great businessman he is (or rather was). He may be right and perhaps his best business decision was to run for US President. It has greatly enhanced the value of his brand. As they like to say in Hollywood, there is no such thing as bad publicity.
Moreover he did not apparently have to spend much of his own wealth on his triumphant publicity campaign. A generally hostile media provided him with all the exposure he needed and did not have to pay much for. They thought, as did Hillary Clinton, that exposing his exceptionalism would be enough to put off potential voters. As we now know, they were wrong. The daily Trump tweets became the news events of the campaign (and, alas, continue to make the news) and were to his advantage at the polling booths. A tweeting President Trump, like much else of what he will now do and say, breaks the mold and we may well just have to get accustomed to his style (or lack of it).
What he does in office, with the help of his cabinet colleagues and many appointments, will matter more than his Tweets or intentions. The promise of a very different and more encouraging approach than that provided by the Obama administration to doing business in the US has resonated strongly with business – especially small business whose confidence levels are at record highs. Confidence in future income prospects is the most important ingredient in the recipe for more spending by households and firms that will raise US growth rates if it materialises.
Separation of US powers, between the House, the Senate, the states and the courts, is designed to complicate and constrain the realisation of any Presidential agenda or campaign promise. Tax reforms, of which much is expected, are initiated in Congress where much work has been done over the years by the Republican leaders in the House. We, as well as Trump, await with some anxiety the essential details. The implementation of a border tax, or rather a system where costs of imports may be disallowed as a deduction from taxable income, will deserve particular notice. The implications are vast – and not just in the US – and may well threaten the system of corporate taxing practiced everywhere else.
Taxing imports
This border or import tax will be intended to compensate the IRS for a lower corporate tax rate – given the excess of US imports over exports. The lower the corporate tax rate however, the less will any expenditure deduction matter for after-tax incomes. This includes the deduction for interest incurred or capital expenditure, both of which will be subject to debate and possible reform. It will be deemed protectionist by the World Trade Organisation and the US will argue otherwise but irrespectively. Net-net it may mean higher prices in the US but only if net-net taxes have risen for business enterprises in general. That will not be the intention though different businesses will be affected differently in ways that will be worth anticipating. It is effective after tax profits that influence the required returns on capital that have to be recovered in the prices that consumers or customers must pay if the firm is to succeed. Even income taxes find their way into prices.
Managing conflict
President Trump is not bound by the conflict of interest regulations that apply to all others responsible for government business. Trump however has elected to recuse himself fully from the Trump enterprise while President. His sons will run the business and manage the Trump brand. The cry from the anti-Trump brigade is that such arrangements, even should Trump stay fully uninvolved in the decisions made by Trump Enterprises, still represent a conflict of interest. In other words, the Trumps should abandon the Trump business and eliminate the brand, including presumably removing the Trump insignia that currently adorns buildings and merchandise – not a practical possibility. Selling the brand would not have eliminated the connection with the Presidency.
The Trump brand therefore lives on and understandably so given its value, calculated as the present value of the difference a Trump branding can make to rentals or prices that a Trump enterprise or franchisee can realise and pay royalties on. But this does not mean any conflict of interest. The better Trump does in discharging his responsibilities as President, the better his contributions will be appreciated by the public at large and the more valuable his brand will become. The economic interests in his brand and that of the US are well aligned, just as they were well aligned with the Obama brand. The lecture and consulting fees he will now be able to charge depend on the regard in which he is held.
The rand may be telling us something about SA politics
The rand weakened with the market rally and stronger dollar (and higher interest rates) that followed the US election result. Since then the rand has recovered, as some of the Trump impact on interest rates in the US and the US dollar moderated in mid-December. On a trade weighted basis, the rand has gained about 7% from its weakened immediate post Trump level.

The rand has also outperformed a basket of 11 equally weighted leading emerging market (EM) currencies after the Trump surprise. This basket includes the Turkish lira and the Mexican peso, which have been noticeably weak for their own specific reasons, such as the Trump threat to Mexican exports to the US. The rand moreover had gained strength relative to other EM currencies before the Trump election, relative strength that has continued since, as represented by the rand/EM exchange rate ratio.

The rand moreover has also strengthened against the developed market currencies as well as the US dollar after the initial Trump trade. It has also enjoyed a degree of strength vs the Aussie dollar, which can be regarded as a commodity currency.

It may be concluded that the rand has enjoyed a degree of strength for SA specific reasons. It is hard not to conclude that the rand has benefited from the assumption that President Jacob Zuma has become less likely to intervene in economic policy making. Perhaps this is the hopeful message to be read from the behaviour of the rand.
Trump and the SA economy – so far mostly good news
The Trump growth rally that began with his election success appeared to run out of steam in late December 2016. Real bond yields in the US, represented by the yield on a 10 year inflation-linked Treasury Bond reached a recent peak on about the 19 December. These real yields reflect the real cost of capital- the risk free required rate of return to which a premium must be added to compensate for investing in any asset or project with more risk to the expected return. Real rates have been exceptionally low in recent times as world-wide demand for capital to invest in extra capacity shrunk away and as global savings rose. The Trump-inspired increase in real rates portended faster economic growth in the US and the extra demands for capital that can be expected to accompany faster growth.
As may be seen in the figure below, real US rates for 10 year bonds have declined from 0.7% to the current 0.4% yield. This is still significantly higher than the negative real rates investors were accepting in early October. Thus the growth outlook for the US can be assumed to be more promising than it was in October but perhaps not as promising as it appeared in mid-December.
The Trump administration has to deliver on its promises to deregulate and lower taxes and also to bring jobs home. These are prospects that have received particular favour from small business in the US, whose confidence levels have reached record highs, as well as from the customers of the leading banks that apparently are now willing to borrow more. This was noted by bank CEOs reporting earnings on Friday – accompanying generally more favourable operating conditions.
It is this additional confidence of households and business that will influence their willingness to spend and borrow more. Balance sheets of US households have greatly strengthened in recent years, with more saved and more equity in their homes, while lower interest rates have reduced their interest expenses; similarly for business borrowers. It is not balance sheets that will stand in their way of increased spending, but the relative lack of confidence in income prospects.
It will also be of interest to note just how consistent has been the recent behaviour of the gold price in response to real interest rates. Real interest rates represent the opportunity cost of holding gold. The more expensive it is to own gold, the lower its price.

The difference between the lower yield on an inflation-linked bond and that of its vanilla equivalent bond of similar duration (that offers a higher running yield), represents the compensation to investors for taking on the risk that in inflation will prove higher than expected. By doing so it drive up interest rates to compensate for the now more inflation expected. In doing so it reduces the value of the conventional bond. In the figure below we show these recent yield differences, representing inflation expected, over the next 10 years in the US and SA bond markets. Inflation expected in the US has risen consistently before and after the Trump election to about 2% per annum. Real yields in the US have reversed course in the US recently. Inflation expected has continued to increase. The US Fed regards 2% inflation as one of its objectives for monetary policy.
The Trump election raised inflation expectations in SA to over 7%. Very recently, as the Trump rally faded, inflation expected in SA over the next 10 years, as revealed in the RSA bond market, has receded sharply to below 6.5%. This must be regarded as helpful for the SA economy. The Reserve Bank has a highly exaggerated view of the influence of inflation expectations on inflation itself. This retreat in inflation expectations as well as a much improved outlook for inflation itself may encourage the Reserve Bank to reverse the course of short term interest rates – an essential requirement if growth in SA is to pick up momentum.

The improved outlook for inflation in SA is also reflected in the declining SA risk premium, the difference in yields offered by a RSA 10 year bond and a 10 year US Treasury bond. This spread in 2017 has narrowed sharply, indicating that the rand is now expected to depreciate against the US dollar at a slower rate, close to 6.4% p.a. and thus consistent with less inflation priced into the bond market.

This better news about the outlook for the rand and so inflation in SA has come naturally enough with a stronger rand. The figure below indicates the trade weighted exchange rate since September. After initially weakening in response to the Trump election, the rand has benefitted from a strong recovery of about 7% since November. Clearly the extra growth and higher US interest rates associated with a Trump administration have neither raised long term rates in SA nor weakened the rand. Indeed the opposite has happened. This should encourage the Reserve Bank to focus on the downside risks to economic growth in SA rather than the upside risks to inflation. These surely have declined, both with the stronger rand and the prospects of lower food prices. The case for lower interest rates in SA has strengthened with the Trump election so that SA too can look forward to faster growth.

New vehicle sales: A closer look
What’s in a (growth) number? Vehicle sales volumes in December 2016 deserve a closer look.
Recently reported new vehicle sales of 41 639 units sold in in December 2016, some 15.35% fewer than sold a year ago, were greeted with general disappointment. The implication drawn was that the decline in sales volumes recorded in 2016 had accelerated.
But is this the right conclusion to be drawn about the most recent data release? A year can be a very long time in economic life and what has happened to vehicle sales in the months between December 2015 and December 2016 can tell a very different story about the underlying trends.
The data, when adjusted for predictable seasonal influences on monthly sales, indicate that while monthly sales volumes took a turn for the worse in the fourth quarter of 2015, by the fourth quarter of 2016, sales were in fact recovering from their lows of midyear 2016, when monthly sales are adjusted for seasonal influences, as we show below.

The important feature of the vehicle market is that unlike for other retailers, December is a typically well below average month for motor dealers. Holidays mean closed dealerships and so are not usually a good time to deal for an expensive new vehicle.
But a year ago in December 2015, with which sales comparisons are being made, was not a typical month for the motor dealers. The rand, it will be remembered, collapsed that month, portending higher vehicle prices, given their import content. And consequently buying ahead of the expected price increases seemed like a good enough idea to lift sales in December 2015 markedly, especially when seasonally adjusted. Actual sales in December 2015 were 49 158 units and had held up very well compared to November 2015 sales volumes of 51 338 – making December 2015 a very high base with which to compare sales a year later.
As we show in our table of seasonal factors below November is an average month for motor dealers, while December sales average about 13% below average monthly sales. By contrast for retailers generally, December sales volumes average as much as 36% above average monthly volumes.
Or in other words, to gain a full impression of trading trends in December 2016, retail volumes when recorded and reported should be scaled down (divided) by a factor of 1.36 while vehicle sales should be scaled up by a factor of approximately (0.87). Hence vehicle sales in December 2016 of 41639 units should be scaled up by (0.866476) to register the 48 055 sales seasonally adjusted indicated in the figures, and so well ahead of the much weaker, seasonally adjusted sales of 42 501 unit sales, recorded in July 2016.
In the figure below we compare growth rates in vehicle sales on an annual basis with growth calculated over consecutive 3 moth periods using seasonally adjusted monthly data. It may be seen that while annual growth rates are negative and in retreat, the quarterly numbers tell a more positive story.

Of interest is that the recent share price performance of two JSE listed motor dealers, Combined Motor Holdings (JSE code – CMH) and Imperial (IPL) seems to accord better with the more encouraging seasonally adjusted sales numbers than with the raw data (see below).

Lessons from the success of the Western Cape
The success the governments of the Western Cape have had in competing for resources with the rest of South Africa is highly evident in the building activity under way in the more expensive parts of the region. Any number of ordinarily valuable buildings are clearly worth more dead than alive – they are worth demolishing so that they can be replaced by more valuable structures, valuable enough to more than recover the costs of demolishing what stood before.
The demand for these expensive new residential structures has come mostly from migrants from other parts of South Africa where local government has proved much less competent in delivering services so essential to the quality of life, such waste removal, water and electricity supplies, easy access to homes, work and recreation as well as protection against fire, noise and criminals.
The more valuable the stock of buildings, the larger the tax base upon which the local authority can draw to fund service delivery, including in the more deprived parts of town. Moreover current revenues can be used to justify the raising of debt to fund a large capital expenditure programme in order to sustain and enhance the infrastructure that supports effective service delivery. This includes funding the additional roads and bridges and sewage works that support and make viable green field housing developments.
The extra tax these developments will generate over time can more than fund and repay the additional debt incurred. Bridges and new roads that improve access to undeveloped (often wastefully used land owned by government authorities) can prove highly profitable investments. They can be funded with tolls that can then pay off debt incurred in the building – no more or less than a user charge – rather than used to tax users as has wrongly been the case with most toll roads in the country, giving them their well-deserved notoriety.
A criticism one can make of the management of City of Cape Town is its reluctance to raise more debt to fund capital expenditure, that is to put its financial strength supported by ever rising values in the buildings and especially the land it services, to better and more immediate use.
Clearly regional economic development can become a highly virtuous circle of increased revenues and financial strength that leads to useful additional expenditure on improved service delivery that helps attract migrants to the region, rich and poor, that reinforces the growth under way.
It should however be fully appreciated (as perhaps it is appreciated in Cape Town), that the resource critical for faster growth and for which the competition is most intense (not only nationally but also internationally) are the skills, enterprise and wealth embodied in the high income earners of any community. Their contribution to economic development is indispensable for the incomes and the prospects of their poor neighbours. Moreover, providing this mobile resource with a globally competitive quality of local government service at a reasonable charge is essential to the purpose of economic growth. It is also essential to the incomes of the poor who will wish to migrate to the regions that promise better income opportunities.
Hence the relationship between the expensive real estate in a city that is demanded by the affluent and economically successful and the less expensive real estate, that is consistent with much lower earnings and less affordability, is a mutually supportive one. Improved competitive local government service delivery is very encouraging to the high income earners who deliver so much to an economy – including tax revenues – and so symbiotically also very valuable to the poor, who can expect improved services as well as improved income prospects.
If South Africa or any region of it is to succeed in the global competition for the all-important scarce resources that high income earners provide an economy, it will need to continue to offer them competitively priced and efficient services that local governments deliver. South Africa will also need to provide them and their children with competitively priced educational services and also competitive and competitively priced medical services. The role played in education by private suppliers of education and medical service is an obviously important one in these regards. Such quality service delivery will need to be nurtured and encouraged if South Africa is to succeed in overcoming poverty.
Will a national minimum wage help the poor? We beg to disagree with the expert panel
The National Minimum Wage for South Africa (NMW) – will it be helpful or harmful to the poor of SA? We beg to disagree with the expert panel.
A reality check
It is always salutary to be reminded just how dire are the economic circumstances of the average South African and how slowly their economic conditions have been improving. Over 51%, some 29,733,210 of our people, live on less than R1,036.07 per month. These and many other shocking statistics are reported by the Panel of Experts appointed to recommend the level of a National Minimum Wage (NMW) and on a process for its effective implementation (“Recommendations on policy and Implementation; National Minimum Wage Panel report to the Deputy President”).
The table calculated by the panel, included below, provides helpful detail about the lack of income and the associated unemployment.
The panel has no doubts about the helpfulness of an NMW in principle – only reservations about practice
The panel seems to have no doubts that a NMW would be a very helpful policy intervention in principle. To quote selectively from its substantial report of 128 pages”
“On its own it will not solve all of the challenges we face, but it is an implementable policy which is designed to have a measurable and concrete benefit on the poor. The minimum wage is therefore seen as one of the tools to close the wage gap, including between the genders, and thereby to overcome poverty.
“Furthermore, under the correct conditions and at the correct wage level, it is possible for minimum wage policies to contribute to improving economic growth. ……Given that the national minimum wage is essentially a policy to help the poor, it is generally accepted that exemptions and exclusions should be kept to an absolute minimum.”
Striking a balance – recognising employment dangers in scenario exercises
The panel was required by the social partners in Nedlac, who agreed to an NMW, to recommend an appropriate level for the NMW. Since it recognised a relationship between wages and employment the MNW had to strike a balance between the effects of increasing wages to a higher prescribed minimum level and its consequences for additional unemployment of which SA already has a great abundance. Some 26% of the labour force, those in work or looking for work, are currently unemployed, while many more potential workers have been discouraged from looking for work and have fallen out of the labour force. Adding them to the work force would imply a more broadly defined national unemployment rate well into the 30% plus range.
The panel recommended a NMW of R3500 per month or R20 per hour to be phased in by 2020 with 90% of the NMW to be applied in agriculture and 70% in Domestic Service provided to Private Homes. It also recommended annual reviews of the NMW and a gradual move to uniformity across all sectors of the economy. Using a so-called Computable General Equilibrium model of the SA labour market (as described and developed by Professor Harron Bhorat of UCT) that included assumptions (not predictions based on past performance) about the trade-offs between percentage increases in minimum wages and percentage reductions in employment (the relevant employment elasticities in economic speak) .
The aggregate employment losses were estimated as between 100,000 and 900,000 jobs lost in exchange for the recommended NMW. Clearly in the view of the Panel, the NMW had to be set high enough to make its contribution to poverty relief and yet low enough to be able to treat the extra unemployment as the acceptable price to the panel members of them doing such good for society. Another argument for breaking eggs to make omelettes from those unlikely to be harmed by the action and who might even benefit from helping to give effect to a new dispensation.
However the panel did qualify its judgment. It noted correctly:
“…..that there is no research or data that can accurately predict the outcome of any policy intervention. It is for this reason that strong emphasis has been placed on the need for good solid research to support the work of the NMW institution into the future. Any future changes to the level of R3,500/R20 per hour should be based on solid evidence of the impact of the national minimum wage.”
Would it be unkind to recognise that this would also be more grist for the economist’s mill?
The relationship between minimum wages and employment – what may be self-evident to the panel is not so to the society at large
It would have been helpful had the panel used the report to explain more fully why employment offers are negatively related to the wages or rather employment benefits provided by employers in exchange for hours worked. The relationship is much less self-evident than the panel may have presumed it to be – especially by members and leaders of trade unions who are inclined to attribute wage differences much more to political forces and bargaining power and even to race – than to the differences in skills and therefore of the contributions to output made by the well and poorly paid. And they are very inclined to believe that the wage gaps can be easily closed, with little consequence for economic growth by taking more from the well paid and giving to the poor. And so for ever higher NMW.
The relationship between skills, incomes and employment
The panel is well aware of an obviously important and highly consistent relationship to be observed of the SA labour market between measures of skills and wages earned. And as statistically significant is the relationship between incomes and employment. The lowest income South Africans have the highest rates of unemployment. The full income and employment details are shown in the table below (Table 5 Household Indicators of the Panel Report). Other reports from Stats SA have demonstrated the links between educational attainments and income and employment.
It may be seen in the Table, that of the 16,306,000 people in Quintile 1, 31.2% of the population with the lowest share of income, only 15,9% are employed, 25% strictly unemployed and the broad unemployment rate of this group is estimated as 65.8%. The average wage of those employed in quintile 1 is only R1017 per month. The second poorest quintile counts for a further 24.6% of the population, has a lower unemployment rate, a much higher participation rate in the economy and average wage incomes of R1707 per month. A large improvement but still a very low average wage.
The top income quintiles present very differently. Unemployment rates are much lower and participation rates and average incomes from work of the employed are much higher and well above the recommended NMW. Though it should be noted that the average wage income of those employed who fall into Quintile 3 of R2651 per month, is still well below the R3500 per month recommended NMW.

The implications of a NMW set so far above average wages- is there precedent that can help us predict the employment effects with any confidence?
This begs the question – is there any precedent for a NMW or a sectoral minimum wage determination –be set so far above average earnings – and if so what have been the consequences for employment? Or put in another way is there reason given the facts of the labour market to think that the employment elasticities in SA are a lot more negative than the range of assumptions considered by the models. Time will tell much more about the consequences of the recommended NMW as the Panel complacently assumes and adjustments can then made to the model and the recommendations. But who will care for the unemployed and their dependents in the meanwhile?
How can an NMW help the poor – who are now mostly not employed?
It is very difficult to understand why the Panel should believe that the NMW can be helpful to the poor of South Africa or reduce inequality. Because fundamentally the poorest South Africans those in first and second quintiles, are mostly not employed. And when employed they are able to only command wages far below those of the recommended NMW that still leave them objectively poor.
The recommended NMW will surely make it even more difficult for them to find work that might for some, especially young workers, prove a path out of poverty. Thus the NMW is very likely to increase further the unemployment of low skilled potential workers in SA and to widen the gap between the average incomes of the high earners and the low earners, mostly no earners of the population. The poor of SA deserve better opportunities to work and more so the opportunity for their children to acquire the education and skills that would help them qualify for and find well paid work. They do not need further interference in their search for work.
Employers will make the adjustments that will confuse the observers
Though to complicate the numerical outcomes to be observed in due course, structural adjustments to employment practice will be made by employers in response to higher minimum wages. The adjustments will include more reliance on mechanisation and automation- requiring more carefully selected and skilled employees, forces that substitute capital for labour, especially less skilled labour, that are already well at work in the economy.
Other adjustments employers will make will be to offer fewer hours of work and significantly less by way of other important employment benefits, food and accommodation and contributions to pension and medical aid for example, the cost to employers and value to employees the panel refuses to recognise in its money wage only determination. Evidence of such reactions so unhelpful to low income workers comes from previous minimum wage adjudications in the agricultural sector. Fewer workers were employed permanently – less accommodation was offered on the farm – and higher transport costs was incurred byr workers busing in from informal settlements. And there is also bound to be less compliance with the law given the availability of cheaper labour and additional employment offered to illegal immigrants.
Why does the labour market only work well for the higher income earners? Is it because they are much less encumbered by regulations and collective bargaining?
A further observation of the inconvenient and uncomfortable truths of the SA labour market is that the supply and demand for labour are very well matched for the well paid and very poorly matched for the low paid. A very high unemployment rate – a large number of potential workers unemployed at current wages – is surely evidence of wage levels that are too high rather than too low to the important purpose of providing work for those who would wish to work- at prevailing wage rates.
These are not considerations that receive much attention from the panel. Other than a presumption of “structural imbalances” or why these structural forces that discourage employment do not apply to the most expensive of workers in SA who are so readily employed?
It is to be conceded that employment at low wages for those with limited skills cannot overcome the poverty of the working poor. But then what can – other than them acquiring the valuable skills that are in short supply and well worth hiring. Wishful thinking- waving magic wands in the form of un-affordable to potential employers of high minimum wages will not solve their problem.
But unemployment makes their condition more onerous and denies them the employment and low wage benefits that they would be willing to accept. A willingness demonstrated by their seeking work. And being unemployed prevents the potential worker from acquiring skills on the job and the opportunity to demonstrate their capabilities that add to their employment credentials. These opportunities are particularly important to young, unskilled entry level workers whose unemployment rates are regrettably but understandably well above average unemployment rates as is well recognised by the panel.
The panel might have sought an explanation of the high rates of unemployment of low income South Africans in the structural impediments to their employment in South Africa. Barriers to employment offered or accepted in the existing highly pervasive regulations of their employment contracts. It is not as if minimum wages have not been tried in SA. They are widely practiced and have surely had their effect on the employment of the lowest paid and least skilled.
The current regulatory barriers to employment in SA
There are in fact 124 separate such sectoral minimum wage determinations. They cover approximately 5m workers and 33% of those employed leaving only 35% of workers uncovered including presumably many of the better paid also without Union representation. The lowest such monthly determinations in 2015 ranged from R1813 for Domestic Workers to R2844 per month per Contract Cleaner in the lowest grades. The highest sectoral minimum determinations – for more skilled work- were R6155 for workers in private security and R6506 per month in Retail and Wholesale businesses.
The newly fashioned NMW is intended to remove all this administrative complexity – and presumably also the possibility of recognising very different labour market conditions – supply and demand – that may apply in the different sectors and regions of the economy. Conditions that participants in specific labour markets, unencumbered by regulations would be much better informed about than even diligent officials to the advantage of workers and their employers.
The case for best leaving the determination of an employment contract to willing buyers and sellers of labour does not get any hearing from the panel. While the collective bargaining process in SA that can easily be shown to protect the established interests of employees and their employers – the insiders – at the expense of the employment opportunities of the outsiders – receives nothing but uncritical approval from the panel- and with an appeal for the wider application of collective bargaining arrangements.
The influence of welfare on employment
Nor did the influence of SA’s extensive welfare system on poverty and employment receive much more than perfunctory and rather condescending attention from the Panel as follows.
5.43. “While wages are low relative to living levels, there are arguably some offsetting effects from the social wage spending by Government. About 35% of South Africa’s budget is spent on programmes targeted at the poor, including free basic education, health care, water and electricity, and income support grants for children and the elderly”.
They may, as did the Davis Committee on Tax Reforms, have referred to a report of the World Bank on the influence on incomes and their distribution of SA of its welfare system. To quote this study:
“But while incomes earned in South Africa may well be the most unequally distributed in the world – the distribution of expenditure is much less unequal. The World Bank shows, in a recent study, that South Africa does more to redistribute income in cash and kind to the poor than its developing economy peers with similar average incomes , Armenia, Brazil, Bolivia, Costa Rica, El Salvador, Ethiopia, Guatemala, Indonesia, Mexico, Peru, and Uruguay (South Africa Economic Update Fiscal Policy and Redistribution in an Unequal Society, World Bank, November 2014).”
As this World Bank study also reports:
“South Africa ranks as one of the most unequal countries of CEQ (Commitment to Equality Methodologies applied by official statisticians in income measurement) participant countries, if not among all middle-income countries, given its Gini coefficient of 0.69. The proportion of the population living in poverty at 33.4 percent measured by the international benchmark of $2.50 a day(purchasing power parity, PPP, adjusted) — is also higher than in many other middle income countries with similar levels of GNI per capita. For example, the poverty rate is 11 percent in Brazil and 4 percent in Costa Rica”
To quote further from the World Bank report:
“Briefly, this Update has two main findings. First, the burden of taxes falls on the richest in South Africa, and social spending results in sizable increases in the incomes of the poor. In other words, the tax and social spending system is overall progressive. Second, fiscal policy in South Africa achieves appreciable reductions in poverty and income inequality, and these reductions are in fact the largest achieved in the emerging market countries that have so far been included in the CEQ. Yet despite fiscal policy being both progressive and equalizing, the levels of poverty and inequality that remain are unacceptably high. South Africa is currently grappling with slowing economic growth, a high fiscal deficit, and a rising debt burden. In this context, addressing the twin challenges of poverty and inequality will require not only much-improved quality and efficiency of public services but also higher and more-inclusive economic growth to help create jobs and lift incomes.” (p22)
These income transfers and benefits in kind may moreover, influence the willingness to supply labour services at prevailing wages – especially when wages on offer are very low. By providing an alternative source of benefits welfare raises the reservation wage – the wage at which it makes good sense to work or to seek work, work that may well be physically demanding and less than enjoyable for its own sake. The panel might have paid much more attention to the supply side of the SA to help explain low rates of labour force participation. Also to help explain why immigrants from Africa are much more likely to be employed – at market related wages.
Economic growth and employment – ignoring the evidence
The panel remarks somewhat self-evidently that:
“An additional problem faced by the country is that there is evidence that the growth in the demand for labour in South Africa has not been sufficient to keep up with the much larger growth in labour supply.”
The panel quotes with seeming approval a study that apparently shows growth and job creation are not well correlated. To quote the Panel:
“Recent empirical work by Mkhize (2016) finds that the economy’s capital intensity undermines its ability to generate jobs in times of economic growth. He finds that, in the long run, growth and job creation are not correlated, although there is some sectoral variation. This points to the broader economic policy challenge facing South Africa, which is that there are structural barriers that exacerbate unemployment, the solutions to which require more than economic growth”.
A surprising conclusion it would be thought, given the fact that in the developed world incomes (GDP), population and the size of the labour force have grown together, as indeed it did in SA until the 1980s – as our own work has shown (see below), though such work on the relationship in SA between GDP and numbers employed is complicated by the absence of an official continuous long time series of numbers employed. Though the structural break in the relationship in the 1980s is easy to recognise and to be self-evidently explained by the increasing degree to which the SA labour market came to be regulated and the increasing bargaining power conceded to trade unions in the 1980s.
The recommended NMW represents more of the same lack of faith in market forces that encourage regulation, rather than regulatory interventions to generate growth and employment.
Another case I would suggest of economists as are the governments they usually serve, being part of the economic problem rather than the solution. 28 November 2016

The SA economy: The view from the rear view mirror is not encouraging
The SA economy: The view from the rear view mirror is not encouraging. Can we look down the road more happily?
The pace of the SA economy appears to be slowing down rather than picking up momentum – judged by the very latest data releases for October 2016. New vehicle sales and cash in circulation indicate that a trough in the business cycle, that is when economic conditions have begun to improve rather than deteriorate, has not been registered though may possibly be in sight.
New vehicle sales are nevertheless somewhat more encouraging than the latest money supply data. While new vehicle sales are well down on a year ago, sales volumes in October represented a modest improvement over sales made in August and September 2016, especially when viewed in seasonally adjusted terms, as we show below. When current vehicle sales are extrapolated, using a time series forecasting process, a cyclical trough, is indicated for early 2017. As noticed in figure 2 negative, year on year growth rates, may also have reached a low point.

By contrast the demand for and supply of cash still indicates weaker propensities of households to spend more. The demand for cash, as may be seen, is not keeping pace with inflation. Though, as may also be seen, the forecast is that the real demand for cash is about to turn marginally positive, indicating more rather than less spending to come.

When these two series are combined to form our Hard Number Index (HNI), its direction has turned lower after moving sideways for much of the year, indicating declining levels of economic activity. Extrapolating the HNI however also suggests an improvement in activity levels in 2017. As may be seen, the HNI based on two very up to date hard numbers – rather than based upon sample surveys – is a good predictor of the Business Cycle that is calculated by the Reserve Bank, for which the latest data point is for July 2017 (of somewhat distant memory given all that has happened to society and the economy).

The broader measures of money supply and of bank credit and retail sales volumes, updated to September 2016, indicate a similarly weak backdrop for the SA economy, as we show below. The growth in M3 (to September month end) has become negative in real terms while bank credit supplied to the private sector is somewhat more robust. Perhaps bank credit is being used to a degree, to fund offshore rather than domestic growth. As we also show in retail sales volumes shows a declining growth trend that is forecast to continue in 2017.

The hope for a cyclical recovery in 2017 must rest upon the inflation trends. A Reserve Bank forecast of lower inflation would allow for lower interest rates, which are essential to the purpose of a cyclical recovery. As may be seen in figure 6, the time series forecast of the CPI, using the latest data, is for less inflation to come. Recent data releases for the CPI (the latest being for September), do indicate a much shallower trajectory for the CPI. Between July and September 2016, the CPI was largely unchanged as we show below. A degree of exchange rate strength has helped restrain inflation. A normal harvest in 2017 would do more of the same. South Africans, under severe economic pressure, would be justified in praying for more rain combined with strength in emerging market currencies, including the rand.
