What the world needs now is more than love- there is also too little spending. [1]More of that would also be very welcome. Particularly welcome would be extra spending by business enterprises on capital equipment. This lack of demand, combined with a rising global savings rate, has created an abundance of saving that explains the exceptionally low interest rate rewards for saving in developed economies. This glut of savings followed the global financial crisis (GFC) of 2008-09 that made managers more fearful to spend or lend while additional regulations restricted their freedom to do so.
The story of the global glut of savings can be told in a few pictures provided by the World Bank shown below. When will then consider how the bond market in the US may be indicating some incipient revival of the animal spirits of US corporations. Encouraged, as they attest, by lower tax rates and much more sympathetic regulators.
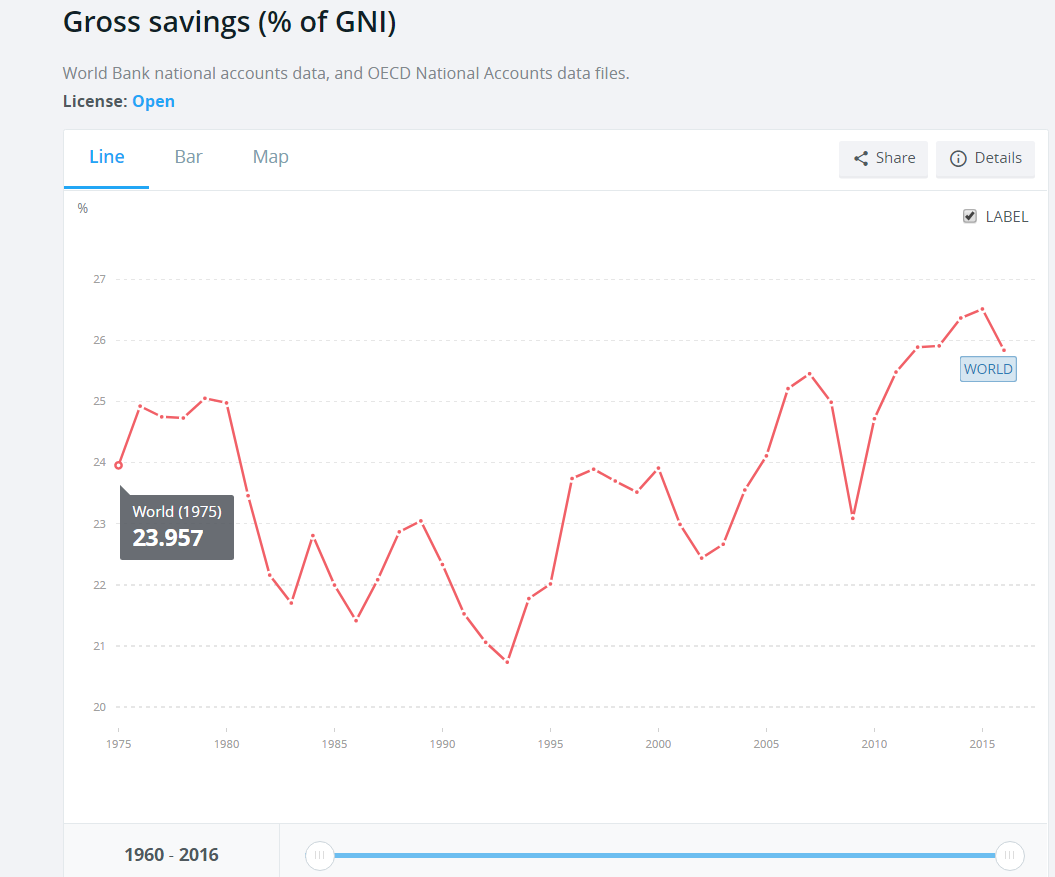
Figure 1 charts gross global savings as a per cent of gross global incomes. (GNI) As may be seen share of savings of income has been rising steadily over the years. The GFC hit savings even harder than incomes (upon which savings depend) but since then savings have made an ever larger claim on incomes (26% in 2015). The global savings rate was only about 21% of incomes in the fast growing and higher interest rate world of the mid-nineties. It has been on a generally upward trend since, as may be seen.
Gross savings – (savings before amortisation of capital that turns gross into net savings) are dominated by the cash retained by corporations. Households may save – but other households over the same period may be large borrowers and reduce the net contribution households make to the capital market. And most governments are net borrowers- borrowing even more than they spend on infrastructure that is counted as saving.
Fig 1; Gross savings as per cent of Gross Global Income
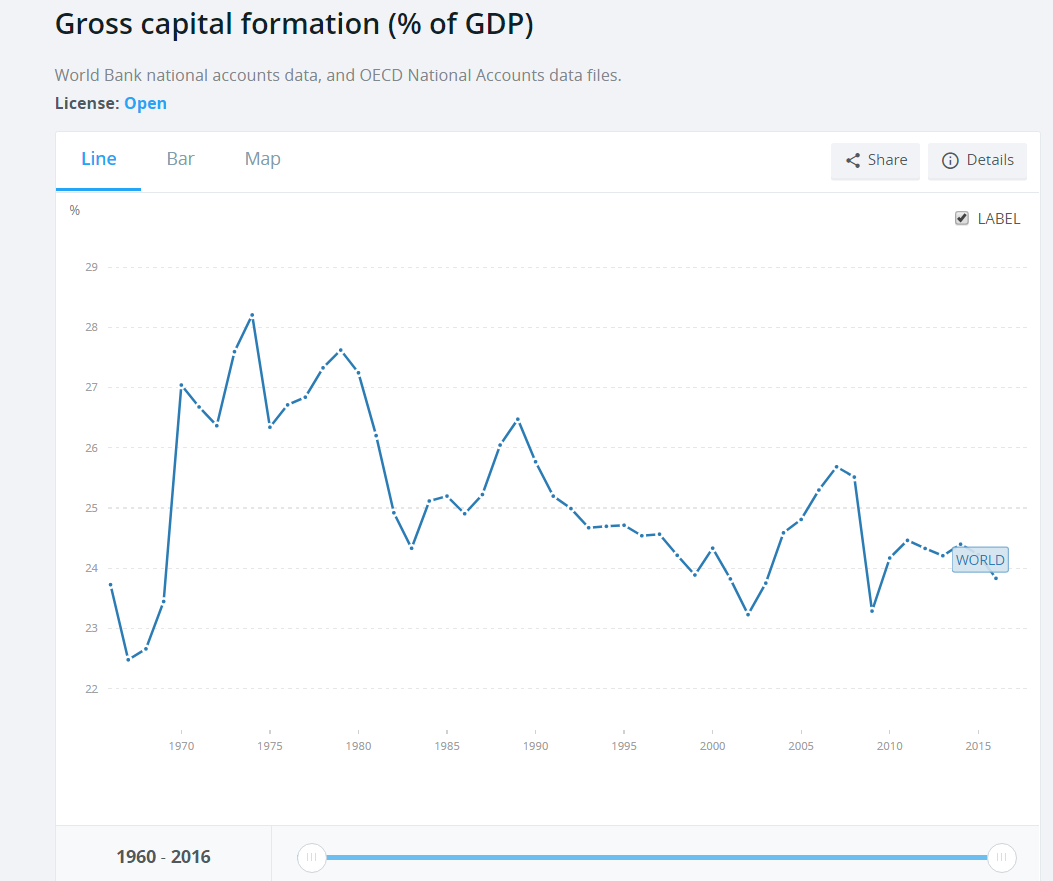
As we show below in figure 2, the rate at which real capital – plant and infrastructure – has been accumulated has been trending in very much the opposite lower direction. There was a brief surge in the rate of capital formation in 2005 – a boom year for the global economy – but this was not sustained and was but 24% of global incomes in 2016- compared to a higher global savings rate of 26%.
Fig.2; Gross Capital Formation (% of GDP)
Source; World Bank
In the case of South Africa, with a lower gross savings rate of less than 18% of GDP, the cash retained by the corporate sector (including state owned enterprises) accounts for more than 100% of all gross savings. The household sector’s net contribution to gross savings flows is barely positive and the government sector is a net dis-saver. We show the trends in the SA savings rate below. The profits from the gold booms of the seventies and early eighties were responsible for the very high savings rates then.
Fig 3; South Africa – Gross Savings Rate
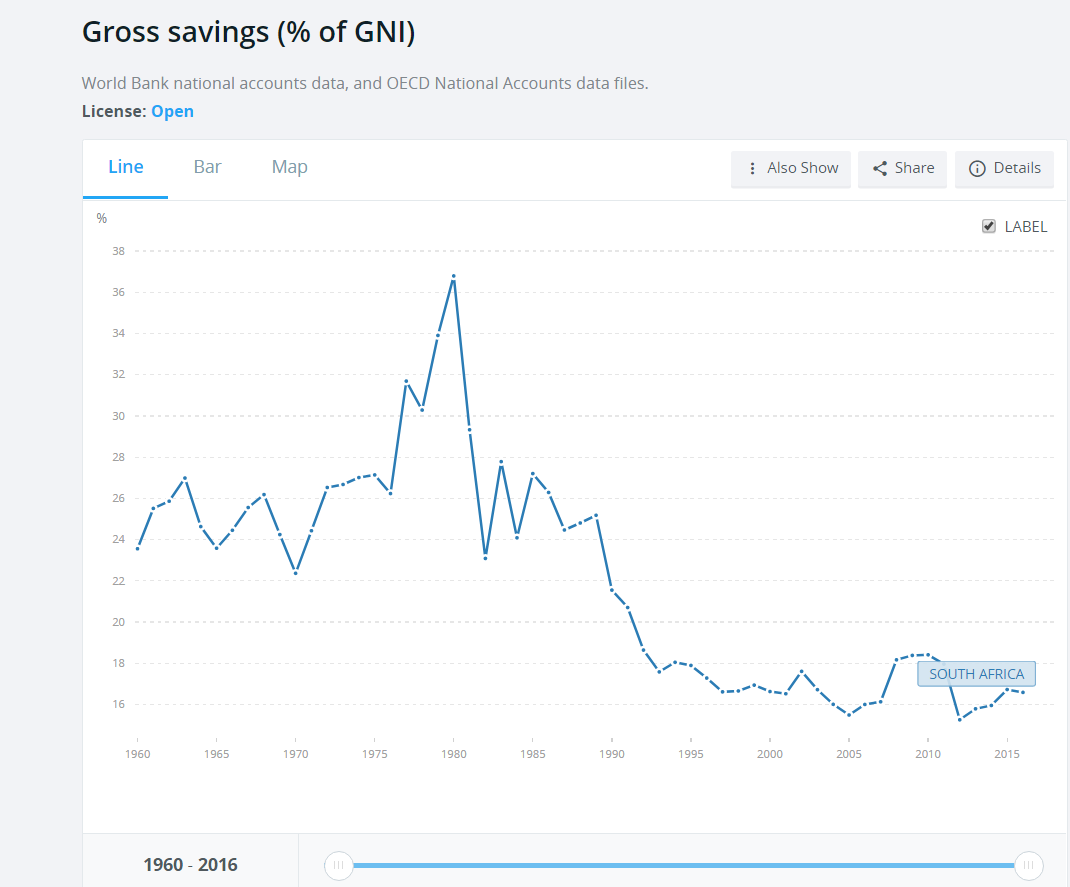
Source; World Bank
South Africa cannot realistically hope to raise its savings rate significantly. It can however hope to raise the rate at which capital expenditure is undertaken. That is by reducing the risks of investing in SA- and growing faster and attracting the savings to fund more rapid growth. That would be freely available from the large pool of global savings anxiously seeking better returns- given the right incentives and protections to do so. There is, as indicated, no global shortage of capital – only of attractive investment opportunities that SA could be offering.
The current rate of capital formation currently in SA is only slightly higher than the low savings rate – hence the small net inflows of foreign capital. The difference between any nation’s gross savings and capital formation is approximately equal to the net capital inflow and so the current account deficit on the balance of payments. The item that balances the current account deficit (exports-imports +debt service) – is the change in forex reserves- usually a comparatively small number.
South Africa could do with much faster growth that would encourage more capital formation and attract the foreign savings to fund this growth. And higher corporate incomes would mean more corporate savings. It is slow growth that is at the core of SA’s economic issues. Not the lack of savings. If we grew faster both the current account deficit and the capital inflows would be larger and the rate of capital formation higher. And a larger capital stock would bring more employment and higher incomes for a more productive labour force.
The US despite a relatively low and fairly stable savings rate (currently also around 18% of GNI as in South Africa) is, given the scale of its economy, still a large saver on the global stage. Though the US economy is the largest by far drawer on the global capital market to fund its spending as we show below in figure 8. While the US has been saving absolutely more recently, Chinese savings have now far overtaken US savings in absolute magnitude. Germany is another large saver, adding significantly to global savings in recent years, as we show below.
Fig. 4; Global Savings Rates
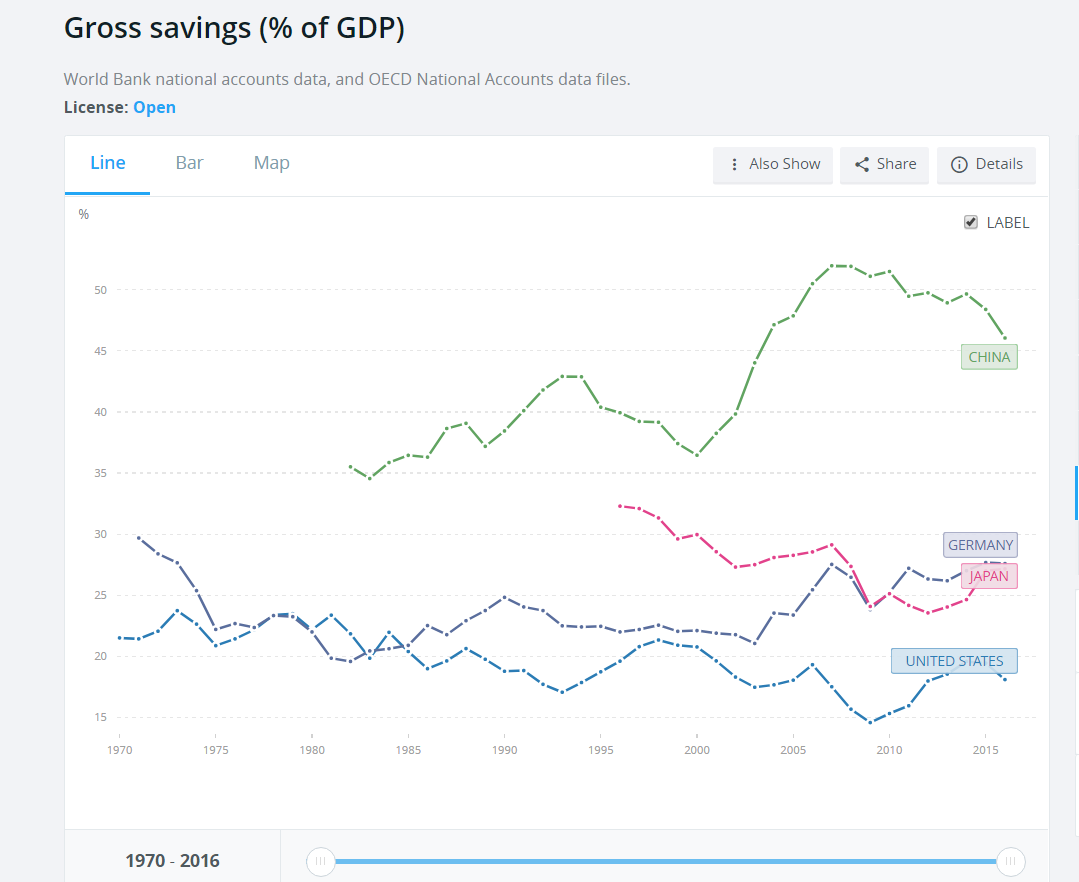
Source; World Bank
Fig.5; Gross savings (current US dollars) by economy
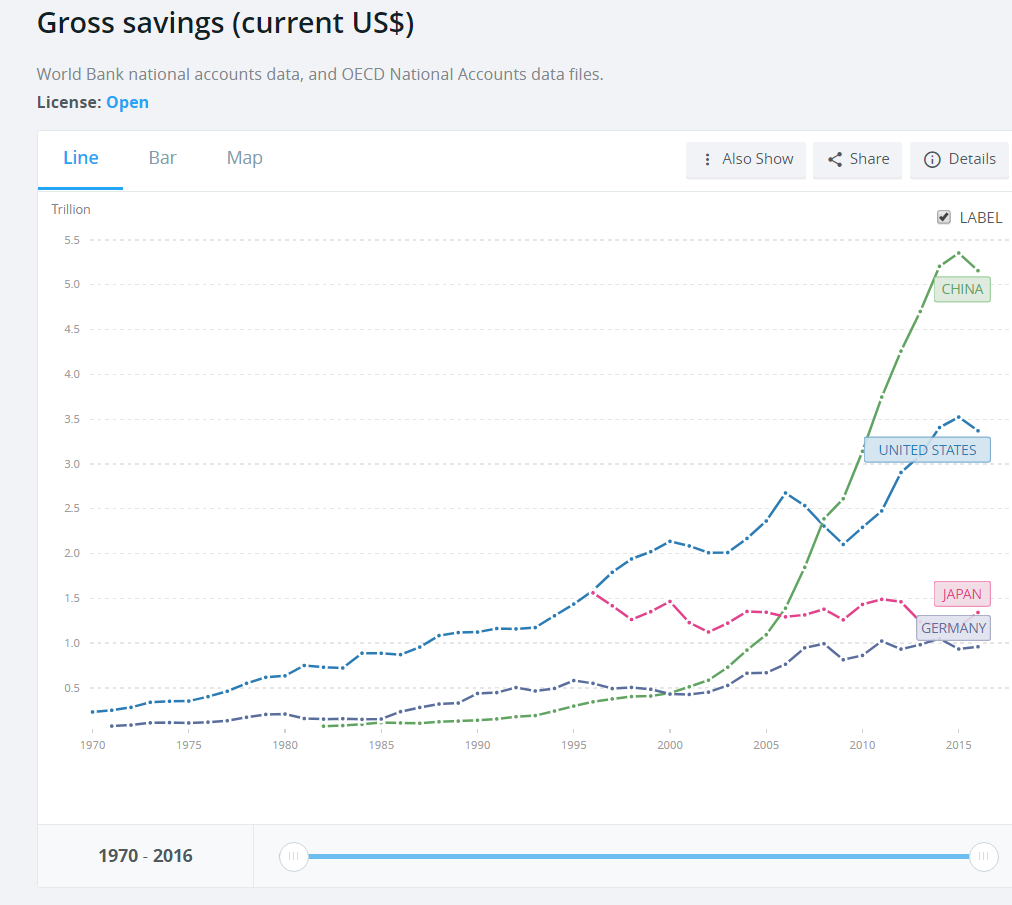
Source; World Bank
The Chinese are not only the largest contributor to global savings, saving an extraordinary 45% of their GNI – a rate that as may be seen has been declining from above 50%- they are also undertaking by far the largest share of global capital formation. They created plant and equipment – real capital – worth over USD 5 trillion in 2016 or at a rate equivalent to 45% of GNI, similar to the investment rate- meaning that most of the Chinese savings were utilised domestically.
Fig.6; China Gross Capital Formation (% GDP)
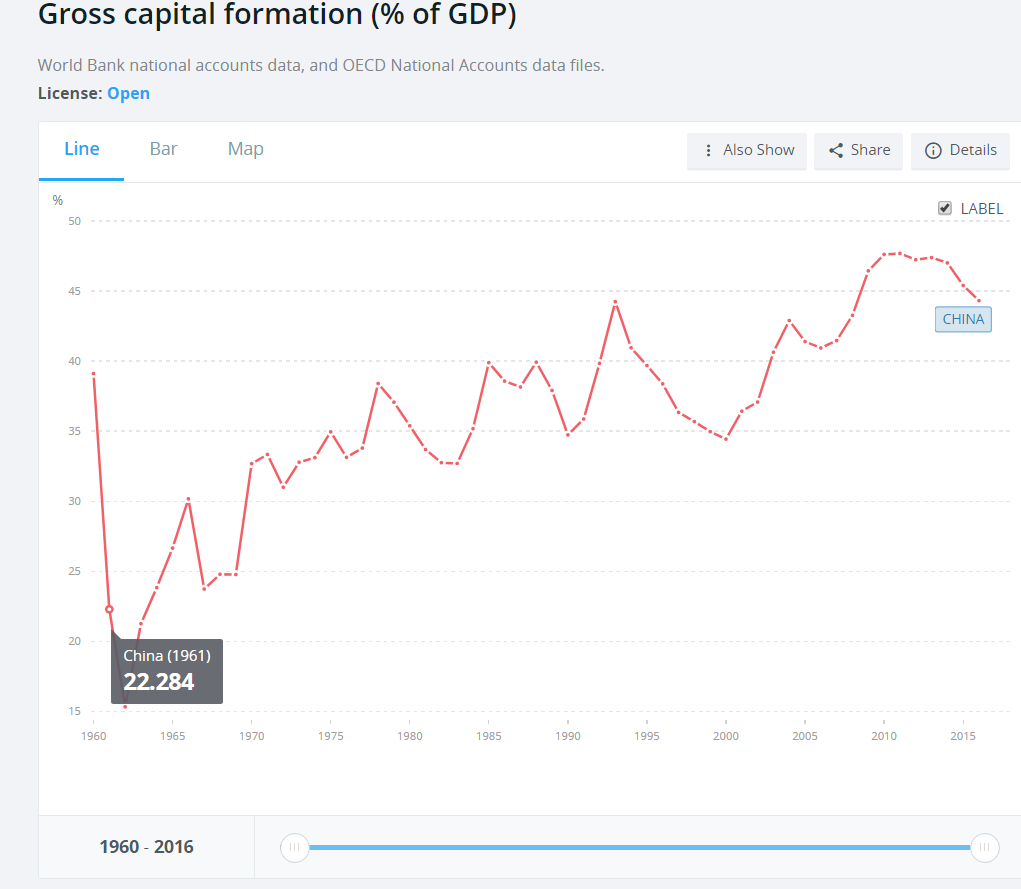
Source; World Bank
But this raises a very important issue for the Chinese. Given the rate at which they save and invest in real capital the realised growth in Chinese incomes must be regarded as disappointingly poor- even when about a 7 per cent p.a rate. It suggests that much of the capital formed is still unproductively utilised. The full discipline of western style capital markets is surely something still to be introduced to China to improve returns on savings. But for all the relative inefficiency of Chines capital, the sheer volume of Chinese capital formation has made it the dominant force in the market for minerals and metals that are used to create capital goods.
Fig.7; Gross capital formation by economy – current US dollars
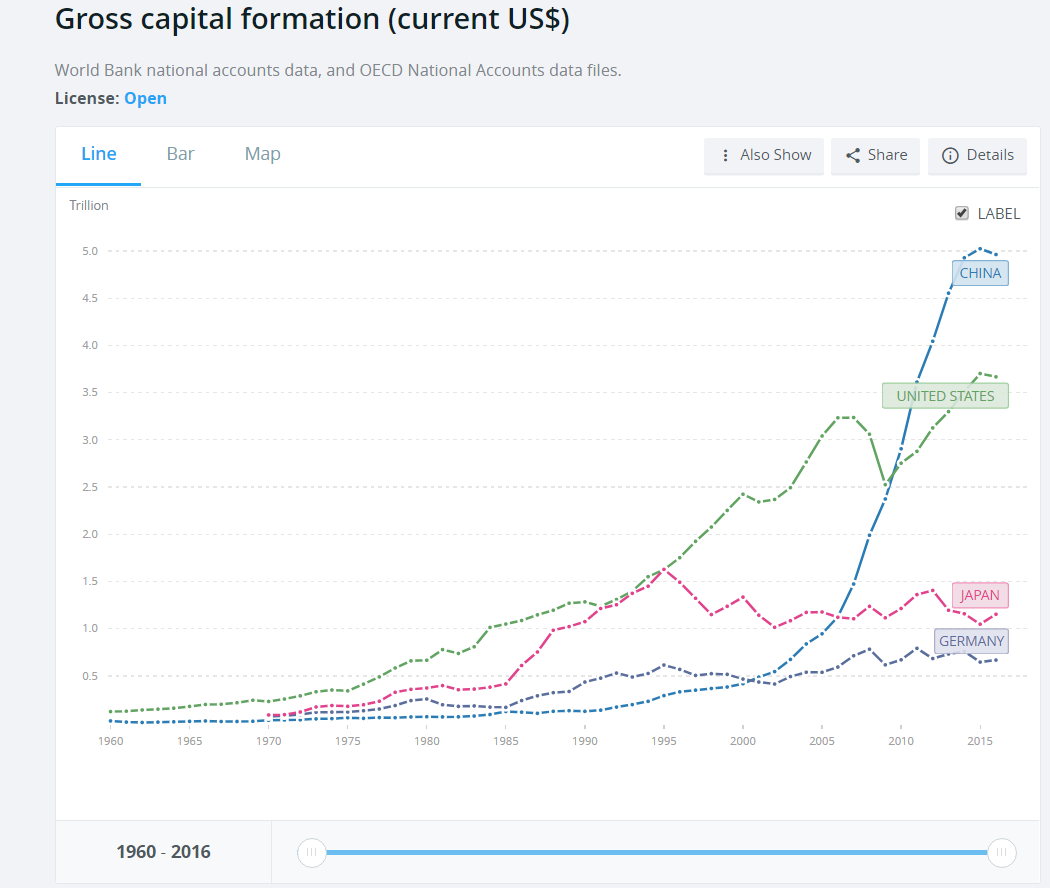
Source; World Bank
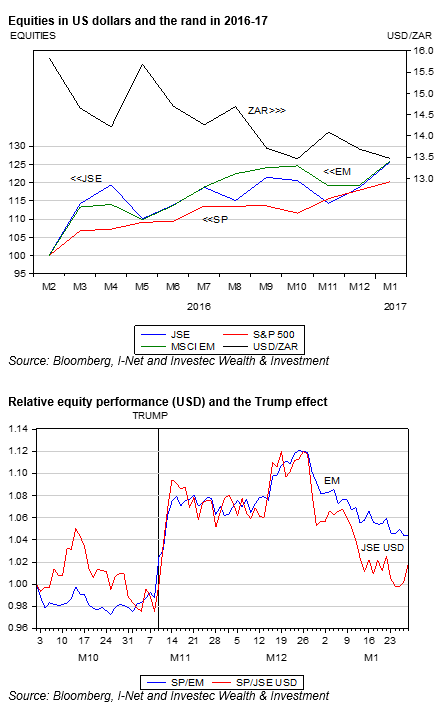
In figure 8 below we show how The US dominates the demand side of the flows through global capital market- and the thrifty Europeans – the supply side. As may be seen these trends that made US economic actors the dominant utilisers of global capital are predominatly a post 2000 development.
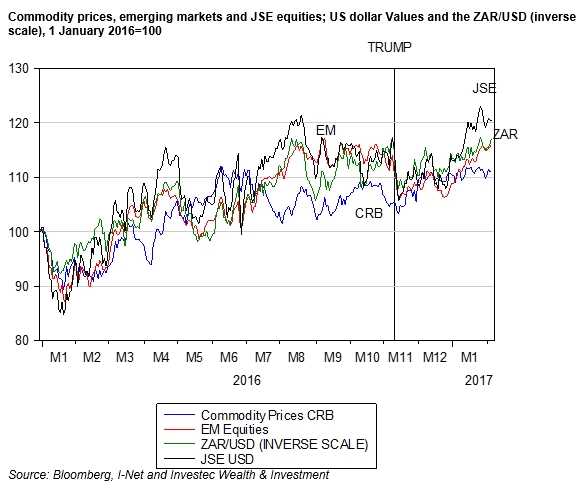
It is these capital flows that drive the US dollar exchange rate – and by implication all other exchange rates. Trade flows react to exchange rates- rather than the other way round. This is also the case for SA. With one important difference- foreign trade for the US economy is equivalent to about 25% of GDP. In SA imports and exports – valued at unpredictable exchange rates are equal to about 50% of GDP.
Fig. 8, Net Financial Flows from Europe and to the US. Current US dollars
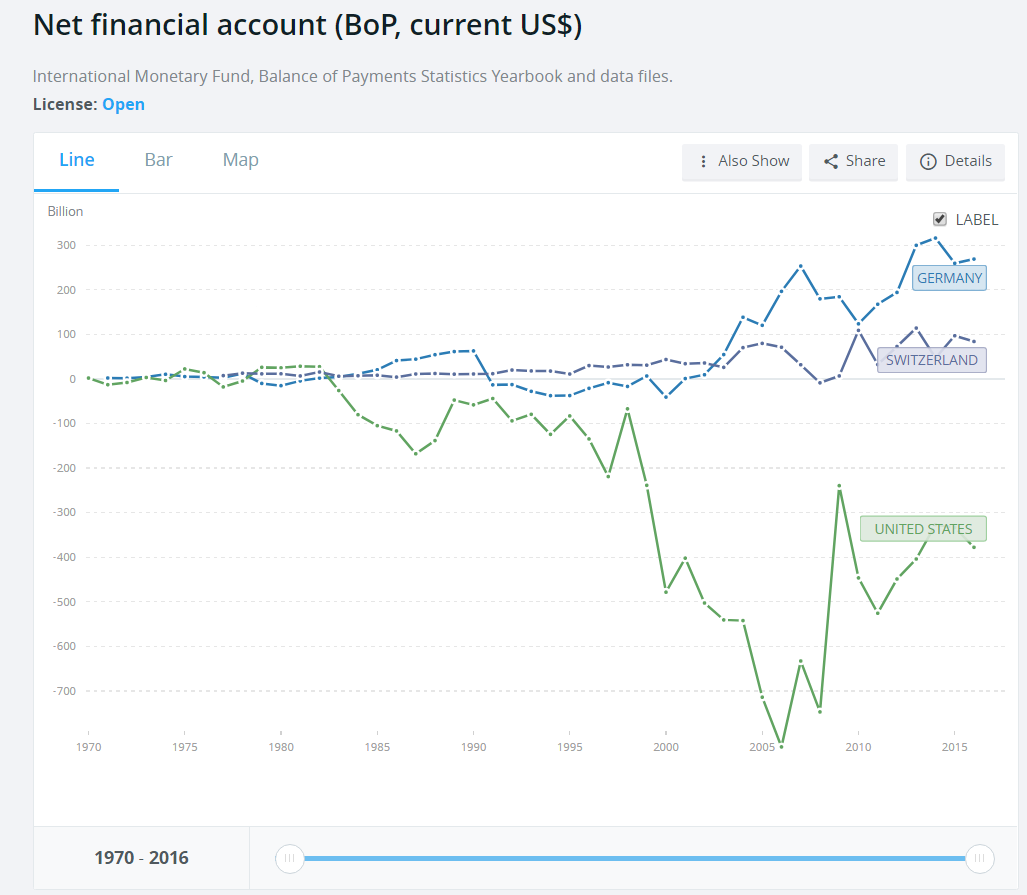
Source; World Bank
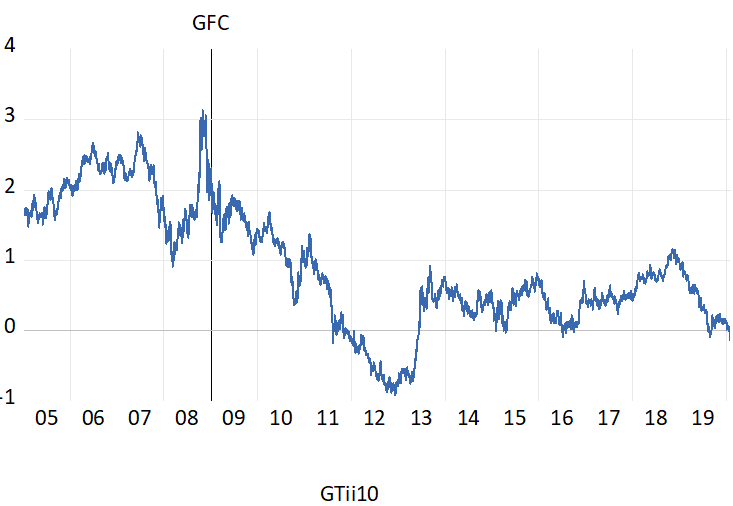
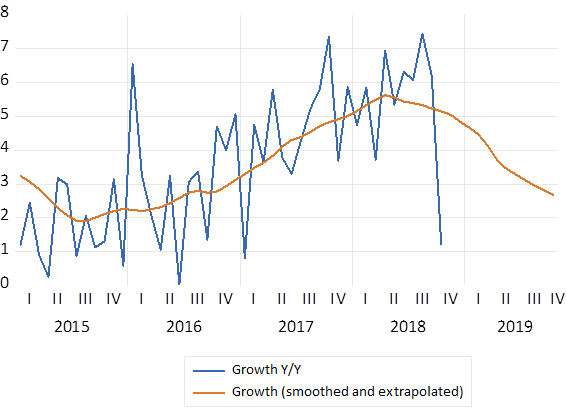
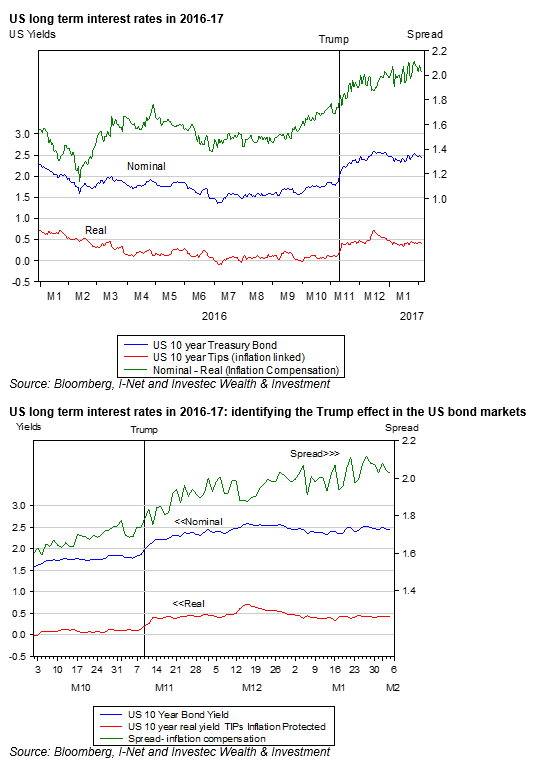
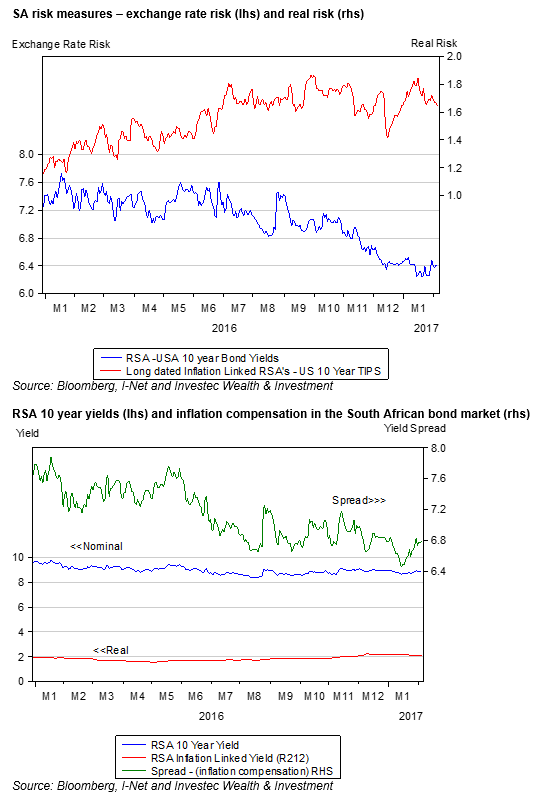
The flows of savings and flows into the US have not only moved the dollar they have moved interest rates. Perhaps the best measure of the global rewards for saving are found in the direction of the real rates of interest offered by an inflation linked bond issued by the US Treasury. Such a bond may be regarded as free of default as well as inflation risk. The risks of inflation are reflected in the yield on a vanilla bond. In the figure 9 below we compare the yield on a 10 Year US Treasury Bond and its inflation protected alternative with the same duration. As may be seen the nominal and real yields have both trended lower. The vanilla treasury bond was offering over 5% p.a in 2005- now the yield for a ten year loan provided the US is about 2.7% p.a. Real yields were over 2%. p.a. in 2005-06. They are now about a half of one per cent p.a. – after a period of negative returns in 2012-2013.
More important these yields have been rising in 2018 indicating some small degree of greater demands for capital. The real and nominal yields however remain very low by historic standards as will be appreciated. Normality – that is any sustained higher global growth rates, must mean much higher real yields. Higher nominal yields will also depend on how much inflation comes to be added to real yields.
Fig. 9; Nominal and Real 10 Year US Treasury Bond Yields (Daily Data 2005- 2018)
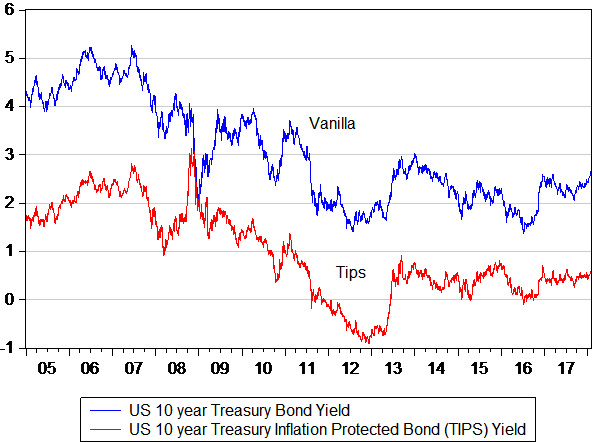
Source; Bloomberg and Investec Wealth and Investment
Fig. 10; Nominal and Real 10 Year US Treasury Bond Yields (Daily Data 2018)
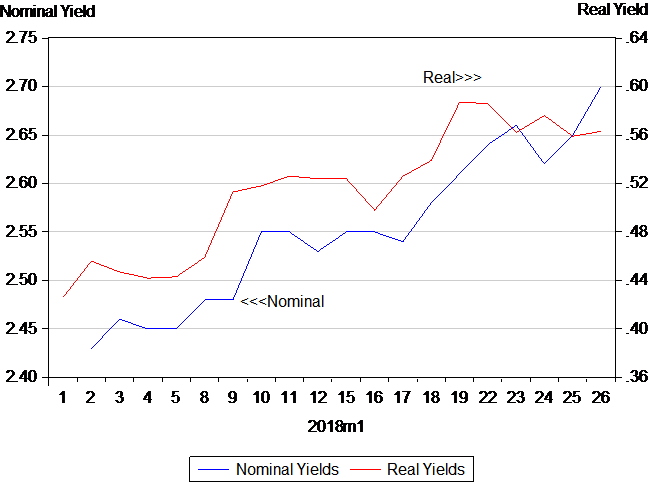
Source; Bloomberg and Investec Wealth and Investment
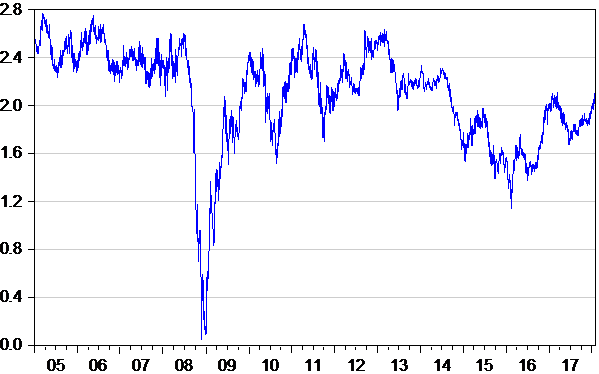
In figure 11 below we show the difference between these nominal and real interest rates. These differences represent the extra compensation bond investors receive for taking on inflation risk. It may be regarded as a highly objective measure of inflationary expectations. The more inflation expected the wider must be the spread between nominal and real yields. As may be seen- excluding the impact of the GFC this spread or inflation expected has remained between two and three per cent per annum. It is important to recognise that these inflationary expectations remain very subdued despite a recent increase. Equity investors as well as bond investors must hope that inflation expectations remain subdued enough to hold down nominal interest rates even as real yields rise to reflect a stronger global economy and a revival of capital formation. Low inflation with faster growth is an especially favourable scenario for equity markets.
Fig.11; Inflation compensation in the US Treasury Bond Market – spread between nominal and real 10 year US Treasury Bond Yields
Source; Bloomberg and Investec Wealth and Investment
[1] With acknowledgement to Burt Bacharach