Brian Kantor 3rd April 2019
The state of the US economy gets very close attention from investors in the stock market. The market moved sharply lower in late December on fears of a US slowdown. More recently it has bounced back strongly as the outlook became less threatening as the Fed came to share some of the market anxieties and indicated it would not now be raising short term interest rates.
This raises a question. Could you make a fortune buying or selling shares accurately forecasting US GDP growth rates over the next few years? The answer is a highly qualified yes. It would take very surprising – to others – very fast growth to deliver well above average returns in the stock market or, as surprising to all but yourself, very slow growth to deliver unusually poor returns.
Such phases of very fast or very slow growth, that presumably could confound the forecasters and investors, have in fact been very rare events. Since 1967 there have only been seven recessions in the US. There have been about the same number of so-called technical recessions – defined as two or more consecutive quarters when the real GDP declined.
I count 20 quarters since 1967 when growth in the US was less than 1% per annum. Average annual returns on the S&P over these low growth quarters was a negative 11.8%. The worst quarter for shareholders was Q1 2009 when the market was down 47% on the same quarter a year before. However slow growth was not always bad news for investors. In Q2 1981, when growth fell at a 2.9% rate, the S&P 500 Index was up by 19.4% on a year before. Yet the statistical relationship between growth and returns over these low growth quarters was a generally very weak one with a simple positive correlation of only 0.07- not nearly enough regularity to rely upon as an investment policy.
Slow growth quarters in the US; Scatter plot of Quarterly Growth and Annual Returns
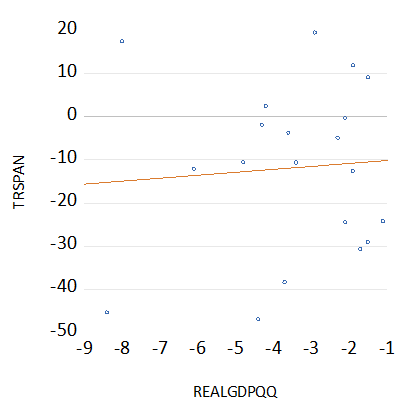
Source; Federal Reserve Bank of St. Louis, Bloomberg and Investec Wealth and Investment
I have also identified 98 quarters when growth in the US was a strong over 3% p.a. On average over these quarters the annual returns averaged an impressive 14.7% p.a. But this high average came with a great deal of variability around this average. The best annual return of 46.7% came in Q3 1982 and the worst -17.7% in Q4 1973. The statistical relationship between strong quarterly growth and annual returns is also very weak with a correlation close to zero.
Fast growth quarters in the US; Scatter plot of Quarterly Growth and Annual Returns
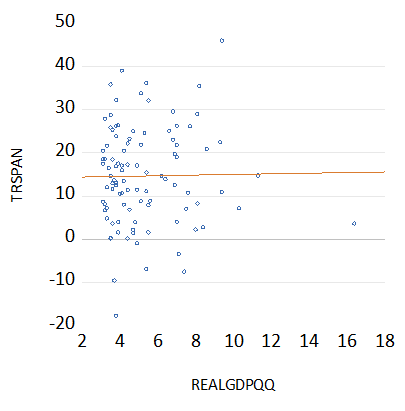
Source; Federal Reserve Bank of St. Louis, Bloomberg and Investec Wealth and Investment
The statistical relationship between quarterly growth and returns over the entire period 1967-2018 is altogether a very weak one. Linear regression equations that explain annual index returns with quarterly growth rates have very little explanatory power. Using smoother annual GDP growth rates in the equation do little better. R squares of no more than 0.16 indicate that there is much more than growth determining annual or even more variable quarterly returns. Generally accurate forecasts of GDP growth are simply not going to cut the returns mustard.
The problem for any reliance on patterns of past performance is that the markets are always forward looking. The well-considered, forecasts of the economy and of the companies dependent on it, will already have helped determine the current value of any company and of any Index average of them. Hence only economic surprises- indeed only large surprises in the GDP numbers can move the market. But anticipating these surprises is largely beyond the capabilities of the collective of forecasters – who will employ similar methods evaluating the widely available data that anticipates and makes up the GDP itself. Any surprises are going to surprise the forecasters as much as the market
However as recent developments on the share market indicate- down and up with not so much the GDP itself – but with expectations of it- what matters over any short period of time in the markets is not so much the forecasts themselves, but the confidence held in such forecasts. These will never be in a constant state. Any additional uncertainty about the state of the economy (less confidence in the forecasts) adds volatility to the market. That is wider daily moves in the market up and down. And when the market moves through a wider daily range share prices will move in the opposite direction in a statistically very consistent way.
The impact of risk (changes in the VIX) on S&P returns 2016-2019; Daily Data. Correlation (-0.74)
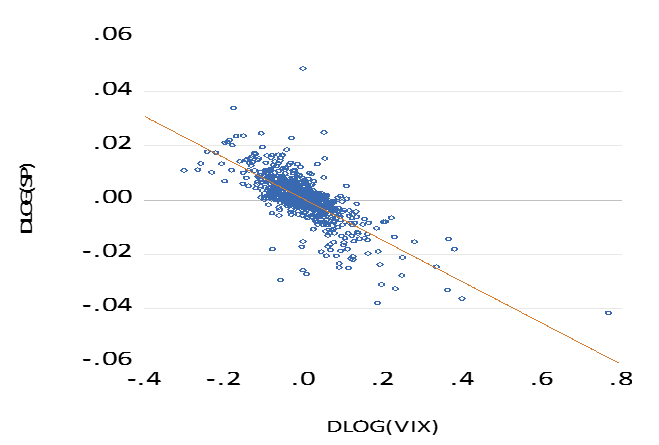
Source; Federal Reserve Bank of St. Louis, Bloomberg and Investec Wealth and Investment
Such changes in sentiment are not easily forecast. If they could be reliably anticipated this would undoubtedly be wealth enhancing to the forecaster or rather the sage. They are however best ignored by long term investors in favour of as good a forecast of the economy over the long run, as you can hope to make or receive.