Shorter version published in Business Day, Friday 15th November
The market value of any business will surely be determined by its economic performance. The most commonly applied and highly accessible proxy for performance are the earnings reported by its accountants and auditors. Cash dividends paid might be a superior indicator given how the definition of bottom line earnings has changed over time. Cash flows may be better still but are less readily available.
Robert Shiller provides 148 years and 1776 months of US stock market data. US S&P Index values, index earnings and dividends per share have followed a very similar path. The correlation between monthly prices, earnings and dividends, all up nearly 20,000 times since 1871, is close to one. [1]
Share Prices, Earnings and Dividends per Share (1871=100) Log Scale
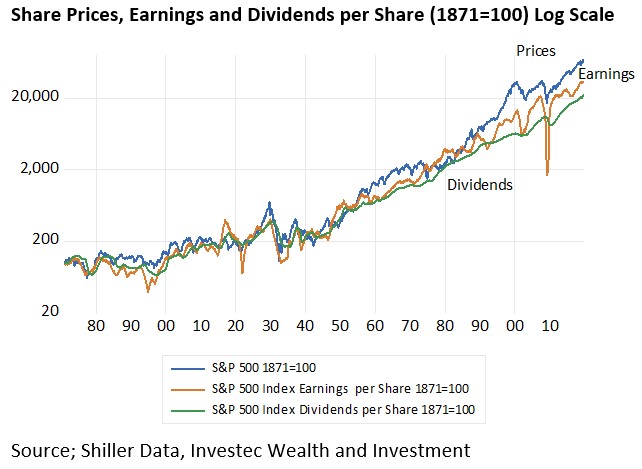
Source; Shiller Data, Investec Wealth and Investment
The P/E ratio for the S&P has averaged 15.76 over the long period with a low of 5 in 1917 and a high of 124 after earnings had collapsed in May 2009 while the Index held up to a degree. And dividends held up much better than earnings.
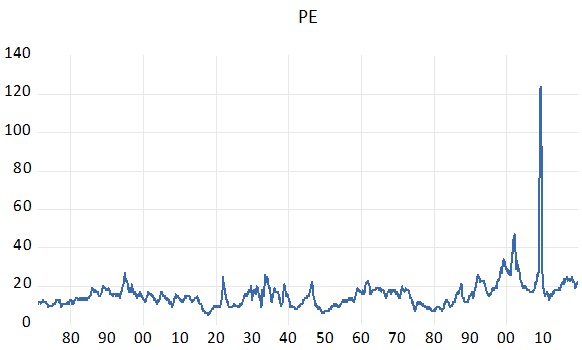
Source; Shiller Data, Investec Wealth and Investment
If we run a regression equation relating the Index to earnings or dividends per share the residual of these equations (that what is not explained by the model) has a strong tendency to trend to zero- given enough time. Or in other words the price-earnings ratios have tended to revert to their long-term average of 15.8 over time but with variable lags.
The higher the P/E multiple the faster earnings must be expected to grow when they to make up for the low initial yield E/P and vice versa. Expected earnings drive current market prices. Surprisingly higher or lower revealed earnings will tend to move prices in the opposite direction. Earnings may catch up with prices or prices follow earnings. The move to any long-term equilibrium can come from either direction, with advantage or disadvantage to shareholders.
Therefore be warned. Knowing that a PE ratio is above or below a long term average is not going to make you rich or poor speculating in the share market. The correlation of starting PE and returns realized over the next twelve months is close to zero.
The starting PE appears to become more helpful as a guide to investors when returns realized over an extended period are compared to it. High starting PE’s are associated with generally lower returns and vice versa over three or five year subsequent windows. When we relate starting PE’s 36 or 60 periods before with returns realized three or five years afterwards over the entire period we do get a statistically supportive result. Choosing the right entry point to the market and waiting patiently for the outcomes would have been generally helpful to investors.
Examining the relationship between prices and earnings in the US does reveal some extreme cases. In the late forties and late seventies the market would have appeared as very cheap. But these were not good times for the US. The US was fighting and possibly losing a war in Korea. In the mid and late seventies the US was subject to stagflation- rapidly rising prices and slow growth. Also very un-promising times for shareholders.
However normality returned to the great advantage of those who did not share the prevailing pessimism and stayed in the market. Between 1950 and 1953 the S&P PE crept up from seven to eleven times helping the total returns on the Index to average 22% p.a. In early 1978 the P/E was 8 times. Over the next three years the S&P delivered over 11% p.a on average as the US got its inflation under control.
By contrast in early 2000 at the height of IT optimism the S&P was trading at an extreme 33 times. Over the subsequent three years the S&P delivered negative twelve returns of -8.7% p.a. The IT bubble was only apparent after the event when expected earnings proved highly elusive.
S&P earnings collapsed during the GFC of 2008-09. From about $80 per index share in 2006 to less than $7 in early 2009. This sent the P/E multiple to 124 even as the Index fell sharply to a value of 757 by March 2009. According to earnings the S&P was greatly overvalued. According to dividends that held up much better through the crisis, the market appeared as deeply undervalued. The dividend buy signal proved the right one as the economy recovered (unexpectedly) with lots of (unexpected) help from the Fed and the Treasury. The S&P Index since those dark days has that provided returns that have compounded on average at of over 13% p.a.
What is very different about the share market today in the US are the extraordinarily low interest rates- both long and short rates – that have surely helped drive the market higher as competition for shares from the money and bond markets fell away. What may appear as a demanding PE of about 22 times becomes much more understandable given abnormally low interest rates. Is this the permanently new normal for interest rates. Or will interest rates mean revert? And what is normal? Only time will tell.