Brian Kantor and Carig Evans [1]
Investec Wealth and Investment
2nd December 2025
In days of yore an impressive, listed company might have been described as a ‘blue chip’. Now the modern equivalents are more likely to be characterised as ‘Quality’ companies. ZebraGPT, when asked why blue and why chip, answered in summary that “…the term “blue chip” symbolizes high-quality, stable investments, drawn from the prestigious connotation of blue poker chips, which represent the highest value in the game. This term emphasizes the reliability and strength of the companies classified as blue-chip stocks, making them preferred choices for investors seeking stability and long-term growth…” Blue chip and Quality are cut from the same block.
Fund managers with a focus on “Quality” will be compared in performance with their rivals applying a different style of investing. With perhaps a focus on a class of stocks known as “Value” or “Growth” designed to outperform portfolios with a Quality bias and also outperform the wider stock market.
How should a quality company be identified? A variety of Index constructors and rating Agencies select “Quality” companies and combinations of them to inform investors. The Table below indicates the criteria adopted by four of these different agencies. As may be seen there is much common ground and the correlations between these different Indexes and their movements are very high.
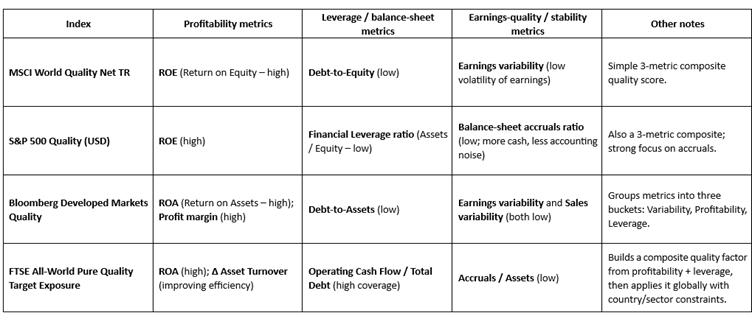
How would an enterprise qualify as a Quality business – or hope to do so? That is to evolve as a large successful and valuable business with predictable growth in profits and a strong balance sheet that is expected to ensure its survival through the good and not so good economic times. Such success, simply put, must be achieved through consistently successful allocations of capital by the business. A successful “quality” firm will have invested capital in projects and people and systems and marketing and knowledge and culture that provides good returns. If the growth in its bottom line, exceeds the opportunity cost of the capital employed by the firm, it will have every incentive to scale up its offers to customers, investing more capital to grow its top revenue line and its earnings.
Such positive returns on shareholders capital will then generate the extra cash required to fund its growth from its own operations. That is from its own savings reinvested in the business. The higher the cash content of its bottom lines, the less accounting noise, the easier it will be to grow without additional debt or raising fresh equity, convincing actual and potential shareholders of its quality, that is the predictability and sustainability of its business model. Organic growth, doing more of the successful same, perhaps with smallish bolt-on acquisitions of similar or complementary operations is to be preferred to growth through Mergers or Acquisitions, that could prove to be large expensive wastes of capital.
Investing in the intangibles, in employees and marketing, and in innovation through targeted R&D may also have become an increasing proportion of the extra capital employed as production and sales become more knowledge and data based. If so, adding such expenses to the balance sheet and amortising them realistically on the income statement, will better reflect the true nature of the modern enterprise and its long-term prospects. More so than conventional accounting that treats such investment as an earnings reducing expense, so ignoring the potential long-term benefits of such allocations of capital.
A mixture of cost of capital beating returns combined with a willingness to allocate extra capital for growth that facilitates growth is a true measure of quality and the source of value add for its shareholders. More so than simply realising high returns on capital – without continuously investing for growth. Investing in the Quality Index as constructed by MSCI since 2000 has however given superior returns for similar risks when compared to the MSCI Value and Growth Indexes. 100 dollars invested in the Quality Index in 2000 has grown to over 800 dollars compared to the World Market Index that would have grown to about $530.
Between 2000 and 2025 the monthly returns on the MSCI World Index averaged 0.61% per month with a Standard Deviation (SD) of 4.45% compared to 0.73% per month for the MSCI Quality Index for less volatility (SD of 3.47%) The MSCI Growth Index realised a market beating average 0.65% per month with more risk on average (SD 4.75%) and the Value Index achieved a below market return of 0.56% (SD 4.5) The superior returns from Quality began in 2009 and have continued over most years since. Though this year to November Quality has underperformed the World Market by about 4%. Correctly timing entry or exit from Quality or Value or Growth will remain a temptation.
Does the better long term return for less risk from investing in a Quality Index represent not just the benefits of Quality, that would always perhaps command a premium price enough to reduce realised returns for shareholders. But explained rather by consistent improvements in the quality of the average quality stock? A Quality company today has arguably become absolutely superior to one of 25 years ago and therefore more valuable on its improved merits. Or quality has improved in a surprising way encouraging investors to bid up the value of a quality company and so reduce future returns. Improved quality perhaps because managing return on capital, tangible and non-tangible is the new religion for managers?
The MSCI Quality Vs Market Indexes (2000=100) Month End Data
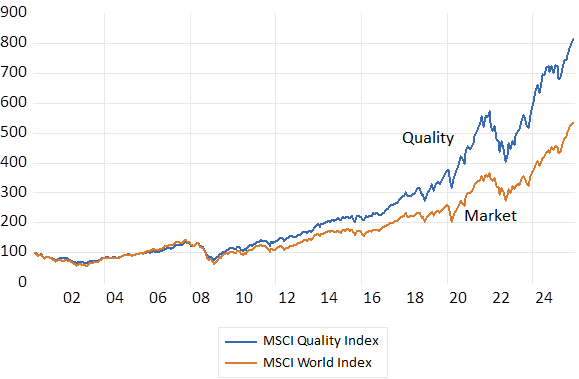
Source; Bloomberg and Investec Wealth and Investment.
The MSCI Quality Index vs the MSCI World Market Index; Annual Returns % p.a. (Y/Y) 2000-2025 Monthly Data
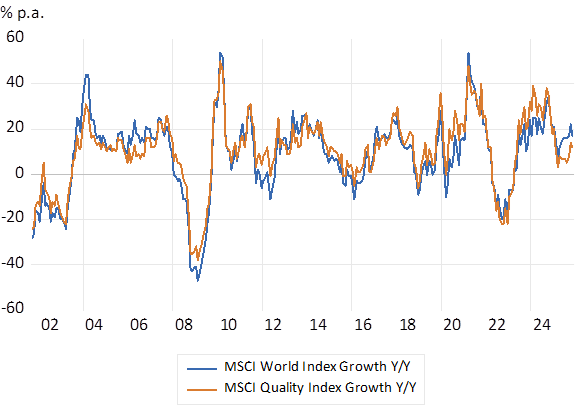
Source; Bloomberg and Investec Wealth and Investment.
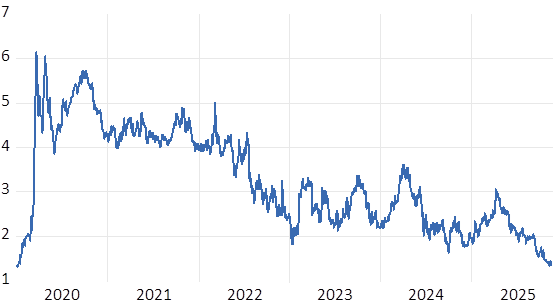
Returns. Quality vs World Market – Differences in Annual Returns
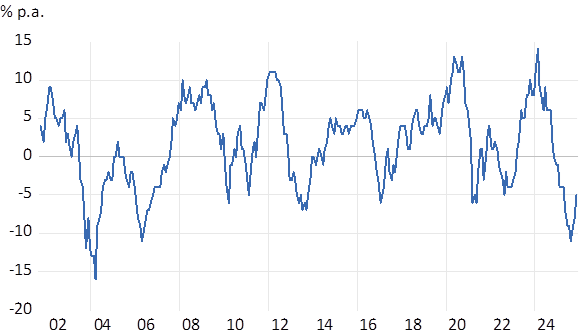
Source; Bloomberg and Investec Wealth and Investment.
[1] Carig Evans is an Analyst with Investec Wealth and Investment