Brian Kantor and Craig Evans
A “ Quality” company consistently delivers a market beating return on the shareholders capital they allocate. (see BD December 4th 2025) A quality company will be growing its profits and investing in additional capacity to scale up its operations. The quality firm will be able to fund its growth from its own cash flows after funding its capex and R&D even able to pay dividends, or buy back its shares, or repay debt that strengthen its balance sheet. Strong balance sheets – a high ratio of market value to debts incurred -means reduced risk of default that reinforces quality. The higher the cash content of these earnings, the less reliance the earnings depend on write offs or write ups of assets, the more reliable will be the reported earnings. Quality is defensive.
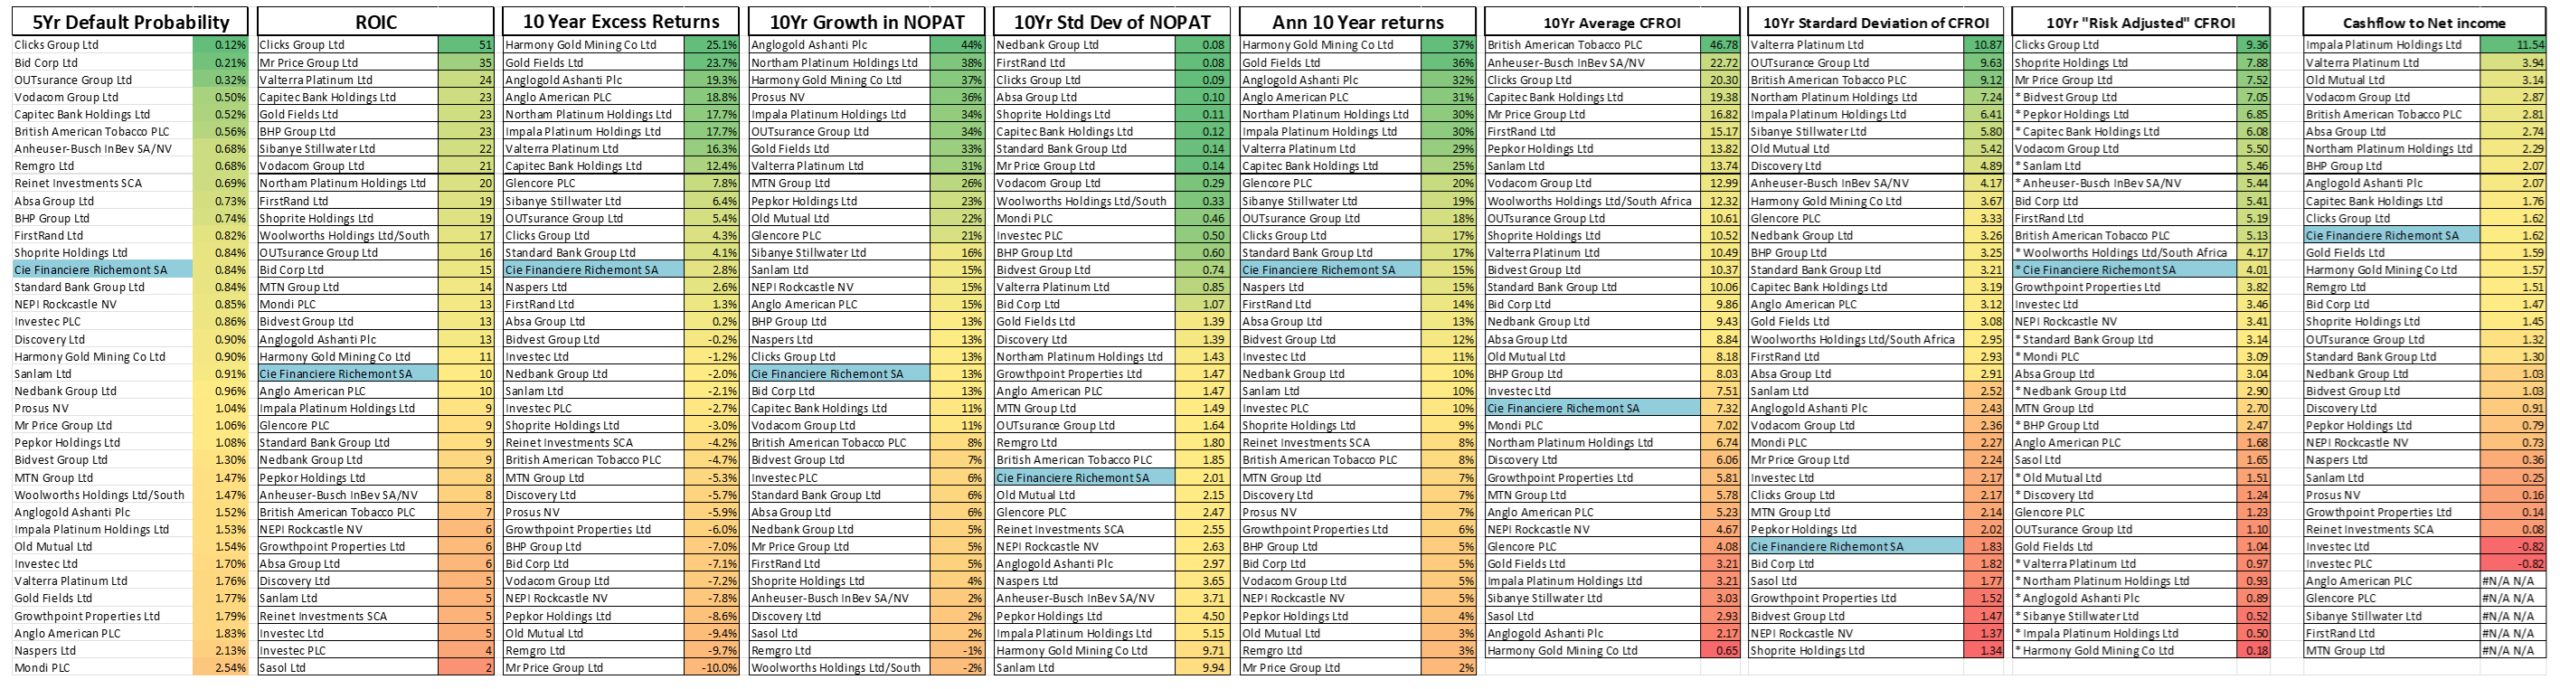
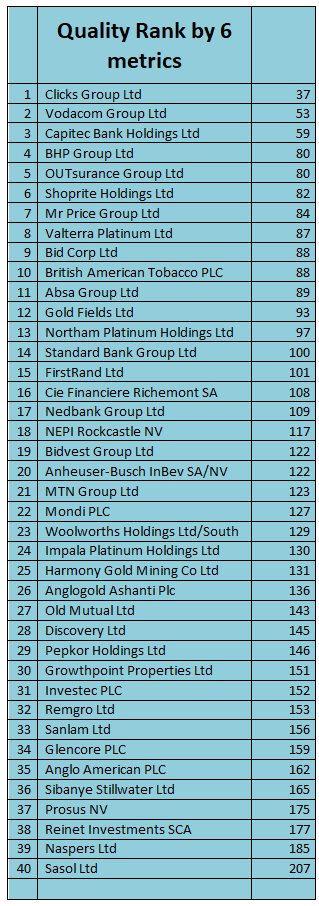
We have examined the largest companies listed on the JSE for their quality characteristics revealed over the past ten years and ranked them accordingly. We have ranked them on six measures of performance and taken a numeric average of these rankings to determine their overall Quality ranking. The criteria we used to judge quality are, the real return on cash invested over the past ten years (CFROI). We add the volatility of CFROI and the ratio of CFROI to its volatility (risk adjusted CFROI) as further quality measures to be ranked. We then add growth in Operating Profits (NOPAT) and its volatility to the mix. The chances of a company default and the cash contact of earnings are added as additional criteria to be ranked for our overall Quality Index.
Our ranking order is shown below. Clicks demonstrated the highest quality by a fair distance, with Vodacom ranked second and Capitec ranked third. They are followed by BHP, OUTsurance and Shoprite. Mr Price ranks sixth followed by Platinum miner, Valtera. Bid Corp and BAT bring up the Top Ten. There is little difference in the observed Quality of the other Banks, ABSA. First Rand Standard Bank. They find a place in the Top 15 quality companies demonstrating good returns on capital but rank lower because of moderate growth in profits.
Some summary comment on the rankings.
The recent surge of the Gold and Platinum miners to the top of the boards on Growth in NOPAT and Return on Capital calculations should be noticed. They consistently rank very highly on market return calculations that have been boosted by the recent surge in precious metal prices. But the volatility of earnings will continue to detract from the “Quality” of any mining company as will their inability to influence the prices received for their production.
Valtera ranked 8th on Quality, 13th on return on capital but 36th on the volatility of these internal returns. Growth in its NOPAT has been impressive with an average 31% (CAGR) Northam, another platinum miner, presents similarly. It is 13th ranked by overall Quality, 9th on return on capital, 32nd on volatility of returns on capital, ranking 2nd on growth in NOPAT and 19th on the volatility of NOPAT growth. Its earnings are also almost all covered by cash.
Clicks is Ranked First for Quality, its real return on capital. CFROI has been 20.3% p.a. over the past ten years. – ranking 3rd behind BAT (46.7% p.a) and Anheuser (22.72%) on this important metric. Shoprite lags behind Clicks on the return on capital ranking, ranking 12th on return on capital (10.52%) but with a very low Standard Deviation of these returns.
Capitec has delivered the 4th highest average CFROI (19.38 %) It ranks a less impressive 22nd on the Growth in NOPAT table (11% p.a) First Rand ranks 6th on real return on capital but much lower, ranked 31st, in growth in NOPAT. It’s relatively slow growth in NOPAT is the 2nd most predictable. Standard Bank has grown operating profits similarly to FSR but with a lower return on capital.
Richemont appears not to be a top-ranking quality company on the JSE. It ranks 22nd on real return on capital, 14th on risk adjusted CFROI, 20th on growth in NOPAT and 26th on the volatility of NOPAT growth rates. Vodocam presents more quality than MTN. On a risk adjusted CFROI, VOD ranks an impressive 7th and MTN 22nd. VOD lags MTN on the growth in NOPAT, 11% p.a. compared to 26% p.a. for MTN. VOD has delivered less variable growth ranked 9th compared to MTN ranked 22nd for its volatility of operating profits. VOD is ranked as the 4th least likely to default on its debt. MTN ranks 26 on this measure. While on the cash to earnings comparison VOD ranks highly as 4th while MTN appears well down this ranking order.
We compare below the stock market performance of the Top Ten (market cap weighted) with the JSE all share Index over the past ten years. The Top Ten Index would have outperformed the JSE All Share Index marginally over the past ten years. Yet the relationship between “Quality” and share market returns is not a clearly positive one. Investing in quality will not always outperform. Suggesting that investors have been willing in the past to pay up for the defensive characteristics of a quality company that is much less likely to fail its shareholders. And by so doing reduced realised returns. Investors should seek companies that will be improving quality over time and do so before their upcoming quality is widely recognised in its share price.
The Top Ten Index vs the JSE; Total Returns (2000=100) February 2000- February 2026. Monthly Data
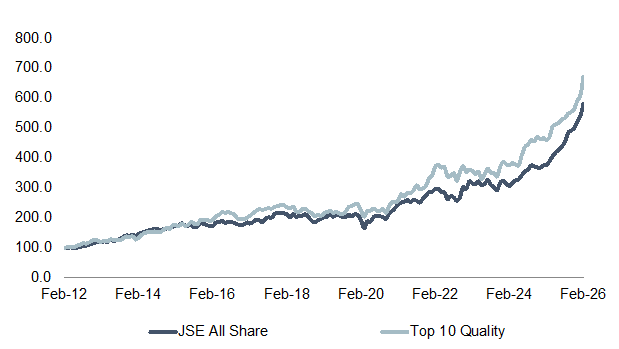
Source; Bloomberg, Holt and Investec Wealth & Investment
The Top Ten Index vs the JSE; Total Returns (2000=100) February 2000- February 2026. Monthly Data; 1 year to ten-year comparisons
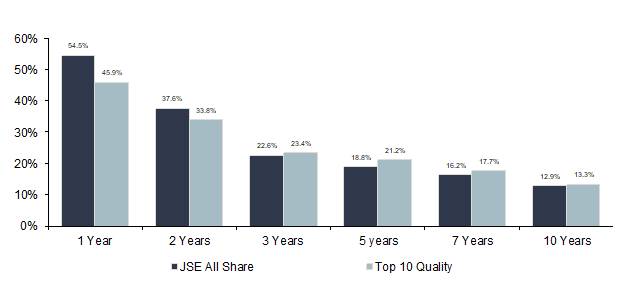
Source; Bloomberg, Holt and Investec Wealth & Investment
The Top Ten Quality Index Vs the JSE. Rolling Annual Returns 2000-2026. Monthly Data

Source; Bloomberg, Holt and Investec Wealth & Investment
The Performance Tables