You may have woken early on Wednesday 8th October 2025 to gold at over $4000 per ounce. Or nearly R70000 an ounce. First thing – do make sure those Kruger Rands are still in a safe place. The recent surge in the gold price has seen R100 invested in gold coins in 2000 increase their current rand value by about 32 times, gains equal to the same R100 if invested in the JSE All Share Index had dividends been reinvested. A close-run affair – yet a near triumph of the pessimists – always anxious about the wealth destructive influence of governments. Who by now may have found even greater solace in their bitcoins- more safely stored perhaps.
The impact on the revenue lines of SA gold producers who produce about 100,000 kilos of gold a year will be very significant, not only for the miners but also for the Receiver of Revenue. Today’s gold price at R69349 per ounce is about 58% higher than the average gold price realised in 2024. (and would be worth Close to 700 billion on the top revenue line if current rand prices were sustained for a year)
JSE Vs Gold 2000=100 Month End data. Total return Index (2000=100) Monthly Data
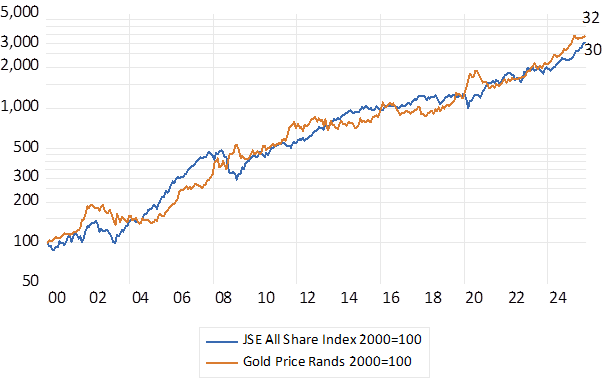
Source; Bloomberg and Investec Wealth & Investment
For the dollar investor it has been less of a contest. The dollar value of gold- $284 an ounce in January 2000 – has increased by 13.6 times since, compared to the S&P 500 Index, with dividends compounding, now up a mere 7.8 times. It should be recognised that the S&P offered very little gain between 2000 and 2012. And has surged since helped over the past five years by the increased value of the most technologically advanced of companies – the so described magnificent seven.
The Gold Price Vs the S&P 500 Index (Total Returns ) USD (2000=100)
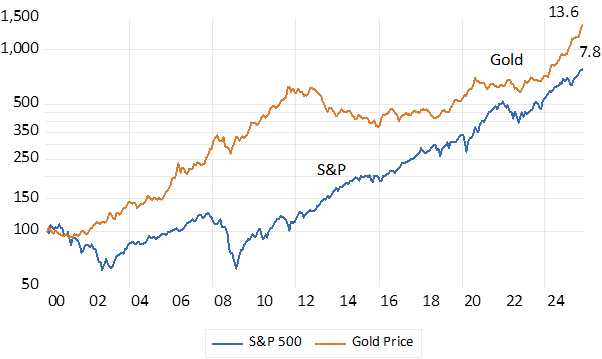
Source; Bloomberg and Investec Wealth & Investment
Yet the Mag 7 and the old-fashioned miners have something very much in common. That is the dependence of their share prices and market value on the expected growth in their revenues. When companies included in the Mag 7 are being valued at many times their current earnings the expected future performance is much more important than past performance. And the future will depend on generating revenue from the vast scale of current spending on R&D and capex being invested to power up their IT offering. Realising top line growth is all important if current spending is to be successfully monetised.
With one important difference. The top line of a mining company is fully transparent. The daily gold or platinum price translates directly into revenue and operating profits- unless the operating models are subject to immediate restructuring- which is unlikely. With the Mag 7 and aspirant producers of chips, and all else that goes into data centres and is drawn from them, the top line is only revealed with a lag- that is until the next quarterly report. You just have to wait and see.
Companies that surprise the market with extraordinary improvements in their share prices and market value need two essential ingredients. Firstly, excellent returns, or better still surprisingly improved returns on the shareholders capital they allocate. Secondly the opportunity to scale up their operations and their top lines investing more capital to take advantage of the high returns realised. What will have been surprising improvements in underlying metal prices will meet the revenue objectives of mining companies. And how they respond to the expected long-term growth opportunity with capex or acquisitions will add or subtract from the market value of current production.
The problem with most SA economy facing companies, retailers, banks and distributors for example is the absence of the opportunity to grow revenues. Their top lines are largely stagnant. As unsurprisingly are their operating surpluses. The non-financial corporations included in the Reserve Bank’s estimates of Gross Value Added and GDP have been growing their top lines, their operating profits and their incomes after taxes at little more than the rate prices in general have been rising since 2010. Growth realised at about an average rate of 6-7% p.a. in current prices or about 1% p.a in real terms. These companies in included by the Reserve Bank in its tables account for nearly 60% of the economy, 65% of the operating surpluses of all companies, 74% of all savings made and 62% of all capex. Despite slow growth in sales and profits they are not in any obvious distress according to key ratios and realise acceptable returns on capital invested. They simply lack the growth opportunity. As I have often argued they need more benign neglect from government and more TLC from the Reserve Bank.
Non-Financial Corporations; Gross and net Operating Profits – Share of Gross Value Added (Final Sales) 2010- 2025 Quarterly Data
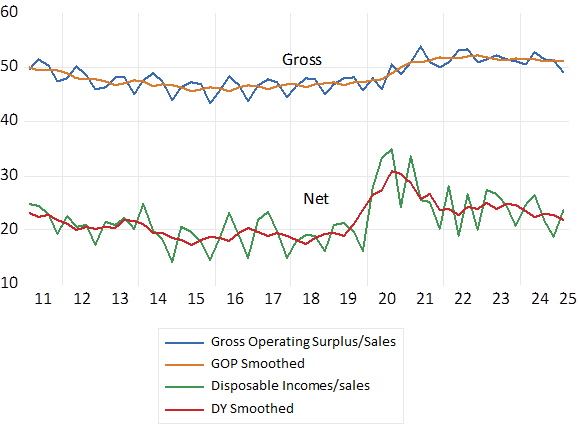
Source; SA Reserve Bank and Investec Wealth & Investment
Non-Financial Corporations Real Value Added and Annual Growth (2010-2025) Quarterly Data.
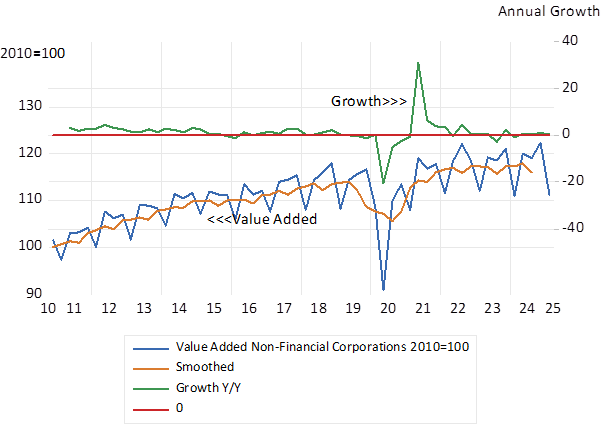
Source; SA Reserve Bank and Investec Wealth & Investment