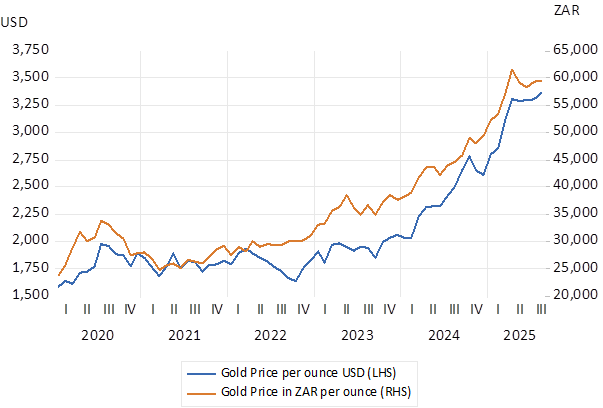
The Donald has slapped us with tariffs. He has also given us an extra R20 billion a year in the value of the gold we sell and added about R600 billion to the value of the gold shares listed on the JSE. The gold price has been on a tear this year. Up by 23% in USD and 19% in mighty ZAR. If we adjust for US inflation the real inflation adjusted dollar price of gold is now at record levels- higher than it was in early 1980 when the gold price broke 800 dollars per Troy ounce. In real rand terms the gold price is now almost to 3 times higher than it was in 1980.
Gold Price Monthly Data (2020-2025)
Real (Inflation Adjusted) Price of Gold USD and ZAR. Monthly data.
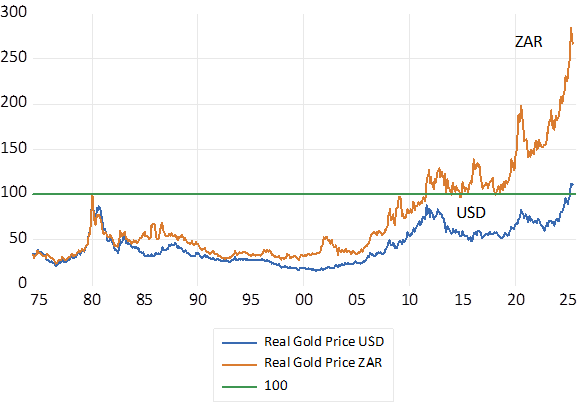
Source; South African Reserve Bank and Investec Wealth and Investment
A favourable trend for producers but not favourable enough to prevent a continuous decline in gold mined in SA. The rand costs of mining gold, especially their employment costs, have risen faster than prices in general reducing profits. There is also less gold to be found in the ground. The grade of the ore extracted for gold has fallen from 8 grams per tonne of rock in 1980 (a mere sliver of gold trapped in rocks deep underground) to about 6 grams and less today. It was 12 grams per tonne in 1970 before the gold price took off with the end of the gold standard. The last new significant increase in gold mining capacity was the South Deep venture undertaken by Gold Fields in 2015. And before that the Moab-Khotsang development of 2003- now part of Harmony.
Gold mining now plays a much-diminished role in the SA economy. In 1980 gold mines in SA produced close to 1000 metric tonnes of gold. Current output appears to have stabilised at about 100 tonnes. Gold sales in 1980 were equal to an imposing 15% of the economy (GDP) and 45% of all merchandise exports. These proportions today are about 2% of GDP and 7% of goods exported.
Annual rand revenue for Sales of Gold and Platinum Group Metals
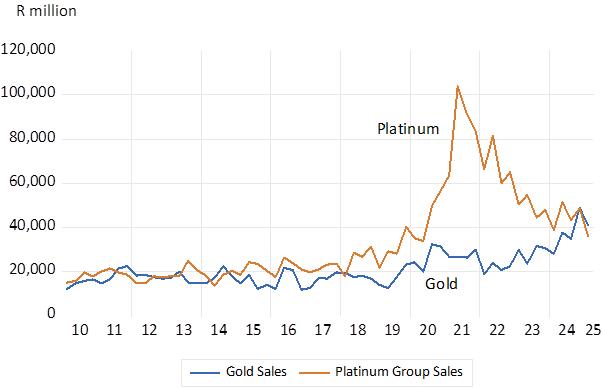
Source; South African Reserve Bank and Investec Wealth and Investment
What is good for the gold price has been even better for the shareholders in gold mines with significant reserves of gold in the ground. That are consistently revalued in line with the current price of gold to add to the prospective operating profits from the mines. It is suggested that proven reserves of gold of the SA mines are equivalent to about 20 times the current output of gold.
This year the market value of the four largest gold mining companies listed on the JSE (Goldfields, Anglogold, Harmony and Pan Africa) has about doubled this year. From a combined market value of 30 billion dollars in January, they are worth about 70b dollars today. Yet before we get carried away with the scale of this wealth creation on the JSE, it should be recognised that the combined value of the JSE listed gold miners is now less than that of the leading US listed global miner, Newmont, with a market value of USD75b.
The market value of JSE listed Gold Mines Monthly Data (2020-2025)
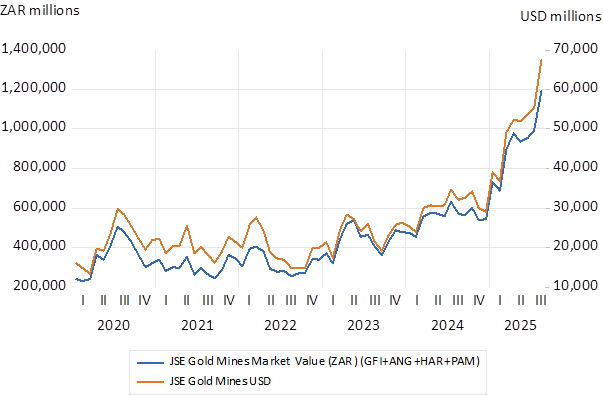
Source; South African Reserve Bank and Investec Wealth and Investment
The gap between the gold price and what is described as the all in sustaining cost of mining gold that excludes capex, has widened significantly –of approximately 1971 dollars per ounce produced and sold by Harmony, 1694 for Anglo and 1739 for Goldfields. Operating profit margins (the jaws) have therefore widened dramatically. You clearly get more bang for your gold buck investing in gold mines rather than in gold bars. Since 2020 the monthly per centage move in gold shares is about twice the move in the gold price- in both directions.
The changes in the gold price beta have a statistically significant impact on the changes in the value of the gold shares. They explain up to 50% of the move up or down in the value of the shares. Yet still leaving much to be explained in the behaviour of shares in gold mines by forces other than the gold price itself. For example, allowing for the risk that extracting the gold bearing rock will rise sharply as mines attempt to add production. Or that cash flush gold mine managers will pay too much to acquire other gold mines. Or most important, that the gold and other mines over their long lives may be subject to onerous taxes and regulations or even expropriation without adequate compensation. Especially likely when they prove highly profitable. Unknowns that clearly affects the present value of any mining venture. Gold in the ground is worth more in North America and Australia than in SA and Africa for these reasons – less uncertainty about mining policies – and more sympathy for the capital providers.
Judged by the Amendment of Mining Regulations Bill, now with Parliament, the SA government prefers not to recognise how the value of a gold or indeed any other mine, and the incentive to explore for and establish new mines, is adversely affected by policies that are hostile to risk taking shareholders. The government rejects advice from the mining industry and serves special not the general interest in a thriving mining sector.
[1] Campbell Parry and Graham Barr have been most helpful. They do not bare any responsibility for my interpretations