Equity equivalence is a better alternative to giving away a significant chunk of equity in a good business to some undeserving party with the right lucky credentials, racial and or political. It has been used in SA before Starlink, as in the allocation of the original casino licences in the Western and Eastern Cape in the late nineties. Bidders competing for the limited licenses were required to qualify for them by offering the wider community valuable add-ons of their own invention. The support of Sun International for the establishment of the Cape Town Convention Centre helped win them the valuable right to operate the only Casino in Metropolitan Cape Town.
The same opportunity for the Gauteng Government to establish what could have been a highly profitable monopoly Casino in downtown Johannesburg, with an accompanying and competitively determined large contribution extracted for the renovation and sustainability of the precinct, was proposed at the time. And rejected as politically unacceptable given competing and powerful empowerment interests. En kyk hoe lyk dit nou.
Presumably Starlink has attached value for its shareholders in the opportunity to supply its internet connections to rural South Africa. And is willing to pay up in advance in the form of conspicuous public benefits for the opportunity to earn these potential profits.
The same principal of equity equivalence could be or could have been applied to the award of the right to operate the State Lottery. Clearly this right is a valuable one judged by how much the contending parties have been willing to spend challenging the award in the Courts. How much better it would have been for the SA public and its taxpayers if the Minister could choose between the contending and technically and racially qualified partners simply on how much cash, or better, in equivalent benefits, they would have been willing to pay up for the lottery license?
Though the ratio of the lottery revenue to the cash paid out by the lottery to its winners, merely 50%, the lottery is a very poor gamble. Though the charities and others who receive the grants paid for by the lottery, part of the 50% retained after salary and other expenses, can be regarded as a compensating public benefit that the mostly low-income lottery players are paying for. Provided that is the lottery grants are awarded on merit; which it appears sadly, may not be the case.
The value of a license to operate a Casino, or a gambling machine in SA, has surely been competed away. By internet-based gambling houses supplying a convenient phone based and easily scalable service to gamblers with essentially very low fixed costs. And with minimal operating costs in the form of a few programmers using probably codes taken off the shelf. And games that now presumably are even more easily enhanced with the aid of AI. The internet does not require an expensive to build and maintain a physical Casino. Or pay its croupiers, clerks and security officers. Or provide prize money to keep horses racing so that gamblers can bet on them.
The gambling market in SA appears as highly competitive judged by the barrage of adverts directed at gamblers watching sporting events encouraging them to join the action so easily through their cell phones and gambling accounts. By a variety of licensed operators. Highly profitable businesses usually see their profits competed away. I am confident this will prove the case in time for the rapidly growing sports betting industry.
The competition for the bets made by the gambler takes place in part through the odds offered. Improve the gamblers odds of winning or losing less, reduce the share kept by the house, and the bets placed with a house will tend to increase. The highly competitive casino market in Las Vegas proves the point. Casinos there compete publicly on the odds offered.
Yes, the average gambler must lose to keep the house in business. But the average loser is surrounded by a presumably normal distribution of above average winners and below average losers, per day, year, or even over a lifetime of what some presume is irrational gambling. You may just get lucky. And there is fun to be had in playing the odds, win or lose, as ever larger number of betters on sporting events confirm. Though gambling and losing more than can be afforded can become dangerous to the addict.
For the internet gambling houses their most important cost will be advertising and promoting their plays on TV. It may be of some consolation to the non-gamblers to recognise that this spend on TV is in fact paying for the sport they are watching. It is the competitively determined – and rising value of the TV rights to broadcast the games and to advertise betting opportunities on them, that pays the wages of the players and determines the value of the clubs that hire them. And reduces the profits of the internet gambling house. Provided there is no licensed monopoly to limit competition.
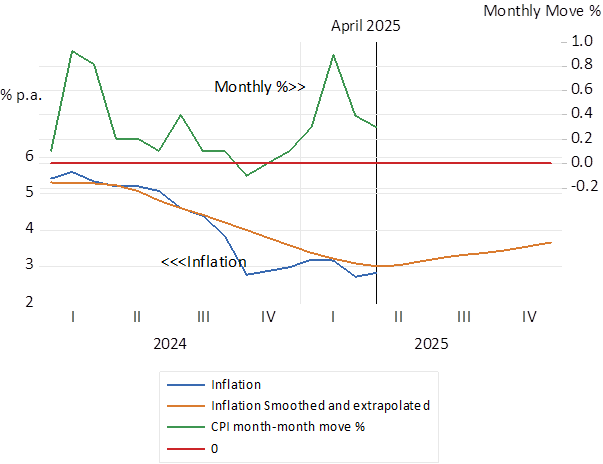
Inflation in SA has declined sharply from a 5% plus rate in early 2024 to 2.8% p.a. (see below) If current trends persist the rate of inflation will rise to about 3.5% by year end. We consider the reasons for the recent decline in inflation and the conditions that could give rise to persistently low inflation in SA, that is 3% p.a. or lower inflation sustained over an extended period.
South African Inflation (2016 – 2025) Monthly (Annual % change in CPI Index)
Source; Bloomberg, SA Reserve Bank and Investec Wealth & Investment.
South Africa Inflation (2024-2025) Monthly (Annual % change in CPI Index)
Source; Bloomberg, SA Reserve Bank and Investec Wealth & Investment.
The reason for this welcome relief from rising prices seems clear. The demand for goods and services has been growing very slowly, thanks to highly restrictive monetary policy. And the supply side of the economy given rand stability helped further recently by a degree of absolute ZAR strength has meant moderate increases in the CPI. Weak demand and increased supplies- lower price imports – have meant modest pressure on prices.
The demand side
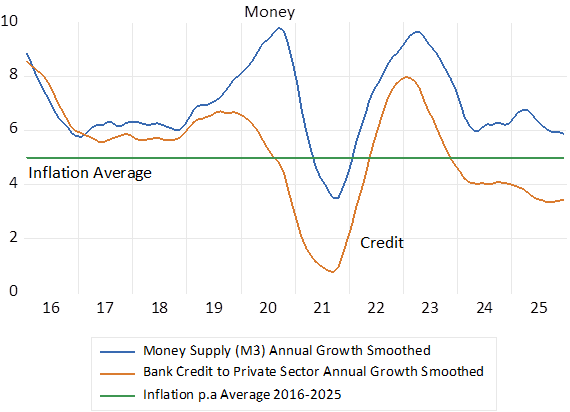
The growth in the money supply and bank credit, that influence spending in a direct way, has remained highly restrained for an extended period- going back to 2016. Money supply (bank deposits) have grown by an average 7% p.a. since 2016 and bank credit supplied (accounting for a large majority of the asset side of the bank balance sheets) has grown by an average 5.3% p.a. Inflation has averaged 5% p.a. over these years, implying real growth rates of the supply of money and credit, in line with the slow rates of growth of output(GDP) and national incomes.
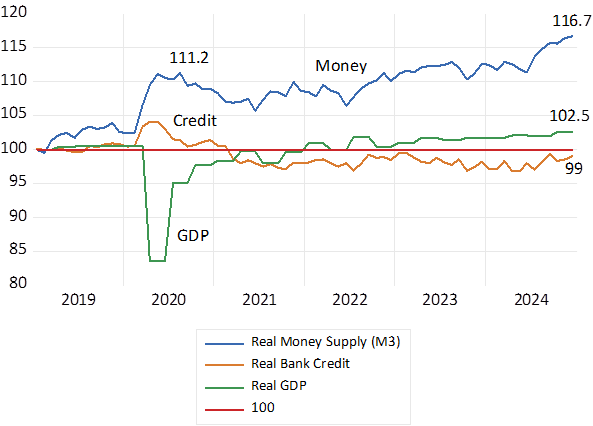
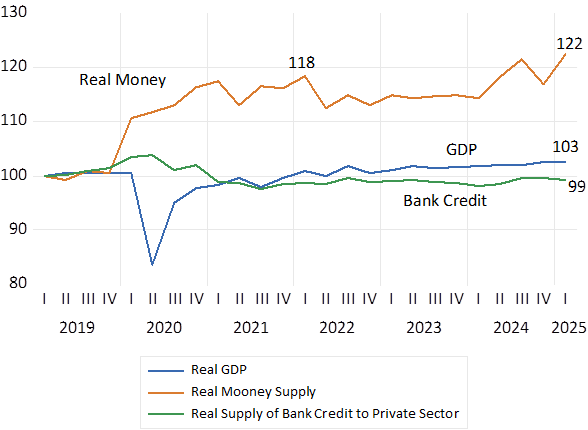
Reactions by the Reserve Bank to the Covid lock downs led to a brief spurt in money supply growth in 2020-2021. Money and credit growth picked up again in 2022-23 as commodity and metal prices recovered but then as abruptly fell away. Both money and credit growth have declined consistently since then. Real bank lending to the private sector is below pre-Covid levels as is GDP. The money supply- that is mostly bank deposits, is barely up (by a mere 4%) since 2020. Given such financial repression, any upward pressures on prices from extra spending – from the demand side of the price equation, were surely not possible. Furthermore, this lack of demand itself would have been inconsistent with real GDP or GDE growth of more than one per cent p.a. since 2023- as has been the case. Growth as well as prices respond to a mixture of supply side and demand side forces. When real demand grows very slowly as it has in South Africa, real income growth cannot advance at a much faster rate. Regardless of what may well have been faster potential growth. One can never know what might have been with less austere monetary policy settings.
The money supply and credit cycle 2016- 2025. Monthly data annual growth rates
Source; Bloomberg, SA Reserve Bank and Investec Wealth & Investment.
Real Money Supply (M3) and in Bank Credit supplied to private sector. (2019=100)
Source; Bloomberg, SA Reserve Bank and Investec Wealth & Investment.
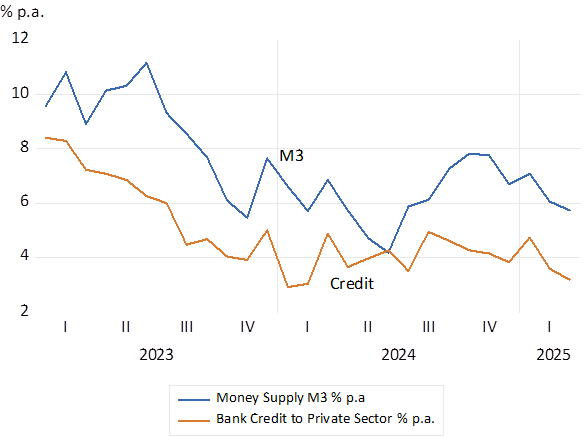
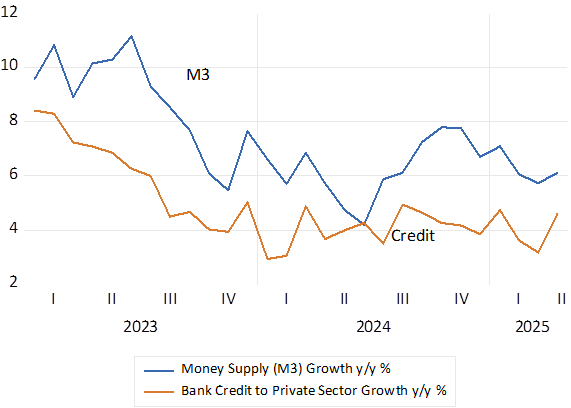
Since early 2023 the growth in the money supply and bank credit- at current prices- has declined significantly as is shown below. The trends, especially when adjusted for (lower inflation) have continued to restrain spending.
Growth in Money Supply and Bank Credit 2023-2025. Monthly % p.a.
Source; Bloomberg, SA Reserve Bank and Investec Wealth & Investment.
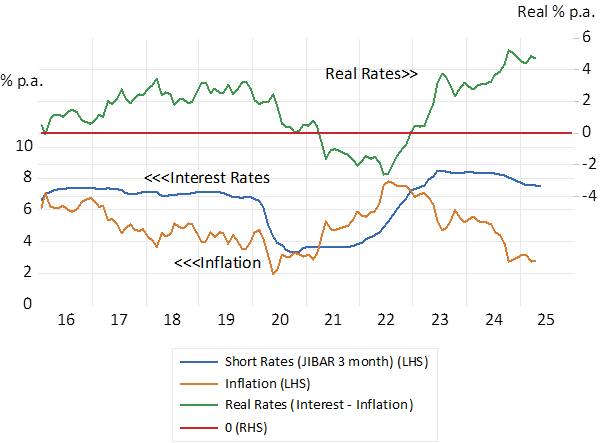
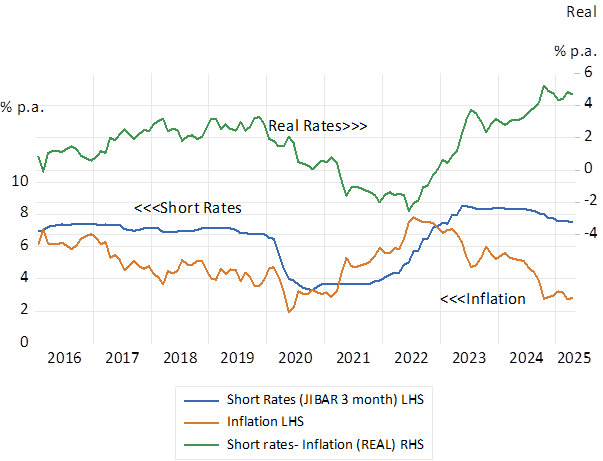
Monetary policy must also be judged as highly restrictive by observation of policy determined short term interest rates. When interest rates are adjusted for falling rates of inflation, to approximate the real cost to borrowers of raising credit it may be seen that real interest rates are at a post 2016 peak. The Reserve Bank does not target money supply or credit growth rates. The instrument of policy is its interest rate settings. Policy determined short term interest rates were hiked sharply in response to higher inflation, post Covid. This represented a highly predictable SARB interest rate response to a supply side shock to prices. A shock linked to the Ukraine crisis, combined with a weaker rand. Borrowing costs are now lagging well behind the more recent decline in inflation sending real rates to very high demand suppressive levels. Clearly borrowing from the banks to fund working capital or a mortgage on a home loan has been strongly discouraged by the high real costs of or rewards for money and credit. And the demand for and supply of bank credit have accordingly grown at a very slow rate.
Significant relief for borrowers is not expected any time soon. The forward rates of interest on May 25th indicate a mere 25 bp reduction in short rates over the next twelve months. Without significantly lower interest rates to encourage the growth in demand for bank credit and spending by households and firms, GDE will not grow beyond forecast GDP growth rates of less than 2% p.a. And too little rather than too much spending (relative to potential supplies of goods and services) will continue to weigh heavily on the pricing power of domestic producers.
That is without pressure on prices emanating from the supply side of the economy that could independently force prices higher- and demand still lower in response to supply side driven higher prices. Especially should higher interest rates follow supply side shocks- as has so often been the been the case in SA. The Reserve Bank has predictably increased interest rates, whatever the cause of higher prices, less supplied or more demanded. Though the pressure on prices has almost always come from the supply side – from exchange rate weakness. shocks. As was the case most recently in 2022. Ideally temporary supply shocks on the price level should be ignored by monetary policy.
Short term interest rates before and after inflation. 2016-2025.
Source; Bloomberg, SA Reserve Bank and Investec Wealth & Investment.
The Supply side
The supply side of the SA economy is dominated by the exchange value of the ZAR and the impact it has on the prices of imported and exported goods. The SA economy is heavily dependent on imports and exports- equivalent together of about 60% of GDP – and usually well balanced. The cost of an average imported good or service, and the value of an export depends on global price trends- usually expressed in USD . Their translation into rand prices is via the exchange rate. With something of a lag – as prices adjust gradually to higher exchange rate related costs of supply- higher or lower depending turn on the hedging strategies adopted. For an important influence of this kind, we can refer to the USD price of a barrel of oil that finds its way into petrol and diesel prices and the CPI will be a combination of world market prices in USD and the exchange value of the rand.
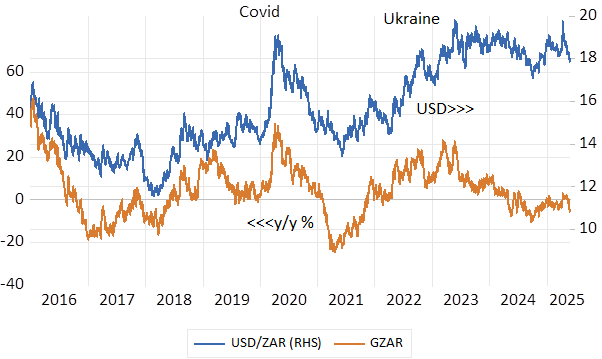
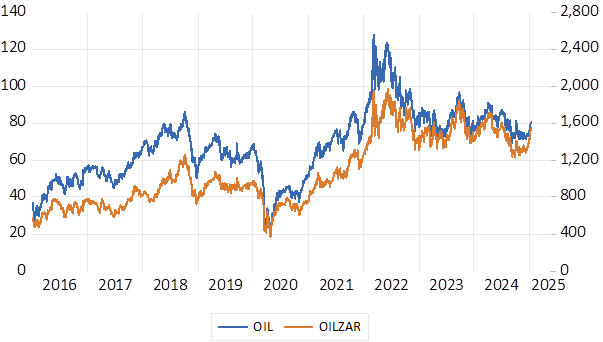
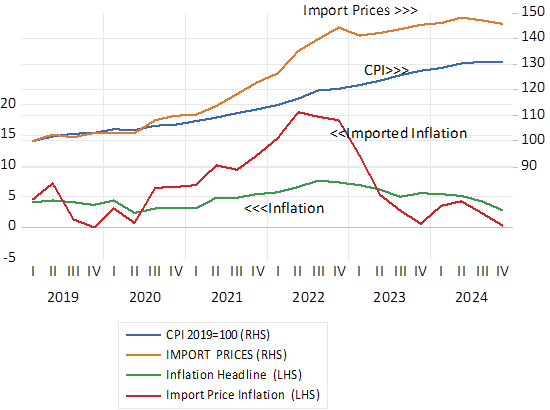
It should be recognised that the exchange value of the ZAR has remained unusually stable over recent years. As a result, the supply side of the economy, has generally benefitted from a degree of rand stability, helping to contain inflation about the 5% p.a. mark until the recent improvement. This degree of rand exchange rate stability came after the Zuma inspired, significant degree of rand weakness, of 2015, And absolute strength in the ZAR over the past year and a half has helped take the inflation rate to 3% p.a. Helpfully also the price of oil in USD and in ZAR has been in retreat for most of the period since 2022, having spiked between 2020 and 2022 in response to the invasion of Ukraine and the sanctions imposed on Russian oil. The prices of all imports to SA have stabilised and the inflation of imported goods was close to zero by year end 2024. Recently oil price trends in USD and ZAR have been very helpful in containing upward pressure on costs and prices.
The USD/ZAR exchange rate and annual movements in the USD/ZAR (y/y % p.a.)
Source; Bloomberg, SA Reserve Bank and Investec Wealth & Investment.
The price of Brent Crude Oil USD per barrel (LHS) and ZAR per barrel (RHS)
Source; Bloomberg, SA Reserve Bank and Investec Wealth & Investment.
Price Indexes SA CPI and Import Price Deflator (2019=100) and annual % changes in Indexes. Quarterly Data
Source; Bloomberg, SA Reserve Bank and Investec Wealth & Investment.
Supply and demand working together
Inflation in SA has receded because of a combination of weak demand and an improving supply side – led by a more stable exchange rate and helpful oil prices. Inflation can stay at low levels if these supply and demand side forces are sustained.
Slow growth threatens fiscal sustainability. It raises the risk of a SA government resorting to creating money to fund government spending for want of revenue and under the pressure of a growing interest rate bill on a budget- that seriously constrains other more popular spending plans. Slow growth and the money supply responses that may accompany slow growth increases the expected rate of inflation over the long term. These expectations lead in turn to higher long-term interest rates on government debt to compensate lenders for more inflation expected. So adding to the interest costs of servicing government debt and putting further strains on government budgets.
Slow growth may restrain incomes and spending and so, absent supply side forces lead, to lower rates of inflation. But slow growth threatens fiscal stability, it discourages domestic capex and capital inflows to fund them that might have improved longer term growth prospects. Thus, weakening the exchange rate and despite weak demand putting upward pressure on prices. The relative strength of the ZAR has had very little to do with recent demand destroying interest rate settings and the consequently slow realised rates of growth since 2020 and indeed since 2016. It is almost all a supply side story – the prospect of somewhat improved growth prospects given the GNU.
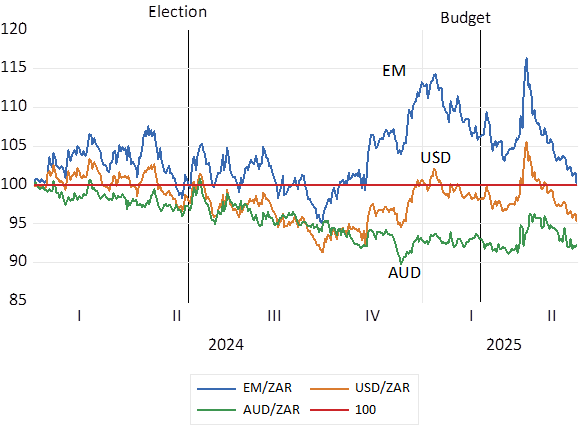
The dependence of the outlook for economic growth on political developments in South Africa and therefore for the exchange value of the ZAR has been very clearly illustrated recently. More growth expected leads to a stronger rand as capital tends to flow more to than away from South Africa and vice versa, slower growth expected frightens capital away and tends to weaken the rand- and raise inflation rates.
The Government of National Unity (GNU) formed after the elections of May 2024 were regarded as more growth friendly. And the rand strengthened accordingly. Dounts that the GNU would survive the arguments over the 2025-26 Budget proposals led to rand weakness. The agreements on the Budget reached finally in May 2025 have reinforced the GNU and added too rand strength (see below) For the ZAR it is the supply side – the outlook for growth that matters most. The demand side and interest rate settings matter much less. And unaccommodating interest settings and slow growth in money and credit that slow down growth lead to rand weakness rather than rand support.
Political developments and the ZAR in 2024-2025. Daily Data. Lower numbers indicate rand strength.
Source; Bloomberg, SA Reserve Bank and Investec Wealth & Investment.
A firmer rand responding to what the markets decided would be growth improving economic policy settings has meant less pressure on inflation. Combined with sustained negative pressure on the demand side of the economy the prospect of low rates of inflation over the long run becomes more likely with supply side reforms that raise potential growth rates.
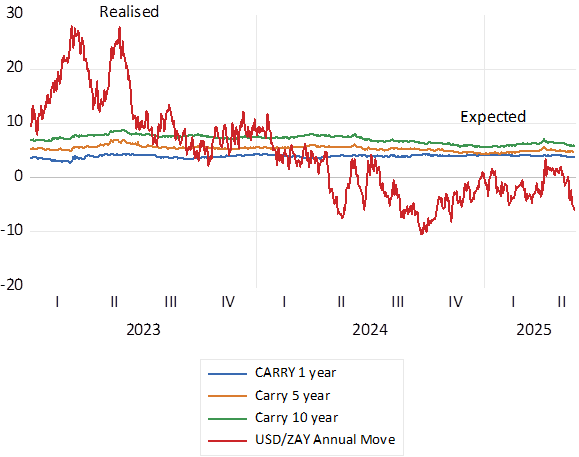
Ideally the prospect of more growth and less inflation would be recognised early by the bond and currency markets. In the form of lower interest rates and a narrower risk spread between RSA and USA interest rates. That is in the form of a narrower carry and therefore a lower cost buying dollars for forward delivery.
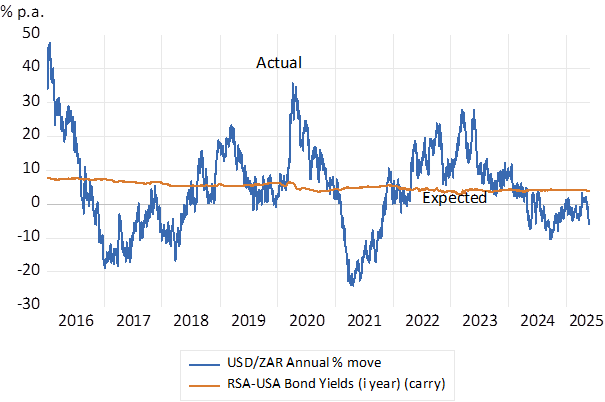
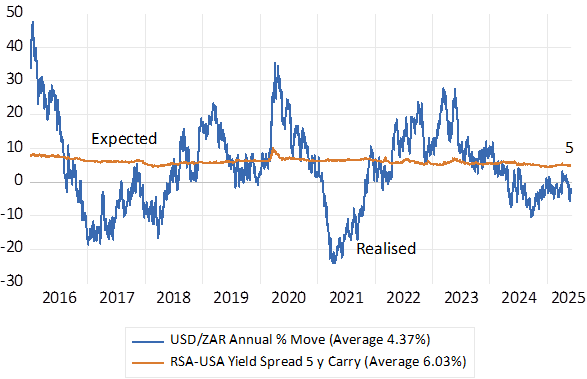
SA Interest rates, their levels and differences with US rates have still to register any marked change in sentiment about the outlook for SA growth and inflation. Forward exchange rates still consistently expect the rand to weaken, compounding at about 5% p.a. Since 2016 the difference between one year SA and US government bonds has averaged 5.1% p.a. with very little deviation about this average. The actual market movement in the rand over one year averaged less over the past 15 years by 4.4% p.a. with very wide fluctuations about the average (see below) Currently the difference between one year SA and US Treasury yields has declined to less than 4%. The carry for five year and ten year money has remained above 5% p.a.
Inflation expected in South Africa is not only reflected in longer term interest rates. It is also revealed by differences between RSA rand rates of interest and USD interest rates for securities of the same duration. These differences in interest rates indicate the expected direction of the ZAR. The greater the difference, the more the ZAR is expected to weaken over time, by application of the interest parity condition. The difference in yields is equal to the difference between the spot and forward rates of exchange. Arbitrage maintains this equilibrium condition.
This yield difference -the so-called carry- represents the cost of hedging the rand against the US dollar. The difference in yields may also be regarded as the reward for or the cost of expected exchange rate weakness or strength. What is gained on the interest rate spread is offset by (expected) ZAR exchange rate weakness. And vice versa for holders of USD receiving lower interest rate income but offset by a stronger dollar.
The wider the difference in interest rates the more expensive in ZAR will be dollars to be delivered in a year or more ‘s time. This cost of hedging will also find its way into the prices of imported goods and services. Rand weakness expected adds to inflationary pressures. To hope to sustain inflation at low rates, these interest rate differences must narrow to simultaneously reduce expected rand weakness and so ease the supply side pressures on prices especially the prices of goods or services imported.
The expected and realised move (% p.a) in the USD/ZAR over one year (Daily Data 2016-2025
Source; Bloomberg, SA Reserve Bank and Investec Wealth & Investment.
Source; Bloomberg, SA Reserve Bank and Investec Wealth & Investment.
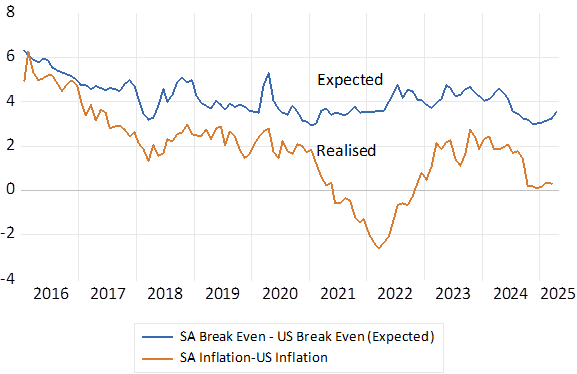
Yet not only is the rand expected to depreciate at a compounding rate of close to 5% a year over the next five years and more, the rand, is also expected to weaken by more than the difference in inflation in SA and the US. As it has done in the past. The ZAR has weakened over the years at a significantly faster rate than past differences in inflation between SA and the US. It is expected to continue to do so at about 2% a year faster than the expected differences between SA and US inflation.
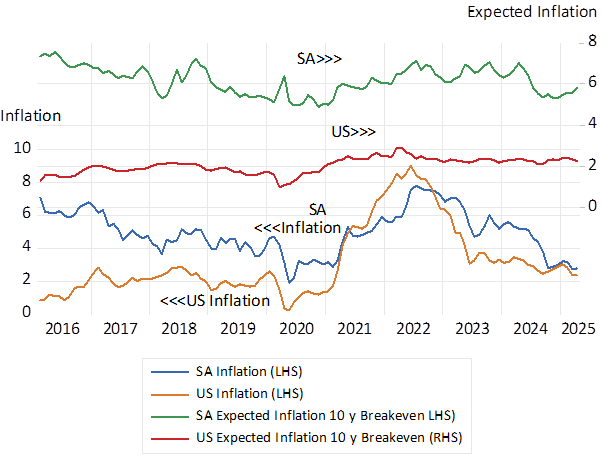
We show the differences between actual inflation in the US and SA and the differences between expected inflation in the two economies. Expected inflation in SA over the next ten years is expected to average 6% p.a. Expected inflation over the same ten years is expected to average about 2.2% p.a. A difference of close to 4%. Yet a dollar delivered in ten years’ time would cost over 6% a year more p.a. (see below) Put differently the ZAR/USD exchange rate has not conformed to Purchasing Power Parity, it is expected to deviate still further away from PPP in the future. Inflation expected in the Bond market is calculated objectively as the difference in yields between a vanilla bond and an inflation protected bond of the same duration, the so-called breakeven rates.
SA and the USA Actual inflation and Expected Inflation 2016-2025
Source; Bloomberg, SA Reserve Bank and Investec Wealth & Investment.
SA and USA Differences in Inflation and Inflation expected
Source; Bloomberg, SA Reserve Bank and Investec Wealth & Investment.
There is much to be done to raise the growth in SA output and incomes. There is as much to be done to convince investors in and outside SA that faster growth and less inflation and less exchange rate weakness over the long run is to be expected. Setting a lower target for inflation will not be sufficient to the purpose. A stable ZAR will be essential. Changing the long-term growth trajectory would be very helpful to the purpose of faster growth with less inflation to accompany a stronger ZAR. And as important for immediate improvement in the growth and inflation outcomes would be less inflation and exchange rate weakness expected.
It would also be helpful that should the economy suffer from another shock to the ZAR for global or SA specific reasons, the Reserve Bank could refrain from raising interest rates. To let the price shock work its way through without incurring further damage to the growth prospects of the economy and the demand side of the economy, when already under pressure of higher prices, with higher interest rates. Judged by past performance the danger to the economy will be policy determined interest rates that are too high rather than too low for the good of the economy. It is to an improved supply side of the economy we should look for permanently low inflation. The danger of demand led inflation, given the prevailing Reserve Bank culture, is a small one.
Inflation in SA has declined sharply from a 5% plus rate in early 2024 to 2.8% p.a. in April 2025 – for the usual supply and demand reasons. The demand for goods and services has been growing very slowly, and the supply side of the economy, given rand stability, recently even absolute ZAR strength, has brought moderate increases in the CPI.
Bank lending to the private sector has been growing very slowly. Adjusted for prices, bank credit was still below pre-Covid levels and the real money supply after a spurt during Covid had grown by only 4.2% between 2021 and the first quarter of 2025. Recent growth rates in money and credit have trended lower. A financial state that can be described as severely repressive. Given the weakness of demand for goods and services it is unsurprising that real incomes and output (GDP) were but 3% higher in q1 2025 than they were in early 2019. When real demand grows as very slowly as it has in South Africa, real output could not have advanced at any faster rate than it has, meaning an expensive waste of a somewhat better growth opportunity.
Real Money Supply (M3) and in Bank Credit supplied to private sector. (2019=100) Monthly data to 2025 q1.
Growth in Money Supply and Bank Credit (January 2023-2025 April) Monthly % p.a.
The lack of demand for and supply of credit and money is explained by short term interest rates set by the Reserve Bank. As inflation has come down the real cost of borrowing for overdrafts or mortgages has risen to very high, near record levels. Despite two 25 bp, highly delayed, reductions in the policy determined rate. The money market now predicts but a mere 25 bp further reduction in short rates over the next twelve months.
Without significantly lower interest rates to encourage the demand for bank credit and spending by households and firms, frustratingly poor GDP growth rates of less than 2% p.a. should be expected. And the prospect of too little rather than too much spending (relative to potential supplies of goods and services) is likely to continue to weigh heavily on the pricing power of domestic producers. The demand side of the economy is very unlikely to threaten higher prices for the foreseeable future without an unlikely change of mind set at the Reserve Bank.
Short term interest rates before and after inflation. 2016-April 2025. Monthly Data
Yet the unpredictable supply side of the SA economy, perhaps accompanied by a sharp reduction in the exchange value of the ZAR could always drive prices higher. And judged by past performance the Reserve Bank would then then drive interest rates higher to further depress demand that would come under pressure from higher prices. Imports and Exports account for a combined 60% of GDP. Their translation into rand prices depends on the exchange rate. That recently has been strong against the USD, the Aussie dollar and the EM basket. The Import Price Index (with a large oil component) was falling in 2024.
Price Indexes; SA CPI and Import Price Deflator (2019=100) and annual % changes in the Indexes. Quarterly Data
Slow growth aided and abetted by aggressive monetary policy while disinflationary, threatens growth and fiscal sustainability. It discourages domestic capex and capital inflows to fund them that might have improved longer term growth prospects. Slower growth expected frightens capital away and tends to weaken the rand- and raise inflation rates. Doubts that the GNU would survive the arguments over the 2025-26 Budget proposals led to some rand weakness. The agreements on the Budget reached finally in May 2025 have reinforced the GNU and added rand strength (see below) For the ZAR it is the supply side – the outlook for growth that matters most for the rand and in turn inflation.
Political developments and the ZAR in 2024-2025. Daily Data. Lower numbers indicate rand strength.
Long term interest rates, their levels and differences with US rates have still to register any marked change in sentiment about the outlook for SA growth or inflation. Forward exchange rates still expect the rand to weaken at about 5% p.a. over the next five years. (see below) And bond market yields- the difference between high vanilla bonds and elevated inflation protected RSA interest rates – indicate that inflation is still expected to average over 6% p.a. over the next ten years. Meaning expensive debt to add to fiscal strain.
Expected inflation and the cost of hedging the ZAR will not narrow, nor borrowing costs decline meaningfully, absent any significant improvement in the SA growth outlook. But nonetheless a welcome 3% p.a. inflation in SA could be sustained absent any exchange rate shocks initiated by politicians, local and foreign. Would setting a 3% inflation target mean more growth sensitive management of the demand side of the economy? Would it secure rand stability? Only possibly. It might however encourage the worst, anti-growth instincts of the Bank to prevail, especially when the supply side of the economy, the exchange rate, does not play ball.
The five-year RSA-USA carry and the realised annual move (% p.a) in the USD/ZAR (Daily Data 2016-2025 June)
SA and the USA; Actual inflation and Expected Inflation over the next 10 years (2016-2025)