The RSA can hope to raise tax revenues at a faster rate and reduce the pace at which government spending is growing to escape the debt trap. Reversing the direction of government spending and revenues is made very difficult by a stagnant economy. But there is also another way. That is to sell assets owned by the government. Not only could asset sales or leases be a source of extra income for government to replace extra borrowing and interest paid, but it could also be a most valuable exercise in the broad public interest. Regardless of how much the asset sales would fetch which after much neglect might need much maintenance and repair.
The assets would be made to work much better in private hands and with private business interests managing the outcomes for a bottom line- as private owners are empowered to do. The assets would come to be worth more and their owners and service providers, including employees, would increase their output. Incomes and taxes. Sadly the status quo, the well rewarded private interests of the managers, workers and especially those of the suppliers of services and goods to the state owned enterprises on highly favourable corrupted terms stand in the way of the pursuit of a broad public interest.
But there is another way. That is to sell assets owned by the government. Asset sales or leases could be a source of extra income for the government to replace extra borrowing and interest paid. Regardless of how much the asset sales would fetch, they would be made to work much better in private hands. The assets would come to be worth more and their owners and service providers, including employees would increase their output. Incomes and taxes paid.
Do the foreign exchange reserves managed by the Reserve Bank on behalf of the government fall into this category of assets that could usefully be sold down? It is possible to hold too much as well as too little gold and foreign currencies on the national balance sheet. They are held as a useful reserve against unforeseeable contingencies. That is a possible collapse of exports or capital inflows, or a flight of capital that would make essential imports unobtainable or foreign debts and interest unpayable.
South Africa’s foreign assets have grown strongly over recent years, in current rand value. Since 2010 these reserves have grown from R299 billion to the current levels of approximately R1200b. But when these reserves when measured in foreign purchasing power, in US dollars, while they have doubled since 2010, they still only amount to 62b dollars. There are not many battleships or jet fighters you can buy with that loose change.
Much of the growth in the stock of reserves is the result of a weaker rand. Which is accounted for in the SARB books by mark to market value adjustments of their higher rand values. Which currently have an accumulated value of over R400b. They are described as the Gold and Foreign Asset Contingency Reserve and is recorded as a liability to the Government on the SARB balance sheet. On any consolidated Treasury and SARB balance sheets these assets and liabilities cancel out leaving only the market value of the forex reserves as a net government asset. As SARB Governor has pointed out, these reserves would have to be sold to realize any value.
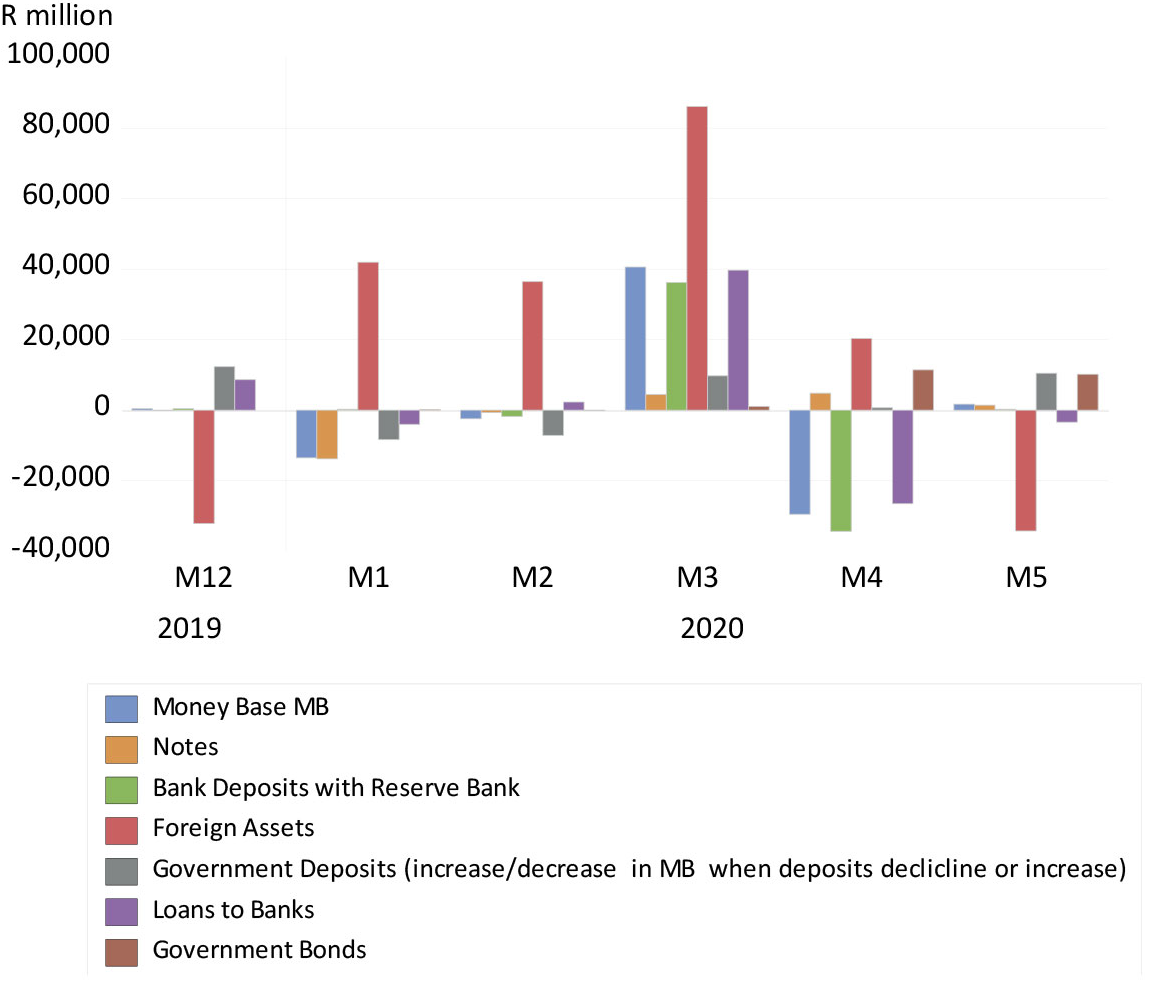
The other R800 of foreign assets on the SARB balance sheet originally come from the positive flows on the balance of payments when the Reserve Bank buys dollars in exchange for deposits in rands at the Reserve Bank. The extra foreign asset held by the SARB is then held in the form of a dollar or other foreign exchange deposit in a foreign bank. The extra liability is a (cash) deposit at the SARB.
In recent years the source of extra dollars supplied to the SARB is very likely to have come from the Government Treasury rather than the private banks and their customers. A flexible exchange rate will have balanced the supply of and demand for foreign currency transactions that originate in the private economy. The extra dollars acquired by the Treasury will have been borrowed by the government offshore or have been the result of flows of foreign aid or concessionary finance provided SA. And then sold by the Treasury to the Reserve Bank for an additional credit on the Government Deposit Accounts with the SARB.
The Gold and Foreign Assets of the South African Reserve Bank. R million
Source; SA Reserve Bank and Investec Wealth and Investment
It is striking how rapidly the Government Deposits with the Reserve Bank, deposits denominated in foreign currencies and rands grew since 2010. Though these cash reserves peaked in 2020 at close to R250b and have been drawn down sharply in recent years. It may be asked why these cash reserves need to be as large as they are? Why expensive debt must be raised by the government to hold cash.
Yet running down the Treasury deposits to spend in SA increases the cash reserves of the banking system. The SA banks now hold large amounts of excess cash reserves- upon which they earn now high market related interest rates. Should however the banks turn the extra cash into extra bank lending the supply of bank deposits, the money supply, will grow rapidly and encourage inflation. It is a possibility that will bare close attention.
SA Government Deposits with the South African Reserve Bank
Source; SA Reserve Bank and Investec Wealth and Investment
SA Private Banks; Required and Actual Deposits with the Reserve Bank and Cash Reserves Borrowed (to August 2023)
Source; SA Reserve Bank and Investec Wealth and Investment
South Africans this week benefitted from a powerful demonstration of our integration into global capital markets. On Tuesday November 14th, the interest yield on the key ten-year US Treasury Bond fell by about 20 b.p. from 4.63% to 4.44% p.a. By the end of the day, the 10 year RSA bond yield had declined by the same 20 b.p. from 11.66% to 11.45% p.a. The yield on a RSA dollar denominated five year bond fell from 7.52 to 7.19 per cent p.a. leaving the yield spread with the US TB, an objective measure of SA sovereign risk, slightly compressed at 2.76% p.a. The dollar weakened across the board. And with higher bond values the share markets almost everywhere responded very agreeably for investors and pension plans. The JSE gained nearly two per cent on the Tuesday (5% in USD) and again by a further near 2% on the Wednesday.
All this on the news that inflation in the US had fallen to by a little more than had been expected after the CPI remained unchanged in the month. The chances of further increases in short term interest rates therefore fell away as they have in SA. And long rates moved in sympathy. Should the US economy slow down sharply as slowing retail spending as strongly suggested in a print released on Thursday, declines in US short rates will follow in short order adding to dollar weakness and rand strength. Or at least as investors, if not yet the Fed, thinks.
US Inflation; Annual, Quarterly and Monthly
Source; Federal Reserve Bank of St.Louis and Investec Wealth and Investment
All it might be thought as much ado about relatively little- a mere blip on the CPI. If you could predict nominal US GDP and interest rates over the next ten years you would be able to predict share and bond values with a high degree of accuracy- if the past is anything to go by. Predictions that will not be much affected by the failure of the Fed to manage inflation during the Covid lockdowns. Or by what has been its near panic and confusing rhetoric in dialing back inflation. That so roiled the equity and bond markets in 2021- and 2022, a strong bull market in most of 2023 has yet to fully recover from.
Perhaps the most intriguing feature of recent trends in the US GDP has been the growing share of Corporate Profits after taxes in GDP. The ratio of these profits to GDP- have nearly doubled since the early nineties. A profit ratio that investors must hope managers, with the aid of R&D, in which they invest so heavily, can defend to add to share values.
Another question about the long run value of US corporations and their rivals elsewhere will be about the cost of capital by which their expected profits will be discounted. A puzzle is why have long term interest rates in the US have increased as much as they have this year? It is not more inflation expected that have driven up yields. They have remained well contained below 3% p.a. despite higher rates of inflation. Quantitative tightening – the sale by the Fed and other central banks of vast amounts of government bonds bought after the GFC and during Covid, is surely part of the explanation.
But it is not only vanilla bond yields that have risen this year. Real yields- the inflation protected bond yields – have risen dramatically this year. From near zero earlier in 2023 to their current over 2% p.a. Clearly capital has become not only more productive of profits in the US – it has also become more expensive in a real sense, to counter productivity and profit gains when valuing companies. Will it remain so? That is the trillion-dollar question.
US Share of after tax corporate profits in GDP.
Source; Federal Reserve Bank of St.Louis, Investec Wealth and Investment
The gap between real interest rates in SA where a very low risk ten-year inflation linker offers over 4% p.a. – making for very expensive capital for SA corporations, and the US – has narrowed sharply. Surprisingly perhaps, real interest rates in SA have not followed global trends. Making for at lease relatively lower costs of capital for SA based corporations, good news, which we can hope will lead to more investment.
Inflation Protected Real Bond Yields RSA and USA – 10 year bonds
Source; Bloomberg and Investec Wealth and Investment
Risk Spreads – RSA-USA 10 year Bond Yields
Source; Bloomberg and Investec Wealth and Investment
I wrote as following in a letter to the Wall Street Journal in response to an op-ed piece by John Cochrane a formidable youngish economist very much in the Chicago School tradition – where he was a professor. He is now a Senior Fellow at the Hoover Institution. You can follow his blog Blog: http://johnhcochrane.blogspot.com/
Incidentally I have not yet had any acknowledgment from the WSJ – nor do I expect them to publish my letter.
Here is an answer to Cochrane’s (WSJ, August 1st ) question – … does money alone drive inflation? Money (mostly) in the form of deposits in banks held by households and by firms, on behalf of their shareholders, is clearly an asset of the depositor and a component of their wealth. Because the deposit liabilities issued by the shareholders of banks are not expected to be repaid (net wealth goes up with bank deposits because they are expected to grow with the economy and the demand for deposits and will not have to be repaid or be expected to be repaid). Similarly as Cochrane posits, government bonds, or any paper issued by a government, that are never expected to be repaid by taxpayers, are another component of wealth. An excess supply of net money (deposits) or an excess supply of net bonds- over and above the willingness of wealth owners (savers) to hold those assets –would lead to an increase in the demand for other assets and goods and services- and so generally higher prices for goods, services and other assets as portfolios are adjusted to excess holding of money or bonds. That is lead to inflation.
But where could the excess supplies of money and or bonds come from? As Cochrane indicates only and always from a fiscally undisciplined government. A fiscal theory of inflation is essential in explaining all inflations everywhere. It is hardly an original concept.
A fiscally constrained government can call on its central bank and its private banks to fund all the bonds it wishes to issue. The central bank most simply might directly fund the government by buying its additional paper and crediting the government’s deposit account with it. Which, as the Treasury deposits with the central bank run down as the government spends more, would increase the cash reserves of the banks. And their ability and perhaps willingness to lend more- including to the government. And if extra bank lending ensued by banks flush with extra cash, the supply of bank deposits would increase by a multiple of the additional cash deposits injected into the system.
Or the central bank could at its initiative supply (lend) extra cash to the banks so that they may be willing to fund the government with the same influence on the supply of bank deposits as the government spends more. And if the increase in the supply of deposits – bank liabilities and of government paper – bank assets – exceeded the willingness of the public to add to their deposits or bonds – inflation would follow. The deposit liabilities of the banks and their loans to government (bonds) would be increasing at a similar rate. The banks, perhaps more than a wider set of financial institutions, would be holding many of the extra bonds issued by governments- particularly in many countries mostly without a well-developed bond market but very vulnerable to fiscal difficulties and high rates of inflation. Inflation is not an American invention.
Inflation is explained by the inter- actions of governments, banks and the wealth owning public. The exchange of a hugely increased supply of extra deposits held by US banks with the Fed (QE) (cash) for extra private or publicly issued securities after 2010 was restrained – it was understandably not a risk loving lending encouraging time for the US banks after the GFC. The money multiplier (M2/Cash Reserves) collapsed – and the supply of deposits grew slowly and more or less in line with the demand for extra deposits issued by the banks, so avoiding much inflation. But not incidentally of share or real estate prices that were on a tear. Predicting inflation will always demand a close watch of fiscal policy – of the supply of and demand for government bonds in wealth portfolios – and of the behavior of banks- central and private. It will always be complicated.
Banks are different to other financial intermediaries. They do more than borrow and lend. They manage the payments system without which any modern economy could not function. The payments system cannot be allowed to fail and banks deserve support should their stability come into question. Which, as was apparent in the US recently, cannot be taken for granted.
Banks maintain the payments system by supplying deposits to their clients and transmitting many of them on demand. They bear the operating costs of doing so – which are considerable. They have to remain viable businesses, so they have to cover their operating costs with transactions fees and more importantly by lending long and borrowing short- realizing net interest income, essential to their profits and survival. Banks, competing with each other, are forced to operate with very limited cash reserves. They hold very limited reserves of equity- that is owner’s capital – and are highly leveraged for the same profit seeking purpose. The dangers come with the territory.
A margin of safety for them is to be found in their holdings of other liquid assets, mostly debt issued by the government, with varying maturities and interest rates, that the central bank will almost always repurchase for cash when asked to do so. In SA the cash to demand deposit ratio is less than three percent and the liquid assets to deposits ratio is now equivalent to about 40%.
SA Bank Deposits withdrawable on demand and Cash and Liquid Asset Reserves. January 2023
Source; SA Reserve Bank and Investec Wealth and Investment
Bankers everywhere must surely be considering attaching a longer notice period to their deposits and to reduce their dependence on transactions accounts – with interest rate incentives to do so. Giving them more time to call for a rescue from the authorities or other banks should their deposits drain away suddenly.
The relationship between the US Fed and its member banks changed in an important way after 2008. To rescue the banking system the Fed injected cash into the financial system on a very large scale through purchases of Government Securities from the banks and their customers in exchange for bank deposits with the Fed. A process of money creation described euphemistically as quantitative easing. (QE) Ever since then US banks have continued to hold large cash reserves despite short phases of quantitative tightening (QT) to reduce the supply of cash as is the case now- or at least before the banks ran into cash withdrawal problems
US Banks Deposits with the Fed
Source; Federal Reserve Bank of St.Louis and Investec Wealth and Investment
The policy determined interest rate is now the rate the Fed offers the banks on deposit rather than the rate charged them for cash borrowed. The SARB decided it too would no longer attempt to keep banks short of cash. SA banks since 2022 can now hold excess cash reserves and earn interest on them. Reserve Bank lending to the banks has fallen away sharply recently.
SA Banks; Actual, Required and Borrowed Cash Reserves.
Source; SA Reserve Bank and Investec Wealth and Investment
But will central banks be able to exercise good control over the supply of money (mostly bank deposits) and bank credit? The supply of bank deposits and supply of bank credit depends in part on the cash reserves supplied to them by the central bank. More cash supplied by the central bank leads to more bank lending and higher levels of deposits (M3) and vice versa. But this money multiplier (Deposits/Cash Reserves) can now rise or fall depending on how much cash the banks choose to hold, rather than on the extra cash supplied them by a central bank. One bank’s extra lending becomes another bank’s extra deposits. If the banks prefer to hold more cash and lend less, the supply of deposits and the money supply will shrink and vice versa. Therefore, the money supply will tend to grow faster during the booms when demand for bank credit is buoyant, and then grow slower when demands for bank credit is weak- as is now the case in the US – making a recession more likely. Ideally central banks can contain inflation and help smooth the business cycle by controlling the supply of money and credit. The current dispensation for banks with excess cash makes this less likely.
In the early days of the economy wide lockdowns of 2020, I remarked that “Today is a time of epidemiologists, central bankers and yes, of schemers too…..” I added that we will discover in due course whose reputations will have survived the economic crisis better intact. I was alluding to Edmund Burke’s unenthusiastic Reflections on the Revolution in France (1790)
The pandemic, as we well know, has had many losers and more than a few beneficiaries. Perhaps economists who have long observed monetary events are among the less disadvantaged by Covid19. Inflation reared up dramatically and new evidence about its causes and consequences was on offer and demanded interpretation. The experience and analysis of the high inflation nineteen seventies when I learnt my monetary economics became relevant again. The problem for the US economy and those with much diminished wealth is that the Fed does not have a monetarist model of inflation [1] As inflation came down after 1980 and money supply growth rates became less variable, and the supply of and demand for money were mostly well matched, such neglect of the role of money in determining inflation was perhaps understandable. The neglect turned out to be anything but benign under the extreme behaviour of the money supply after 2020. History may well come to judge central bankers much less kindly than the commentators appear to be doing today.
The updated evidence on inflation to December 2022
The headline inflation rate in the US peaked at 9.1% in June 2022. It fell rapidly and was 6.5% in December 2022. The monthly increases in the price level, slowed down very significantly after June. The CPI, not seasonally adjusted, was no higher in December 2022 than they were in June. The seasonally adjusted version was only slightly higher over the six months and both versions of the CPI fell in December 2022. On a six-month view there was no inflation in the US. (see figures 1 and 2 below)
Fig. 1; US Headline Inflation 1970-2012
Fig.2; The US CPI Unadjusted and Seasonally Adjusted and Monthly percentage change in US Prices January 2021 to December 2022
Source; Federal Reserve Bank of St.Louis and Investec Wealth and Investment.
The convention of measuring inflation as the year-on-year growth in the CPI has not helped to understand inflation dynamics under current highly unusual and volatile circumstances. Six months can be a very long time for an economy. Waiting a year to see what happens may be too long for a business or a central bank making a judgment and adjusting accordingly. If these monthly increases in the CPI remain at these levels for a further six months, the headline inflation will recede (but gradually) to close to zero by June 2023. There would be no good reason to expect a reversal of these trends, absent any new supply side shocks to the economy. Shocks over which the Fed has no influence, should be ignored because they are temporary and reverse as the recent post -Covid supply side shocks have reversed.
The demand side of the US price equation will not pose an inflationary danger if recent subdued trends in spending and in the money supply and bank credit are maintained. Without any sharp reversal of short-term interest rates this seems highly likely. The Fed has done what it needed to do to contain inflation and that was to contain increases in aggregate spending.
Unfortunately, the Fed greatly underestimated inflation and its persistence on the way up and has almost as egregiously overestimated it on the way down. Monetarists will argue – with new evidence on their side- that these failures to forecast the direction of inflation – that the Fed paid too little attention to the sharp swings in the growth in the money supply post 2020. These money swings were of unprecedented magnitude, which was every reason to attempt to moderate them and to have anticipated their impact on demand and prices.
There would seem no reason to risk nor threaten a recession to maintain low rates of inflation in 2023. Nor to frighten investors and businesses about such possibilities, given the outlook for inflation. The fright has been severe enough to remove trillions of dollars off the value of US equities and government and other bonds. There is good reason for the Fed and the market to forecast satisfactorily low rates of inflation in 2023. On the evidence of inflation and its causes, the Fed guidance should be on the likely and reassuring prospect of a soft landing.
A unique experiment in fiscal and monetary policy – Government spending and money creation – a predictably inflationary combination
The US reactions to the lockdowns in the form of vast injections of income transfers and increases in the money supply provided a unique experiment in economic policy. In Q2 2020 current federal government expenditure grew by 4.1 trillion dollars, from 4.8tr to 8.9tr. The spending was funded mostly with debt a part was funded by running down the treasury balance with the Fed. Federal government debt increased by about 3 trillion dollars in Q2 2020. It grew further from 23 trillion pre-Covid to 32 trillion by Q3 2022.
The income sacrificed by the lock-down was immediately replaced and even exceeded by the generosity of government grants. As was reflected in an equally rapid increase in the deposits held by households at banks. Households initially saved much of the extra money transferred to them from the Treasury as Covid relief. The opportunity to spend more on services, face-to-face was restricted, as was the supply of goods by the anti-Covid repressions.
The broad money supply (M2) that includes most bank deposits and money market funds, increased from 15.5 trillion dollars in early 2020 to a peak of 21.7 trillion by February 2022, from which levels it declined in 2022. The growth in the money supply was as much as 27% p.a. in February 2021. This extra spending by the Federal Government, rapidly executed, was unprecedented even when compared to war times. The extraordinary growth in the money supply engineered by the Fed was also on a scale not previously known, even when compared to the actions taken during the Global Financial Crisis (GFC) of 2008-09 to share up the financial system with money.
Fig.3 US Federal Government Expenditures and Federal Debt. Quarterly Data
Source; Federal Reserve Bank of St.Louis and Investec Wealth and Investment.
Fig. 4: The US Money Supply (M2) and Annual growth rates (Monthly data)
Source; Federal Reserve Bank of St.Louis and Investec Wealth and Investment.
Quantitative easing (QE) that is the large-scale purchases by central banks of US government bonds was reversed and became quantitative tightening in late 2022, as may be seen in figure 5 below. To be noted also is the decline in the cash reserves of the US banking system- held with the Federal Reserve Banks in 2022. Nevertheless, the US banks continue to hold vast excess reserves, over the now redundant required reserves. They receive interest on these deposits with the Fed and judged by the absence of money supply and credit growth the banks have not been switching from cash to overdrafts and their like, as they might have done, had demands for credit been more buoyant.
Fig. 5; The Federal Reserve Banks. Federal Debt and Reserves of the Banking System
Source; Federal Reserve Bank of St.Louis and Investec Wealth and Investment.
Inflation surprises and their deflationary after-shocks.
Yet the rapid and persistent increase in spending and in prices that followed the lockdowns in 2021 came as a surprise to many, including the Fed. But less so to those few economists who regard changes in the money supply as a reliable leading indicator of economic activity and of the price level. Attention to the forces that influence the supply of and the demand for money now leads one to conclude that the inflationary danger to the US economy, the prospect of a process of continuously rising prices, sustained over an extended period-of-time, has passed. The problem for investors and the market in stocks and bonds, is that the Fed has not yet shared this view. It should be noticed in figure 6 that the Money Supply adjusted for consumer prices has declined since January 2022 having peaked in September 2021. The year-on-year growth in Real M2 was a negative ( -6%) in October 2022
Fig.6; Real Money Supply (M2/CPI) 2020=100
Source; Federal Reserve Bank of St.Louis and Investec Wealth and Investment.
The increase in the inflation rate revealed in 2021, surprising the Fed and most market participants and their economic forecasters and advisors, caused the Fed and other central banks to react vigorously with much higher short term interest rates, intended to fight the new inflation. And to restore the reputation of the Fed as an effective inflation fighter.
These higher borrowing costs, combined with higher prices, perhaps a more powerful influence on intentions to spend, has absorbed the spending power of households. Higher prices have also increased the demand for money and helped reduce the post-Covid excess supplies of money (deposits at banks) held by households. Higher price levels, higher incomes and greater wealth all serve to increase the demand to hold money in portfolios, or as transactions balances. Higher prices have their supply and demand causes. They also have their effects – they restrain the willingness and ability to continue to spend more- all other influences, including especially ongoing money supply growth, remaining unchanged. Which to repeat has largely been the case even if not intentioned by the Fed.
The flat path of private consumption expenditure in 2022
The absence of further growth in the money supply and bank credit in 2022 has helped to restrain the growth in real private consumption expenditure (PCE) as we show below. PCE accounts for about 70 per cent of all US spending and the capital expenditure, spending on plant and equipment, undertaken by US facing businesses is also dependent on the expected pace of real PCE.
Fig. 7; US Real Private Consumption Expenditure and Growth. Monthly Data to December 2022.
Source; Federal Reserve Bank of St.Louis and Investec Wealth and Investment.
Fig.8; Growth in PCE. Annual and Monthly
Source; Federal Reserve Bank of St.Louis and Investec Wealth and Investment.
Other measures of economic activity, for example the monthly surveys of activity in the manufacturing sector and now also for the service sector, indicate that the US economy is shrinking. Both the ISM and S&P Global services PMI readings are now below 50 for the US indicting a contraction in the supply of services that and have followed the contraction in US manufacturing PMI, a figure also below 50. The quarterly estimates of real GDP that draw upon higher frequency data are very likely to confirm that income and output growth is at best growing very slowly or is also in decline. If the future is to be like the past, these leading indicators of economic activity, contracting, portend a decline in real GDP, that is a recession.
The decline in the money supply and in the supply of and demand for bank credit (the asset side of bank balance sheets) was not an explicit intention of Fed policy – it has been an unintended consequence of higher prices and interest rates that have depressed the growth in spending by households and firms. The Fed does not target the growth in the money supply. Nor to my observation has the Fed ever referred to this slow growth in money as a cause or indicator of inflation to come.
Only persistent and continuous increases in aggregate demand- accompanied necessarily by increases in the supply of money – can perpetuate high rates of inflation
The Fed therefore may be said to have done its job containing permanently higher inflation. Inflation, defined as a continuous increase in prices, caused by an increase in the supply of money, in excess of the demand to willingly hold that money. That is a decision to hold money willingly in portfolios rather than convert the additional money supplied to the economy into additional demands for goods, services and assets, financial and real. An exchange of excess money for goods, services and assets of all kinds that are substitutes for cash in portfolios, causes their prices to rise. This transmission of extra money to extra aggregate demand surely explains a significant part of the higher prices realised for goods services and assets, financial and real of all kinds in the recovery from the lockdowns of early 2020. That is excess supplies of money led and inflation followed, as traditional monetary theory, would have predicted.
By mid-2022 enough of the extra excess money supplied earlier in response to the stimulus of 2020-21 had been added to US portfolios. With the aid of higher prices, the demand to hold money has caught up with the extra supplies of money The absence of excess real demands for goods and services, as revealed by the stagnation of real private consumption expenditures, indicates that the adjustment to higher inflation in the form of extra demands to hold money, has been made in the US.
It is only a further increase in the money supply that can keep aggregate demand growing fast enough to counter higher prices and to result in continuously rising prices. This danger has passed. Aggregate demand for goods and services in the US is now weak enough and will remain weak enough to call for a reversal of Fed actions taken to date- without causing permanently higher inflation. This inflation too will pass- absent accommodation of higher prices with faster money supply growth – which it is not receiving.
The Fed panicked and should have guided to a soft landing of less inflation to come without having to induce a recession.
The Fed has badly overreacted to its failure to contain inflation in the aftermath of Covid, as have other central bankers, including the Bank of England and the ECB. They have focused on inflation that has passed rather than the path of inflation to come. The Fed has failed to provide comfort that inflation is on the way down, as it is doing – given the absence of any strength in aggregate spending – that would be necessary to sustain continuous increases in prices.
Central bankers should not have been surprised as much as they were by post Covid stimulus and its impact on spending and on prices. Strains to complicated supply side chains and upward pressure on prices, given lockdowns were surely inevitable. Thereafter, the additional supply side shocks associated with the lockdowns and later with the Russian war on Ukraine became a further complicating factor driving prices still higher in 2022.
Yet the supply side shocks, most important, the impact of higher energy, also food and commodity prices, had clearly come to reverse by mid-2022. Accordingly headline inflation, the change in the CPI over twelve months, was bound to reverse sharply, as it has done, after the much higher prices of mid 2021 come to fall out of the Price Indexes.
Responding to supply side shocks to the price level.
Dealing appropriately with supply side shocks on the price level is a large part of the art of central banking. Central banks can only hope to influence the demand side of the price equation that equilibrates,with market clearing prices and quantities of all the many individual prices goods and services that make up the Consumer Price Index. The task set central banks is to help keep aggregate demand within the strict limits of the capacity of an economy to supply goods and services. This helps realise general price stability and full employment or potential output of the economy. It takes accurate forecasts of aggregate demand and supply to help fine-tune the economy with appropriately higher or lower interest rates, determined by the central bank. These interest rates act on the economy with a lag making forecasting the path of the economy essential to the purpose. It was a task admittedly made much more complicated in 2020 by the lockdowns of normal economic activity that were then overtaken by a major conflict in Europe.
Supply side shocks that will temporarily move the price level higher or indeed lower are therefore best ignored by policy setters and should be allowed to work their way gradually through the economy. Higher prices, as indicated earlier, are part of the normal adjustment process to less supplied or more demanded. Fewer than expected goods and services supplied to an economy could be the result of droughts or floods or famine or war. Or more usually, for less developed economies, a supply side price shock will be the result of a collapse in the foreign exchange value of a currency.
The case for ignoring supply- side shocks should be part of the forward-looking guidance central bankers offer the marketplace. It should therefore be carefully explained why the demand side of the economy may best be left as it was, not subject to higher or lower interest rates, given the absence of any demand side pressures on prices, should this be the case, as it has been the case in the US in 2022. And the central bankers should advise accordingly.
Steady as it goes is called for. A recognition of the limited powers of central bankers to always control prices within a narrow range- given the possibility of a severe supply side shocks -should be well understood and well communicated to the economy. The uncertain dynamics of inflation in 2021-2022 needed more sympathetic understanding and treatment than they appeared to receive from either the Fed or indeed most market commentators.
Post-Covid, central bankers including the Fed have continued to raise interest rates rapidly in response to higher prices, regardless of their supply side or demand side or mixture of both. They have not accommodated higher prices but allowed them to restrain demand and contain inflation – perhaps more than they needed to do. But they have not presented a confident front that inflation would and could be controlled without unnecessary damage to the economy.
It was surely possible to bring inflation back in line without a very costly recession as may still be the case. But with the right messaging it might also have been possible to do so without disrupting financial and asset markets that understandably became so fearful that the Fed would induce a recession.
Fanciful fears of self-perpetuating inflation explain the reactions of the Fed
Central bankers, rather than ignore the supply side shocks that partially explained the dramatic increase in the price level, fretted openly that economic actors would simply extrapolate their recent inflation experiences and can add continuously to prices. That higher inflation could lead to more inflation and so inflation becomes entrenched in the economy with highly damaging effects on economic growth over the long run. Much market commentary as well as Fed commentary has been about inflation becoming entrenched because of the danger of a higher wage- higher price spiral- that needed to be vigorously countered.
But such fears were highly exaggerated and have little evidence to support the notion of inflation simply feeding on itself. Absent a decision to react to a slow-down in an economy subject to the negative influence of higher prices, with still more of the money that initially caused prices to rise in the first place. It takes still more money to overcome the negative effect of higher prices themselves on demand and on the pace of economic growth. Prices will continue to rise only if the supply of money is allowed to continue to increase to offset the impact on spending of higher prices. This has not been the case in the US. The supply of money stopped increasing in 2022 and spending fell away to take the pressure off prices.
The determinants of inflation expected
It is surely not rational to set prices or wages regardless of what the market can be expected to bear. Economic actors with pricing power, including the power to demand higher wages, can easily be disappointed in their plans to charge more should demand for their goods and services at higher prices proves lacking. Slack being the difference between actual and potential GDP. [2] Economic slack can overcome more inflation expected as previously conventional central bank theories asserted. The highly reduced inflation equation in the Fed and other central bank models (Inflation = inflation expected – slack) indicates as such. The more slack, the less inflation, for any given expected inflation, is the theory.
Price setters would always like to raise prices or wages, to charge more, but they are restrained by the market for their offerings. They are forced to adjust their prices to what the market will bear, rather than what they might have expected their customers to have borne. The decline in inflation in the US recently helps make this important point. The US market in general is no longer able or willing to bear still higher prices for want of slack or potential slack.
The momentum of past inflation may well influence expected inflation. But it would not be rational to do so in some simple-minded way, given the possibility of slack in the economy. Any rational model of expected inflation would moderate inflation expected by slack expected. And the slack expected would depend upon the expected reactions of the central bank and might allow a role for the growth in money supply and bank credit.
We should expect more of a central bank than having to induce a recession to control inflation. The realistic promise should be one of a soft-landing and a central bank should acquire a reputation to deliver that. Inflation is to be avoided and can be avoided – but it should not have to take a highly destructive recession to do so.
Adding further increases in interest rates in the US and elsewhere to depress demand further in 2023 is a step too far- given the clear absence of buoyant demands from households. The opportunity exists for a soft-landing for the US economy, with inflation heading permanently lower to the 2% p.a. target of the Fed while avoiding a recession. But it will take an early pivot by the Fed to lower not higher interest rates by late 2023.
Employment, wages and prices- what is the relationship?
One other regular source of market moving news has been about the buoyant state of the labour market. The prospect of a recession, given very full employment, is a most unusual combination of circumstances. An un-employment rate below 4% and the growth in the numbers employed above 200,000 per month, as has been the case, are not normally consistent with a recession any time soon. (see figure 9 below)
As the financial markets were well-aware, a fully engaged labour force might well encourage the Fed to continue to worry more about the upside risks to inflation than the downside risks to growth. Especially if it held some conventional assumption about the higher wages that come with full employment will lead to further upward pressure on price- a wage-price spiral.
However interpreting the true state of the labour market- in particular the willingness of potential workers to supply labour – post Covid – is proving especially difficult. A taste for leisure rather than work has been facilitated by Covid relief and led to fewer potential employees seeking work. Given the lower participation rates in the labour force, employers particularly in the service sector, became unusually willing to pay-up to secure workers expected to remain in short supply.
The numbers employed outside agriculture appear to have caught up with pre-Covid levels. But are still below where pre-Covid trends in employment might have taken the labour market. The growth in the numbers employed month to month, which averaged a very steady 1.64% p.a. between 2011 and 2019. The post lockdown recovery saw the growth in US employment to peak at 10% in early 2021. The growth in the numbers employed now appears to be slowing down, consistently with a normal slow-down in spending.
Fig. 9; US employment and annual growth in employment. Monthly data
Source; Federal Reserve Bank of St.Louis and Investec Wealth and Investment.
The Fed view on the relationship between wages and prices – a recent pivot – and back
Yet the Fed in August 2020 revealed a willingness to experiment with the relationship between inflation and the state of the US economy, and more particularly, to experiment with the relationship between the state of the US labour market and wages and prices. Chairman Jerome Powell opined [3] that there was no predictable relationship between them and so the Fed would tolerate, even encourage, lower rates of unemployment and higher levels of employment, without exposing the economy to more inflation. In short, Powell pronounced that the Phillips curve that posits a costly trade-off of extra employment for lower inflation does not exist or, in his words, the curve has flattened.
Economic theory has long explained the demise of the Phillips curve observed first in the high inflation slow growth, stagflation 1970s. Economic agents, be they firms or trade unions, or indeed highly paid executives, learn to build inflation into their price and wage settings. A view on inflation – inflationary expectations – are rationally baked into their budgets and plans, and current price and wage decisions. Thus it is not realised inflation that will have a real impact on hiring and production decisions. Since expected inflation will be reflected in the prices and wages agreed to in advance, it will be inflation surprises, higher or lower, that will invalidate, to a degree, the best-laid plans of businesses and their employees and force an adjustment to price and wage plans.
The financial markets and the outlook for inflation – fighting the Fed and losing
The marketplace, correctly in my opinion, has maintained a different more benign view of the outlook for inflation than has the Fed and its officers. Expectations of inflation over the long run are revealed by the differences between the yield on vanilla and inflation linked bonds. They have remained well contained and close to the 2% p.a. inflation target of the Fed.
By year end 2022 the difference between the nominal yield offered by a 10 year US Treasury and the real, fully inflation protected, yield on a 10 year US bond, a TIPS, (Treasury Inflation Protected Security) was of the order of 2.25% p.a. Investors exposed to the risk that inflation would erode the purchasing power of their fixed interest income, of 3.7% p.a. for ten years were offered an extra 2.25% p.a. to accept this inflation risk. Investors in either the vanilla or inflation protected bonds would breakeven if inflation turned out to average 2.25% p.a over the next ten years as expected in the bond market. This inflation compensation -the breakeven yield spread provides a highly objective view of inflation from investors with much to gain or lose should inflation turn out higher or lower than expected.
The surprising feature of the behaviour of the long bond yields through a period of much higher inflation is that real as well as nominal bond yields have risen sharply- helping to close the gap between them. Higher nominal yields to accompany more inflation and to provide compensation for more inflation expected is not a surprise. The surprise is the increase in real yields that have accompanied more inflation and amidst widespread expectations of slower growth – even recession to come. Forces that might ordinarily be expected to reduce the case for businesses to raise more capital and lead to lower rather than higher real interest rates.
My explanation for this anomaly was that volatility as measured in the bond markets had also risen with uncertainty about the actions the Fed might take to control inflation. Therefore, all yields, nominal and real, rose to compensate investors for the extra risks they believed they were taking. More perceived risk means lower bond and equity values in 2022 that are necessary to provide higher expected returns in both the equity and bond markets in 2022. Subject to these increased risks to interest rates the bond markets in 2022 proved anything but safe havens for investors.
Fig.10; US Bond Market; 10 year Conventional and Inflation Protected Treasury Bonds. Yields and inflation compensation (break- evens)
Source; Bloomberg and Investec Wealth and Investment.
Fig. 11; US Bond market volatility index (Move) and the Bond Index. Daily Data
Source; Bloomberg and Investec Wealth and Investment.
Fig. 12. The S&P 500 index and the Volatility Index (Vix) Log Values Daily Data 2020- 2022
Source; Bloomberg and Investec Wealth and Investment.
Conclusion – The Fed is now following rather than leading the data
Expected inflation or expected GDP influences current valuations and business operations. The future is all in the price as may be said, but the future may turn out very differently. It is only surprises that move financial markets and the real economy as in the expectations adjusted Philips curve discussed earlier. These ideas were incorporated into economic theory in the nineteen seventies and eighties and the developers of the theory were rewarded with a number of Nobel Prizes for economics. [4]The task of central banks following the expectations sensitive and now conventional central bank wisdom, is to help anchor inflationary expectations to avoid such surprises. The Fed hopes to do so by providing forward guidance on central bank policy intentions with which the market hopefully concurs and behaves accordingly providing a higher degree of market stability. Thus, by reducing uncertainty about the future path of inflation and the real economy helpful guidance helps make business plans more accurate and less subject to alterations in output and employment plans. Closing the potential gap between expectations and economic and financial market outcomes is thought to reduce risk and required returns and therefore helps promote economic growth.
However, the Fed in its recent latest post- rapid inflation incantation, has been very disinclined to offer any comfort to investors about its intentions. Fears of unknown, and what are presented as highly unpredictable inflation, rather than slow growth, remain uppermost in its thinking.
The notion that higher inflation could be self-fulfilling and harmfully so for the economy over the long run appears to dominate their approach. The Fed appears willing to accept a recession if necessary to the purpose of reducing inflation expected and so inflation. A view that the market is understandably fearful of. And to some extent the market has not accepted the Fed view as has been revealed in forward interest rates, lower forward rates, than appear in Fed Open Market Committee guidance (the so-called dot plots of OMC members)
My own view is that the market is very likely to be closer to the truth on inflation and therefore on the path of interest rates than the Fed. That the Fed, more than the market, is likely to be surprised by the inflation and interest rate outcomes.
Central bankers are unlikely to emerge from Covid with their reputations for sound judgment about inflation fully intact. No more than the epidemiologists whose predictions of disaster proved highly fallible. The case for economic lockdowns given their cost and collateral damage has become increasingly suspect with the knowledge since gained.
Perhaps the next time society is threatened by an epidemic the cost-benefit analysis of economists may carry more weight with the politicians and their officials who appear so independently powerful to exercise executive authority. And maybe next time, without the lockdowns, the temptation to add as much stimulus as was added post-Covid – with all its consequences – inflation followed perhaps by recession – will be resisted to a greater extent.
The Jury will stay out on these issues through much of 2023. My contention that inflation is heading lower because the money supply is decreasing is well supported by the latest trends as of December 2022. The monthly increases in the US CPI are all pointing to much lower headline inflation. A trend that will become ever more obvious to all observers including those at the Fed. The case for higher short term interest rates will then surely have been lost. The case for assisting the US economy with lower interest and a pick-up in money supply growth rates will then become irresistible.
[1] I offered a monetarist interpretation of these developments in early 2022
Brian Kantor, Recent Monetary History; A Monetarist Perspective, Journal of Applied Corporate Finance • Volume 34 Number 2 Spring 2022
[2] I wrote about the beliefs of central bankers in 2016
Brian Kantor, The Beliefs of Central Bankers About Inflation and the Business Cycle—and Some Reasons to Question the Faith. Journal of Applied Corporate Finance • Volume 28 Number 1 Winter 2016.
[3] All references to Chairman Powell and his thoughts are taken from his speech to the symposium on economic policy organized by the Federal Reserve Bank of Kansas City 8/27/2020;
New Economic Challenges and the Fed’s Monetary Policy Review
Chair Jerome H. Powell. At “Navigating the Decade Ahead: Implications for Monetary Policy,” an economic policy symposium sponsored by the Federal Reserve Bank of Kansas City, Jackson Hole, Wyoming (via webcast)
[4] My own attempt to follow the chain and train of such new thoughts can be found in Rational Expectations and Economic Thought, Brian Kantor, Journal of Economic Literature, Vol. XVII, December 1979,pp 1422-1441
The market reaction to the release of US CPI data shows the extent to which the inflation dynamics have changed. Central banks should take note.
New York on 10 November was one of those days that will be fondly remembered by those with skin in the game, in the form of investments in the equity and fixed-income markets. This was the day that the key S&P 500 index added 5.54% to its value by the close of trading and the more IT-exposed Nasdaq added even more, 7.35%. These moves were the largest on any one day since the world came to realistic terms with the damage caused to their economies by the lockdowns of 2020.
Government bonds, which typically make up 40% of any conservatively managed portfolio, also became significantly more valuable as longer-term interest rates receded sharply. The yield on the benchmark 10-year Treasury fell from 4.14% to 3.82, on the same day, the largest such daily move since 2009 (the dollar value of bonds moves higher as yields decline). On the following day, as an illustration, the JSE All Share Index had gained 3.2% by 11h15, while the rand was up 2. 7% against the US dollar by mid-morning.
The source of all the good news was unusually obvious. US inflation for October reported that day was surprisingly low. Simply put, the (new) expectation of less inflation implied less aggressive Federal Reserve policies and lower-than-previously-expected short-term interest rates. Furthermore, the higher probability of the US avoiding recession added present value to stocks and bonds. The trend to lower inflation was further confirmed later, with similarly favourable market reactions: producer prices also surprised on the downside with prices rising by a month-on-month 0.2% in October, half the rate expected by the market.
The Fed, having been so completely surprised by the surge in inflation in 2021, seems determined to march the US economy into recession to eliminate an inflation that they seemed unable to forecast with any degree of confidence. Monetary policy has become data-driven, guided by the view through the rear window. This has been accompanied by the fear that persistently high inflation could become a self-fulfilling tragedy for the US economy. The approach of the Fed seemed to be that, if a recession was the price to pay for avoiding permanently higher inflation, then recession it would have to be, much to the discomfort of the US share and bond markets. For the year to 15 November, the S&P 500 is down by 17% and the benchmark bond index is about 12% lower.
US stocks and bonds in 2022. (1 January 2022 = 100)
Source: Bloomberg and Investec Wealth & Investment, 16/11/2022
But should the Fed and the market have been so surprised? Surely not – if it had been closely following recent trends in inflation and spending by households and firms, then it would have appreciated why inflation had come to a screeching halt since its peak of 9.1% in June 2022. A year can be a very long time for an economy. The consumer price index (CPI), which was 9% higher in June 2022 than a year before, has flat-lined since June 2022. Consumer prices had stopped increasing in June and the increase over a rolling three-month period has slowed to a 2.3% annualised rate. If this trend in the CPI continues, then the inflation rate will still be a high 6.9% at year-end, but will then fall away sharply to less than 1% by June next year. US headline inflation is apparently on a path to zero.
Inflation in the US
Source: Federal Reserve Bank of St.Louis and Investec Wealth & Investment, 16/11/2022
The Fed should be acting accordingly, by recognising that aggregate spending in the US by households and firms has already slowed down markedly and does not threaten higher prices to come. The weakness of aggregate demand is restraining price increases. Higher prices to date have largely absorbed the spending power that was so boosted by vastly extra money supply and Treasury handouts provided in response to the lockdowns. Higher prices have their demand and supply side causes, but higher prices have their negative effects on spending power. Higher prices absorb disposable incomes and spending power. Higher wages – even given full employment in the US – have not fully kept up with higher prices, further restraining spending.
Inflation cannot perpetuate itself unless it’s accompanied by continuous increases in the demand for goods, which has not been the case in the US or Europe. The notion, endorsed by the Fed and many other central bankers (including the SA Reserve Bank), that higher prices and wages can simply perpetuate themselves, is a false notion. Inflation expectations soon run aground on the rock of deficient demand and unintended excess inventories. This theory of self-perpetuating inflation will not pass the test of evidence. The Fed and the market should be following the weak trends in spending closely. Ever higher interest rates could in these circumstances turn minimal growth in spending into spending declines – truly the stuff of recessions.
The Fed and the market would also be well advised to pay close attention to the trends in money supply growth. Inflation may be defined as a continuous increase in prices caused by an increase in the supply of money over the willingness to hold that extra money. All inflation is associated with excess supplies of money and the recent inflation in the US is no exception to this well-established rule.
A money supply explanation of the weakness of aggregate spending in the US also helps to explain why the demand for goods and services is growing so slowly. The important monetary facts are that money supply, broadly defined as M2 in the US, is now no larger than it was at the beginning of 2022. M2 amounted to US$21.62 trillion in January. By September, M2 had declined to US$21.46 trillion. The year-on-year growth in M2 that had peaked at an extraordinary 27% in early 2021 has slowed to a barely positive 3%, with the three-month growth rates now negative. Growth in commercial bank credit has also slowed down markedly. Year-on-year growth in bank credit was 7.6% in October 2022 while growth in bank credit provided has slowed to an annualised 1.6% over the past there months. The monetary, credit and price trends are pointing strongly to deflation rather than inflation by the end of next year. The market hopes that the Fed will recognise this in good enough time and avoid recession.
Money supply in the US (M2)
Source: Federal Reserve Bank of St.Louis and Investec Wealth & Investment, 16/11/2022
The financial markets have been roiled by the prospect of recession in the US. The market makers fear that the Fed, having allowed prices to explode in the US will now reverse course abruptly enough to bust the economy. They are right to worry.
Managing the level of demand in an economy well enough to exercise the full potential of an economy – and to avoid continuous increases in the price level, inflation, or its opposite deflation, is a central bank ideal. The more stable the environment, the more accurate become the plans of business, the more predictable their earnings and their values- and vice -versa.
The reality is often very different. The proclivity of central banks to exaggerate the swings of the business cycle is a constant danger to businesses and investors. In some senses the fear of recession may be more disturbing than recession itself. Were a recession to seriously threaten the US economy any time soon, policy determined interest rates in the US would not rise as much and soon go into sharp reverse and equity and bond valuations would rerate on improving prospects. Sell the rumour (of recession) – buy the facts (a recession itself) might well be an appropriate strategy for turbulent times.
The intention of central bank policy interventions should be to smooth the business cycle, avoiding booms and busts – while containing inflation. Central banks can hope to do this by anticipating and then influencing aggregate spending- over which they claim influence. And to ignore temporary supply side shocks (exchange rate or food or energy price shocks for example) that may also cause prices to rise and fall.
Policy settings should not add higher interest rates to the downward, recessionary pressures on demand when prices have risen temporarily. Or vice versa when the supply side of the economy (lower prices) are stimulating demand to lower the cost of credit to push spending still higher. Navigating successfully between supply side shocks- with a temporary impact on the price level – to be ignored – and actions that could cause continuous rises in prices, permanently excess spending- to be actively countered is the true art of central banking. Highly relevant also for the SA Reserve Bank that wrongly believes temporary price increases lead to permanently higher inflation.
The impact of an extraordinary surge in demand to counter Covid on prices, led by an even more extraordinary increase in the money supply, should not have been anything like the surprise it was inside and outside the FED. The growth in the money supply (M2) peaked at an mind blowing 27% in early 2020. Any sense of monetary history would have regarded much more inflation as inevitable.
The Fed and market watchers had been lulled into ignoring the growth in the money supply and bank lending by years of modest and declining growth in the money supply since 2010 – with declining rates of inflation. Though this record is not without serious blemishes. The run up in money and bank credit growth prior to the GFC should surely have been avoided- as should the abrupt decline in money growth that exaggerated the post GFC recession.
US Money Supply (M2) growth and inflation 2000-2022
Source; Federal Reserve Bank of St.Louis and Investec Wealth and Investment
The Fed should be paying the closest possible attention to the current trends in money supply and bank credit growth and set its interest rates accordingly. It should be aiming to stabilize money supply growth at about 6% a year- consistent with average inflation of 2% a year as was the case to 2019. And to reach that goal – from the current 10 to 6 per cent p.a. growth – as gradually as possible. It should communicate clearly that both money supply and prices are heading in that direction. And that higher prices have already restrained the demand for goods and services.
The marketplace should be paying the same close attention to the growth in the money supply and in bank lending as a leading indicator of the state of the economy. Readings sharply below 6% p.a. growth in the money supply will give ample warning of trouble to come.
Monthly % Growth in US Money Supply (M2) and Consumer Prices
It is crunch time for most central banks – but not the SARB. Inflation rates escaped them and recapturing inflation will not be a comfortable or comforting exercise. Rising prices, rising wages and the prices of other inputs, can be very clearly blamed on the usual suspect- more money created than has been willingly held by households, business and banks. Excess money holdings (deposits at banks) have been exchanged for goods, services and other assets enough to raise their scarcity value. And supply has been unusually slow to respond to the unexpected strength of demand.
It will take higher interest rates and a sharp deceleration of the rate of growth of the money supply to reverse inflation trends. It will demand less be spent and borrowed by governments and more tax collected. Paying interest will account for an ever-larger share of government budgets to constrain the much more agreeable benefits that might otherwise be provided by governments.
Their further problem is that higher prices are part of the adjustment economies make to an excess of demand over supply. Higher prices have causes- they also have effects- they help absorb and restrain demands while they encourage additional output. Higher prices reduce the ability of households to spend and less spent may well register as temporarily slower growth – slow enough to make central bankers more hesitant to act. But if they fail to act they may encourage more inflation expected that will show up in higher long term borrowing costs.
A further complication is that there is a great deal of money sitting on the sidelines waiting to enter the markets. The ratio of money relative to income (GDP) in the US has exploded since the Global Financial Crisis and in response to Covid. There is now 80% more money – mostly in the form of bank deposits – per unit of income – than there was in 2008. A ratio of close to one to one between income and money was very much the understandable case before the GFC and before the brave new world of Quantitative Easing (central bank money creation on a vast scale) was discovered. A new money/Income equilibrium will have to be established in the US – a mix of higher prices and less money added will have to bring this about.
The commercial banks play a large role in determining the supply of deposits, through their lending. And they have vast reserves of cash to convert to loans if they choose to do so in response to demands for credit to expand the money supply further. The last time the Fed reversed QE in 2015, to shrink its own balance sheet, the balance sheets of the commercial banks continued to rise as they reduced their cash holdings in exchange for other assets. They may do so again. It might take very much higher short term interest rates to discourage them.
Assets of the US Commercial banks and the Federal Reserve System 2008-2021. Monthly Data Billions
Source; Federal Reserve Bank of St.Louis (Fred) and Investec Wealth and Investment
We have a clear case of monetary excess in the US and too much monetary constraint in SA, an explosion of the Money/Income ratio in the US and a contraction in SA. Enough to infer that the relationship between money and incomes has undergone a systemic change – in an inflationary direction for the US and contractionary one for SA.
The US and SA – the Money to Income Ratios. (2007.4=1) (Quarterly Data)
Source; Federal Reserve Bank of St.Louis (Fred) South African Reserve Bank and Investec Wealth and Investment
The sense of systemic change in SA is reinforced by a comparison of growth rates in money and income before and after the GFC. Growth rates were much higher and far more variable before 2008. They have declined significantly since. The Fed will have to tighten up to control inflation and the SARB should lighten up to facilitate faster growth for which enough money- not too much and not too little- is essential to the purpose.
South Africa; Growth in Money Supply (M3) GDP and Prices ( Quarterly Data)
Source; Federal Reserve Bank of St.Louis (Fred) South African Reserve Bank and Investec Wealth and Investment
Introduction – monetary developments before and after the GFC and Covid
Reports on the death of the Quantity Theory of Money now (February 2022) appear highly exaggerated. The extraordinary burst of additional money issued by the Fed intended to ameliorate the damage to incomes and economic activity caused by the Covid inspired lockdowns of March 2020 have been followed by a surge in inflation. The increase in the prices facing consumers in the US was running at over 7% p.a. by the end of 2021 The inflation of 2021 appears to have surprised all observers other than the near extinct tribe of monetarists.
While inflation rises across the globe, South Africa’s monetary and fiscal authorities should take note of the weak state of demand locally.
Prices are busting out all over the world. Prices charged by all US producers are 20% higher than they were a year before. Consumer prices were up by a ‘mere’ 5% in August, and that was before the recent tripling of natural gas prices.
US headline inflation rates (annual percentage growth in consumer and producer prices)
Source: Federal Reserve Bank of St Louis, Investec Wealth & Investment, 6 October 2021
US headline inflation rates (monthly percentage growth in consumer and producer prices)
Source: Federal Reserve Bank of St Louis, Investec Wealth & Investment, 6 October 2021
The cause of higher prices is clear enough. They are a response to buoyant demands stimulated by Covid-inspired extra government spending and central bank funding of much larger fiscal deficits that have dramatically increased the supply of money (bank deposits) held by households and firms. In the US, these savings have also reduced the incentive for people to get a job – of which there is an unusual abundance, as firms struggle to match surprising strength in demand with extra output and willing workers.
This mixture of strong demand with constrained supply has caused prices to rise. The effect of higher prices is also predictable. Higher prices reduce demand while they serve to encourage extra output. They also act as a drain on disposable incomes and spending power. Higher prices, particularly when they respond to supply side shocks, can therefore lead to slower growth as these higher charges work their way through the economy.
What is critical therefore for the control of longer-term inflation trends is how the monetary and fiscal authorities react to this slower growth. Should they attempt to mitigate the impact of higher prices on growth by stimulating demand for goods, services and labour, then the temporary surge in inflation can become longer lasting. Firms and trade unions will then budget for expected and uncertain inflation.
Central bankers believe that inflation depends on inflation expected, modified by the state of the economy. Independent central banks accept responsibility for the state of demand, but they hope that inflation expectations are anchored at low rates, to make their task of containing inflation an easier one. The markets, to date, have largely believed that the observed rise in inflation is a temporary one. But the markets will be watching the reactions of the fiscal and monetary authorities closely for signs of the policy errors that can turn a temporary supply side shock into enduringly higher inflation.
South Africa – not a typical case
It is striking how the South African economic circumstances have not been typical. We too will have to deal with an energy price shock that will depress demand. But demand already remains depressed. Particularly depressed since 2016 have been the demands of firms, including the public corporations, for plant, equipment, workers and credit.
Real gross fixed capital formation by type of organisation
Source: Stats SA, SA Reserve Bank, 28 September 2021
Households have helped to sustain spending, but only a little. Total spending by households grew by 1% in the first quarter of this year, but only by half as much in the second quarter. Those in jobs have earned more, yet many more (over a million) have lost their jobs since the lock downs. Formal employment outside agriculture is now below 2009 levels.
Formal non-agricultural employment
Source: Stats SA, SA Reserve Bank, 28 September 2021
The money supply has flat lined as nominal GDP has grown strongly. The closely watched government debt-to-GDP ratio has been further reduced by extraordinary growth in government revenues. Tax receipts have accelerated in response to the global inflation of metal prices that make up the bulk of South Africa’s exports; so much so that the total borrowing requirement of the government in all its forms has declined from 13.5% of GDP in the first quarter of last year to as little as 1.8% of GDP in the second quarter of this year. Fiscal austerity has been practised in Covid-ravaged South Africa. And monetary policy, judged by its effects on money and credit supply, has not been accommodating enough.
Money supply and gross domestic product
Source: Stats SA, SA Reserve Bank, 28 September 2021
The output gap – the potential supply exceeding realised spending – is likely to remain persistently wide. Inflation expectations therefore remain unaltered. The case for higher interest rates to further depress demand seems weak in the circumstances. Yet the gap between short- and long-term interest rates has widened further in recent days. This implies an expected doubling of policy determined rates over the next three years.
The slope of the SA yield curve (SA 10-year yields minus money market rates)
Source: Bloomberg, Investec Wealth & Investment, 6 October 2021
The bond market indicates that any improvement in South Africa’s fiscal circumstances is sadly expected to be temporary rather than permanent. It can prove otherwise with fiscal discipline and sympathetic monetary policy.
The steps taken in the US to counter the destruction of incomes and output caused by the lockdowns of economic activity can be regarded as a resounding success. Real US output is now ahead of pre-covid levels. By the end of 2021, GDP could well surpass the GDP that might have been expected absent the lock downs. It took a great deal of income relief in the form of cheques in the post from Uncle Sam, supplemented by generous unemployment benefits and relief for businesses.
The extra income means an increase in deposits, in other words money placed with the US banks, to be spent later or exchanged for other financial assets.
Deposits held by banks with the Federal Reserve System have increased by 85%, and deposits at the commercial banks have grown by 26% since March 2020. The source of the extra cash, the deposits at the commercial banks and the Fed, has been additional purchases of government bonds and mortgage-backed securities in the debt markets from the banks and their clients, which are being maintained at the rate of US$120bn a month.
The assets and the liabilities of the Fed have increased by 36% over that period. This is money creation on an awe-inspiring scale and it has worked, as intended, to promote demand for goods and services. Providers of goods and services are struggling to keep up with demand, while also struggling to add to payrolls, leading to upward pressure on prices. The US CPI was up by 5% in May – a rate of inflation not seen since 2008 and before then only in the 1990s.
Inflation in the US – annual percentage changes in CPI
Source: Federal Reserve Bank of St Louis and Investec Wealth & Investment, 15/06/2021
However, the outlook for inflation in the US is less obvious than usual. The Fed has been surprised by the pick-up in the inflation rate, as was indicated by the Federal Open Market Committee and Fed chief Jerome Powell’s press conference on 16 June. Powell remains confident that the increase in inflation is transitory and the Fed does not intend raising interest rates any time soon, at least not until the economy has returned to full employment, which is judged to be some way off.
(It should be noted that full employment may mean a lower number than previously estimated, given that two million potential workers have withdrawn from the labour market since the lockdowns. They may however wish to return to employment should the opportunities to do so present themselves; this is one of the uncertainties the Fed is trying to deal with as it looks to understand the post-Covid world.)
A number of Fed officials however have brought forward the time when they think the Fed will first raise its key interest rates, to the first quarter of 2023, a revision that surprised the market and moved long-term interest rates higher. The bond market nonetheless remains of the view that inflation in the US over the next 10 years will remain no higher than the 2% average rate targeted by the Fed. The Fed will be alert to the prospect that more inflation than this will arise.
A tale of two central banks
The contrast of the actions of the Fed with those of the South African Reserve Bank (SARB) is striking. The SARB balance sheet contracted by R115bn, 10.8%, between March 2020 and May 2021. Since January 2020, the sum of notes issued plus deposits of the banks with the SARB (the money base) has declined by 6%, the supply of bank deposits (M3) has grown by a paltry 4% and bank credit by 2%. These are shocking figures for an economy struggling to escape a deep recession.
The SARB may be of the view that money and credit are less important for the economy, and that changes in interest rates are the only instrument they have to influence the economy.
Monetary comparisons between SA and the US (March 2020 = 100)
Source: SA Reserve Bank, Federal Reserve Bank of St Louis and Investec Wealth & Investment, 15/06/2021
The SARB seems to believe their lower interest rate settings have been accommodative and helpful to the economy. Higher interest rates would, of course, have been unhelpful and lower rates were certainly called for. However, the money and credit numbers indicate deeply depressing influences on the economy, influences that the SARB could and should have done much more to relieve, following the US example. There is more to monetary policy and its influence on the economy than movements in interest rates.
GDP in the US and SA (March 2000 = 100)
Source: SA Reserve Bank, Federal Reserve Bank of St Louis and Investec Wealth & Investment, 15/06/2021
It would be easy to despair of the prospects for the SA economy given the current, discouraging trends in the supply of money and credit. However, we can draw hope from the possibility that the US cavalry (with some Chinese assistance) will rescue us, in the form of rising prices for metals and minerals that are very much part of the inflation process currently under way in the US.
Metal prices have always led the SA business cycle, in both directions. They may well lead us out of the current morass, after which the supply of money and credit will then pick up momentum to reinforce the recovery, as they have always done in a pro-cyclical way. The responses to the lockdowns have made it clear how our monetary policy reacts to the real economy. A favourable wind from offshore may lift the money supply and bank credit, without which faster growth is not possible.
The steps taken in the US to counter the destruction of incomes and output caused by the lockdowns of economic activity must be regarded as a resounding success. Real US output is now ahead of pre-covid levels. By the end of 2021 GDP may well have surpassed the GDP that might have been expected absent the lock downs. It took lots of income relief, checks in the post from Uncle Sam, supplemented by generous unemployment benefits and relief for businesses. The extra income means extra deposits, that is money with the US banks, to be spent later or exchanged for other financial assets or real estate or bitcoins or precious metals.
It has also taken lots of extra money, money in the form of deposits held by Banks with the Federal Reserve System have increased by 85%, and deposits at the commercial banks have grown by 26% since March 2020. The source of the extra cash and the deposits at the commercial banks and the Fed, has been additional purchases of government bonds and mortgage-backed securities in the debt markets from the banks and their clients – insurance companies and the like, that are being maintained at the rate of 120 billion dollars a month. The Assets and the Liabilities of the Fed have increased by 36%. It has been money creation on an awe-inspiring scale and it has worked as intended to promote demand for goods and services as excess holdings of money are exchanged for goods and services, that businesses are stimulated to supply and to employ more workers to help do so. The fact that they are struggling to keep up with demand, also struggling to add to payrolls, has meant significant upward pressure on prices. The US CPI was up by 5% in May – a rate of inflation not seen since 2008 and before then only in the nineteen nineties.
Inflation in the US – Annual percentage changes in the CPI (Monthly Data)
Source; Federal Reserve Bank of St.Louis and Investec Wealth and Investment
The outlook for inflation in the US is much less obvious than usual. The Fed has been surprised by the pick-up in the inflation rate as was indicated by its Open Market Committee and Governor Powell’s press conference held yesterday 16th June. But Powell remains confident that the increase in inflation is transitory and the Fed does not intend raising interest rates anytime soon, and not until the economy has returned to full employment which is judged to be some way off. Though full employment may mean fewer workers employed given that two million potential workers have withdrawn from the labour market since the lockdowns. They may however wish to return to employment should the opportunities to do so present themselves and is one of the uncertainties the Fed is trying to cope with post Covid for which there are no precedents as the Fed points out. A number of Fed officials however have brought forward the time when they think the Fed will first raise its key interest rates to Q1 2023, a revision that surprised the market and moved long term interest rates higher. Though the bond market remains of the view that inflation in the US over the next ten years will remain no higher than the 2% p.a. average rate targeted by the Fed. The fed as the market will be highly alert to the prospect that more inflation than this will come to be expected.
The contrast of the actions of the Fed with that of the South African Reserve Bank is striking. The SARB balance sheet contracted between March 2020 and May 2021 by R115b or by 10.8%. The sum of notes issued plus deposits of the banks with the SARB (the money base) has declined by 6% since January 2020 and the supply of bank deposits M3 has grown by a paltry 4% and bank credit by 2% since. Truly shocking figures for an economy struggling to escape a deep recession of the government’s making. The Reserve Bank must be of the view that money and credit do not matter for the economy, that changes in interest rates are the only instrument they have with which to influence the economy and that they have declined far enough. These are serious errors of judgment that have punished the economy unnecessarily severely.
South Africa and the USA Monetary Comparisons; March 2020=100
Source; Reserve Bank of South Africa, Federal Reserve Bank of St Louis and Investec Wealth and Investment
The Reserve Bank likes to believe their lower interest rate settings have been accommodative, that is helpful to the economy. Higher interest rates would have been very unhelpful and lower rates were called for. The money and credit numbers indicate only deeply depressing influences on the economy that the SARB could and should have done much more to relieve, following the US example. There is more to monetary policy and its influence on the economy than movements in interest rates.
GDP in the USA and South Africa. March 2000=100. Quarterly Data
Source; Reserve Bank of South Africa, Federal Reserve Bank of St Louis and Investec Wealth and Investment
It would be easy to despair of the prospects for the SA economy given the current trends in the supply of money and credit that are highly discouraging. But for the possibility that the US cavalry with some Chinese assistance may well rescue us in the form of rising prices for metals and minerals that are very much part of the inflation under way in the US. Metal prices have always led the SA business cycle in both directions. They may well lead us out of the current morass- and the supply of money and credit will then pick up momentum to reinforce the recovery- as they have always done in a highly pro-cyclical way. The responses to the lockdowns have made it very clear how our monetary policy leads with not against the winds blowing from the real economy. A favourable wind from offshore may lift the money supply and bank credit without which faster growth is not possible.
The government can call on the central bank to provide money but is not trusted to do the right thing
When or rather if economies return to their pre-shock growth paths, the cost-benefit analysis of the lockdowns is unlikely to bear favourable witness to the responses made to the Covid crisis by SA.
The cost is the difference between GDP on its pre-Covid path (which was on a regrettably moderate incline) and what is likely to be produced and earned before we get back on that path. My own back-of-envelope calculations came to a very large number, equivalent to possibly R1-trillion in money of the day, or equivalent to a quarter of pre-Covid GDP. Certainly, a very large amount of potential income will have been sacrificed. The benefits in the estimate of the value of years of life saved by the lockdowns will be much harder to calculate.
The more precise calculations of costs and benefits dealing with any future pandemic could go as follows. First, estimate the losses of income and output caused by any potential lockdown. These costs in the form of income and output foregone should then be compared with the cost of providing a reserve of medical capacity sufficient to prevent the medical system from being overwhelmed by pandemic demands — which is the case for imposing a lockdown, as we have been reminded.
Hoping to eliminate death is not a realistic option for medical and economic reasons. Minimising the difference between the costs and benefits of any policy should be the objective and is a judgment call. Yet the cost of building and maintaining an adequate medical reserve will be much lower than the sacrifice of income caused by any compulsory lockdown. But this cost will be explicit on any budget that current taxpayers would be liable for. And they and the immediate beneficiaries of alternative government spending clearly attach much present value to lower taxes and other welfare benefits. Future benefits that are uncertain in time and scale are always heavily discounted. But it is a trade-off that is resolved whenever a forward-looking society invests in a reserve to defend itself against any potential invader.
But what happens when war or a pandemic breaks out? The future, after the war, then becomes largely irrelevant compared with the immediate task of winning the war. The task is to spend enough and well enough to immediately increase resistance or medical capacity. Any failure to have built a medical reserve will make it practically difficult to do enough, quickly enough. The crisis, however, becomes too important for money to stand in the way. And where will or can the extra spending money come from?
Raising tax rates will be self-defeating. Less not more tax will be collected. Raising additional government debts may prove very expensive for taxpayers to pay for and repay in the future.
There is another way. A government under great pressure to spend more can call on its own central bank to immediately provide the money to spend. The central bank can create as much money for its government as it chooses to do. It provides extra cash for the government by buying government debt in the market or providing the government with an overdraft to spend on a large enough scale. This is what the developed world is doing on a very large scale: creating much more money to fund extraordinary increases in spending to fight the crisis. The policies are expected to be reversed when or should inflation rear its ugly head.
They have done what SA has been unwilling, not unable, to do. For want perhaps of a full understanding of opportunity costs, we have not spent enough. But more so because our government is not trusted to do right for our society and economy: in the short run spend more and in the long run spend less. Tragically so.
An SA economic revival will depend on lower real long-term interest rates. Only a credible commitment to restraining government spending over the longer run can therefore relieve SA of the burden of expensive debt.
Central Banks have more to offer a distressed economy than just lower interest rates. Interest rates cannot or will not be allowed to fall much below zero, however central banks can supply their economies with more of their own money, in the form of the deposits they supply to their private banks, if necessary. They can add money by lending more of their cash to their governments, private banks and even businesses. They may choose to buy back assets from banks or buy the debt or even the equity of private businesses.
Central bankers will hope that the banks will lend out more of the extra cash they will be receiving automatically from the central bank. If the banks and their borrowers respond favourably to these monetary injections, the supply of private bank deposits and of bank credit will increase by some multiple of the additional central bank money. The extra money (deposits) supplied will then not be hoarded by the public but exchanged for goods and services and for other assets. Higher share prices, more valuable long-dated debt and real estate will translate into more private wealth, leading to less saved and more spent (asset price deflation has the opposite, depressing impact on an economy).
An economy that delivers less income and output than it is capable of, is distressed. Lockdowns have disrupted output and sacrificed the incomes of businesses, households and governments in a serious way. Getting back to an economically normal state requires a mixture of increasing freedom and willingness to supply goods, services and labour. It also needs more spending to encourage firms to produce more and hire more people.
Money creation on a large and urgent scale is helping to stimulate demand almost everywhere. M2 in the US has grown by nearly 25% over the past 12 months. It has led to a more helpful response from US banks than occurred after the Global Financial Crisis (GFC), as the monetary statistics in figure 1 show.
Figure 1: Money supply growth in the US (M2)
Source: Federal Reserve Bank of St.Louis and Investec Wealth & Investment
The SA Reserve Bank has adopted a very different strategy and rhetoric. It has decided that it has done all it can for the economy by cutting its repo rate associated lending rates by three percentage points, to 3.5%. It has rejected any quantitative easing (QE) that might have reduced pressure on interest rates at the long end of the yield curve. It argues that a structural inability to supply (over which it has limited influence), is the cause of our economic distress, not the state of demand, which it could influence if it chose to do so – with still lower repo rates and money creation. It is an argument that can be challenged.
Yet perhaps all is not lost on the SA monetary front. The deposit liabilities of the banks (M3) had grown by about 11% by August, compared to a year before, while the money base is up by 12.5%. This is a welcome acceleration, as figure 2 shows. Less helpfully, bank lending to the private sector was up by only 3.9%.
Figure 2: Growth in monetary aggregates
Source: SA Reserve Bank and Investec Wealth & Investment
It is possible to reconcile the faster growth in the deposit liabilities of the banks with the slower growth in the credit they have provided. The difference between the growth in bank deposit liabilities (up 11%) and assets (up by about 4%) is accounted for by a large increase in the free cash reserves of the banks. The negative difference between cash and repos narrowed by about a net R60bn in 2020. The banks have been provisioning against loan defaults on a large scale. These provisions reduce their reported earnings and therefore dividends, but it increases their cash and free reserves – represented as an increase in equity reserves. As figures 3 and 4 below show, the equity reserves and their provisions rise during times of stress, as they are doing now and did during the GFC, which led to a sharp recession in SA.
Figure 3: SA banks’ free reserves – cash less repurchase agreements with the Reserve Bank and others
Source: SA Reserve Bank and Investec Wealth & Investment
Figure 4: SA banks’ capital and reserves (R millions)
Source: SA Reserve Bank and Investec Wealth & Investment
The banks however have an attractive alternative to providing credit for the private sector. They borrow short (raise deposits) and can lend to the government at higher rates without risks of default. The currently very steep slope of the yield curve adds to this attraction as well as to the profitability of borrowing short and lending long. If long rates are the average of expected shorter term rates over the same period, the currently steep slope of the yield curve implies that short rates are expected to increase dramatically over the next five years. A one-year RSA bill is now offering 3.2%. A three-year bond currently offers 5.06% and a five-year bond 6.72% (all annual rates). The one-year rate would have to rise to more than 8.3% in three years’ time and to 11.3% in five years, to justify the current slope of the yield curve. Unless inflation or real growth surprise significantly on the upside, these higher short rates, as implied by the yield curve, make such outcomes unlikely. Borrowing short to lend long to the SA government looks like a good profitable strategy for SA banks, for now. Similarly, for the government, it favours a strategy of issuing short-term debt and then rolling it over, rather than raising long-term debt at much higher rates.
Figure 5: The spread between RSA 10-year bond yields and money market rates
Source: Bloomberg, Iress and Investec Wealth & Investment
Figure 6: The RSA yield curve and the implicit one-year forward rates
Source: Thompson-Reuters and Investec Wealth & Investment
The banks have been holding significantly more government paper over recent years in response to presumably weak demand for credit from private borrowers and the availability of relatively attractive interest rates on low-risk government paper. Government debt as a share of all bank assets is now 13%, a share that has doubled since 2010. The banks invested a further (and significant) R110bn in additional government debt between January and June 2020.
Figure 7: Bank lending to the government
Source: SA Reserve Bank and Investec Wealth & Investment
Figure 8: Composition of bank lending to the SA government
Source: SA Reserve Bank and Investec Wealth & Investment
Such extra investment in government bills and bonds by the banks is helpful to the government, given the ballooning deficit it has to fund one way or another. The growing deficits are the result more of a collapse in revenue than a surge in spending as the chart below shows. But for the banks to prefer government over private debt would effectively crowd out the lending to the private sector that could contribute to economic growth.
Figure 9: National government expenditure and revenue (monthly, seasonally adjusted and smoothed)
Source: SA Reserve Bank and Investec Wealth & Investment
Figure 10: Annual growth in government revenue and expenditure (smoothd)
Source: SA Reserve Bank and Investec Wealth & Investment
Viewing all these forces at work leads to one important conclusion: any revival of the SA economy will depend on lower real long-term interest rates and less expensive debt for the government and taxpayers. It will also mean lower real required returns for any business. These required returns are currently extremely high, given high nominal bond yields, low inflation and the additional equity risk premium. The returns required to justify an investment in the SA economy are thus of the order of a prohibitive 10% or more after inflation. The Reserve Bank can help in the short run by managing long rates lower. However only a credible commitment to restraining government spending over the longer run can lead SA out of the burden of expensive debt.
Central Banks have more to offer a distressed economy than lower interest rates. They can supply their economy with much more of their money in the form of the deposits they supply to their private banks. They can add as much money to the economy as they deem necessary, by lending more to their governments, private banks and businesses.
If the banks and their borrowers respond favourably to these monetary injections, the supply of private bank deposits and of bank credit will increase by some multiple of any additional central bank money. The extra money and credit created will then be exchanged for goods and services, the labour to help produce them and exchanged for other assets. Higher share prices, more valuable long dated debt, and real estate, translates into more private wealth, leading to less income saved and more spent. Helping to relieve distress.
Lockdowns have disrupted output and sacrificed the incomes of businesses and the households and governments on a large scale. Getting back to an economic normal requires a mixture of increasing freedom and willingness to supply goods services and labour. It also needs more spending to encourage firms to wish to produce more and hire more workers and managers. Money creation on a very large and urgent scale is helping to stimulate demand almost everywhere. M2 (that is bank deposits) in the US have grown by nearly 25% over the past twelve months. QE is working very rapidly this time round.
The SA Reserve Bank has adopted a very different strategy and rhetoric. It has decided that it has done all it can for the economy by cutting its repo rate by 3 percentage points to 3.5%. It has rejected any QE that might have reduced pressure on interest rates at the long end of the yield curve. It argues that a structural inability to supply over which it has limited influence, is the cause of our economic distress, not the weak state of demand. Go figure as they would say in New York
Yet perhaps all is not lost on the SA monetary front. The deposit liabilities of the banks (M3) had grown by about 11% by August and the supply of Reserve Bank money is up by 12.5% p.a. in September compared to the year before. This represents a marked acceleration. Much less helpfully bank lending to the private sector was up by only 3.9% p.a. in August. The difference between the growth in bank deposit liabilities, up 11% and assets up by about 4%, is accounted for by a large increase in the free cash reserves of the banks, of about a net R60b in 2020. That is the cash on their books less all their repurchase agreements with the Reserve Bank and others have become less negative.
The banks have been provisioning against loan defaults on a large scale. These provisions reduce their reported earnings and therefore dividends. It therefore increases their cash and free reserves that are reflected as an increase in equity reserves. A process that is reversed should the bad debts materialize.
The banks invested a further and significant R110b in additional government debt between January and June 2020. Very helpful to a very hard pressed fiscus, but also crowding out lending to the private sector. The currently very steep slope of the yield curve adds to the attraction of borrowing short to lend long to the government. It also implies that short rates are expected to increase very dramatically over the next five years. Unless inflation or real growth picks up very surprisingly, the very much higher short rates implied by the yield curve seem unlikely. Borrowing short to lend long seems like a very good and profitable strategy for SA banks and others. Borrowing short and rolling over short term debt rather than borrowing long, at much higher rates seems like a good idea for the RSA.
This all leads to an undeniable conclusion. Any revival of the SA economy will depend on realizing lower real long-term interest rates and flattening the yield curve. It will bring lower real required returns for any business that might invest more in the SA economy, essential if the economy is to pick up any sustainable momentum. Only a credible commitment to restraining government spending over the longer run can lead SA out of the stultifying burden of very expensive capital.
What permanent shape will the global economy take after the lock downs are fully relieved? How fast can the global economy grow when something like normality resumes? There are those who argue that the major economies have entered an extended period of economic stagnation. Some even argue that demand will have difficulty in keeping up with minimal extra supplies of goods services and labour. That monetary policy has shot its bolt because interest rates cannot go much below zero.
We should dismiss such underconsumption theories. Monetary stimulus comes not only from lower interest rates but also occurs directly as excess supplies of money are converted into demands for other goods or services and for other assets. Higher asset prices and greater wealth also have positive effects on spending. There is no technical limit to the amount of money central banks can create to stimulate more spending. The only limit is their own judgment as to how much extra is necessary to the purpose of getting an economy up and running again.
Stagnation will be for a want of willingness to supply goods services and labour. If demand remains weak we should expect ever more injections of central bank cash until demand increases enough to make inflation rather than growth the problem for central banks. This is unlikely any time soon and global interest rates will remain low until then. Such policies can be reversed when the time is right to do so.
These low interest rates encourage a flow of capital to those parts of the world where real interest rates are much higher. As in South Africa where the market still rules the determination of long-term interest rates given the clear unwillingness of the SA Reserve Bank to monetize government debt on any significant scale. The SA government has to offer nearly 10% for ten-year money. Adjusted for expected inflation of around 5% this provides a very attractive expected real return of around 5% per annum over the next ten years.
The average private firm contemplating investing in plant and equipment in SA would have to add a risk premium of another five per cent to establish the returns required to justify such an investment. These expected returns would therefore have to be of the order of an expected 10% p.a. after inflation. A requirement that is prohibitively high and explains in large measure the lack of capital expenditure in SA. And reinforces the prospect of a permanently stagnant economy. It also explains the depressed value of SA facing companies on the JSE regarded as without good prospects for growth. For faster growth in capex, interest rates have to come down or, less happily, inflation must go up to reduce required returns on capex.
Improving our growth prospects requires a steely economic realism in response to current very difficult circumstances. It necessitates more central bank intervention to lower long-term interest rates and much more reliance on short term borrowing that will be much less expensive for taxpayers. It calls for still lower interest rates at the short end. It calls for money creation and debt management of the kind practiced almost everywhere else as a temporary, post lock-down stimulus to more spending and growth- but alas not here.
The blow out in the borrowing requirement of the government –because revenue has collapsed with incomes – is a best regarded as unavoidable. Realism means no increases in tax rates on expenditure or incomes. Doing so would further slow-down the economy and revenue collections with it. Higher expenditure taxes and charges would also raise headline inflation, depress spending on other goods and services and raise demands from public sector unions for better pay. These now pressing demands for improved employment benefits for comparatively well paid and protected public sector employees must be strongly resisted. This will help demonstrate that the SA government can spend within its capacity to raise revenue over the longer term. The debt trap is avoidable.
It calls for policy responses that would best serve the economy now in crisis and act as a bridge to permanently sound policies of a market friendly nature. So providing a signal of improving prospects that would justify significant inflows of capital to lower interest rates and required returns. That in turn would lead to much higher levels of capital expenditure necessary for permanently faster growth.
How much income will be sacrificed for the lock downs will depend upon how quickly production (supply) and spending (demand) can be resumed. As always supply and demand will depend on each other and respond together. The more an economy is stimulated by way of government spending on relief and by monetary policy – lower interest rates and more money and credit supplied – the more demand will be exercised and be expected from the customers of businesses. And the greater will be their willingness to tool up and hire workers and managers to satisfy demands.
So much is almost common cause globally. Learning about how well the recovery is going and when the foot can best be taken off the accelerator will be necessary. But surely not until it becomes very clear that an economy is back to normal. That is producing as much output and income as it is capable of- without inflation. When and if inflation comes back, stimulus should and can be reversed.
And the steeper the path back to normal the less the lockdown will have cost in real terms- in income sacrificed. And the cheaper the government can borrow to fund its growing deficits, the less will the future interest bill on much increased issues of government debt.
Hence massive reliance has been placed on central banks in the developed world to print more money. Cash created by central banks in the form of the note issue and bank deposits with the central bank is government debt that does not ordinarily bear interest. Hence extra money issued by central banks has been used on a vast scale to buy government and corporate debt in the market-place in order to hold down all interest rates and to fund government spending directly. Now called politely quantitative easing – but money creation by another name. And to supply their banks with additional cash reserves so that they might provide additional credit on favourable terms to the private and government sectors.
Extra central bank purchases of government debt in the developed have even exceeded this year the vastly increased issues of government debt by the major economies. Hence we observe low even negative interest rates across the entire term structure of interest rates. Making issuing debt for some governments even cheaper than money. The future tax-payer in the developed world has not been made not hostage to a spending and borrowing surge of unprecedented proportions, outside of war time.
The self-same approach is called for in SA and for any economy with its own currency and central bank and for the same very good reasons. And with the same recognition that stimulus can be reversed when the time is right. Unfortunately, the SA Reserve Bank does not agree. It has consistently argued against the case for buying government bonds on an aggressive scale to hold down interest rates. Most recently it has suggested that QE is not only undesirable but impractical, until interest rates are at zero and deflation beckons.
The argument made is that bond purchases (or for that matter increases in Foreign Assets held by the Reserve Bank or declines in their government deposits liabilities) adds to the supply of cash in the system and would have to be fully sterilized by equivalent sales of securities by the Reserve Bank.
However there is never any compulsion to sterilize all such purchases nor any logic in doing so. The object of any bond buying would be to add to the money base by some well-designed amount to encourage the private banks to lend more. The banks might prefer to hold more cash supplied to them in reserve and if so would not have to borrow from the Reserve Bank making the repo rate possibly irrelevant. But this might call for still more cash to be injected and for interest rates to go to zero -helpfully in the circumstances of depressed demand.
Ideally the extra cash supplied to the banks would better be used to fund additional lending to the private and public sectors to encourage spending. The much fuller adoption of the loan guarantee scheme (potentially R200bn of extra bank lending) would reduce any potential demand from our banks for excess cash reserves. The scheme should provide the extra capital and as important the confidence to reboot the SA economy. It urgently needs a champion in the Reserve Bank.
Should the economy recover enough to threaten inflation targets the Governor could be providing good reasons why the monetary taps can be tightened as easily as they were loosened. Given his hard-won inflation fighting credentials these could be used to save the economy from avoidable distress – without prejudicing long term stability.
It seems that investors in emerging markets hold their governments and central banks to a much higher fiscal and monetary standard than is expected of their increasingly indebted developed market peers.
What is deemed to be right for the increasingly indebted developed world hoping to recover from the coronavirus – that is massive doses of extra government spending and money creation in support of government debt – is treated with suspicion when proposed or attempted by increasingly indebted emerging market economies, including SA.
We have argued that economies such as our own, which have suffered even more damage from the lockdowns, thanks to more widespread poverty and in the absence of capital reserves accumulated by households and businesses, need all the unconventional help they can get.
Not all emerging market central banks have taken the chastity vow. In Indonesia, as the Financial Times (FT) reported on 15 June: “Finance Minister, Sri Mulyani Indrawati, says quantitative easing and other policies are restoring confidence. Indonesia is at the forefront of emerging markets in implementing monetary policy that was once seen as the preserve of developed economies.”
The minister said that “Indonesia will use unprecedented quantitative easing and other emergency monetary and fiscal policies for as long as it takes to recover from the coronavirus pandemic, according to the country’s finance minister. With the private sector in retreat after weeks of lockdown, massive state spending was needed to shore up the economy”, adding that Indonesia would not rely on central bank financing in the long run: “That is not good policy practice.”
Brazil, according to the FT in another report (8 June) has granted its central bank extraordinary powers for the next 12 months, even though the Bank seems somewhat reluctant to employ them. Central bank President Roberto Campos Neto said he would not employ such measures until traditional tools had been exhausted:
“We still think we have monetary space on the traditional policy. If you start using unconventional policy before you exhaust the conventional policy, you create noise that makes the central bank lose credibility.”
However, according to the FT, the central bank has slashed Brazil’s benchmark Selic interest rate to a historic low of 3% and is expected to cut by a further 75 basis points this month. Campos Neto said there was now greater clarity on the extent of the damage likely to be wrought by the coronavirus pandemic and that “uncertainty regarding the extreme cases has diminished”. The Bank in March launched a US$300bn financial liquidity package — equivalent to 16.7% of the country’s GDP — to mitigate the efforts of the broad economic shutdown caused by the coronavirus pandemic. “I don’t think any other country has done anything close to that,” Campos Neto said.
The case for extraordinary policies is clear enough. When economies are allowed to normalise, hopefully extra demand will match extra potential supplies that then become available. Extra spending to accompany extra output can be assisted by extra government spending – on income relief and relief for lenders and borrowers. Money creation by central banks can make it cheaper to issue more government debt and to encourage banks to lend more freely. In the absence of stimulus, the willingness of firms to increase output and to offer employment on normal terms would be more compromised. They are unlikely to hold optimistic forecasts of revenues and profits upon which to budget. The case for stimulus is thus every bit as strong in the less developed world, including SA.
There is as yet no indication that the SA Reserve Bank sees the crisis as calling for anything like such a vigorous a response. It remains largely in conventional inflation-targeting mode. The supply of central bank money, notes in circulation together with the cash deposits of the banks with the Reserve Bank, defined as the money base or M0, sometimes more evocatively described as high powered money, did not increase at all since the end of last year to May 2020.
Money base to May 2020
Source: SA Reserve Bank Balance Sheets and Data Bank, and Investec Wealth & Investment
This unchanged level of the money base through the crisis occurred despite the purchase by the Reserve Bank of a modest extra R22bn of RSA bonds in the secondary market (modest by comparison with the other assets held by the Bank that are dominated by its foreign exchange reserves). In May 2020, as a result of drawing on its large deposits with the Bank to make payments abroad, the foreign assets of the Bank declined. Despite the limited QE designed to smooth volatility in the debt markets rather than to stimulate, and despite a significant increase in Reserve Bank loans to banks, net-net the money base has not increased during this time of grave crisis. We show the trends in the assets of the Reserve Bank and its liability to the government in the chart below.
Government deposits are not part of the money base held by the public and the banks. An increase in government deposits reduces the money base and a decline will do the opposite, provided the drawdown is used to fund spending or debt repayments in SA. If, as appears to have been the case in May 2020, the payments by the government (drawing down its deposits) went to foreign creditors and so foreign banks, the SA banks will thus not have seen an increase in their cash reserves and deposits with the Reserve Bank. In May, the loans to private banks declined sharply – also reducing the money base. Thus, despite the purchase of an additional R10bn of government stock by the Reserve Bank, the money base in May was practically unchanged and no larger than it was in December.
In the charts below, we show the Reserve Bank balance sheet over the period since December and the monthly changes in some of the key items that move the money base – the notes in circulation plus the deposits of the banks with the Reserve Bank.
The money base in SA and its sources (December 2019 to May 2020)
Source: SA Reserve Bank Balance Sheets and Data Bank, and Investec Wealth & Investment
Reserve Bank balance sheet – monthly movements affecting the money base (December 2019 to May 2020)
Source: SA Reserve Bank Balance Sheets and Data Bank, and Investec Wealth & Investment
SA desperately needs the same extraordinary interventions to counter the impact of the lockdown now underway in the developed world, and as we have indicated, also in some developing economies. Given the responses of the SA Treasury and Reserve Bank to date, it is not surprising that the consensus forecasts of market analysts are for a below average reduction in SA GDP in 2020 of 6%, but thereafter for a well below increase in GDP in 2021, a pedestrian 2%.
What is called for is firstly a properly vigorous response to the crisis. It also calls for a credible commitment to a return to fiscal and monetary normality when the crisis is over, and when the economy is operating at something like its potential. That long-term growth potential surely has to be above 2% annual growth. To realise permanently faster growth, needs more than effective crisis management. It calls for reforms of the economy.
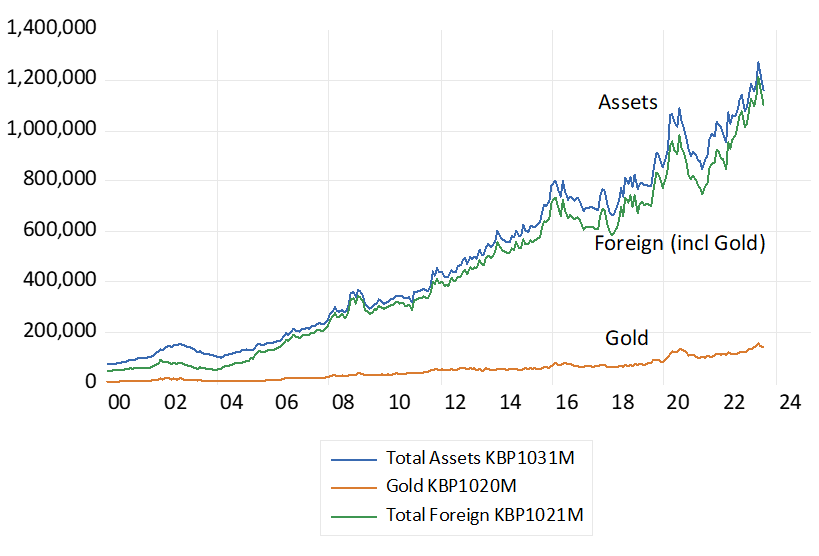
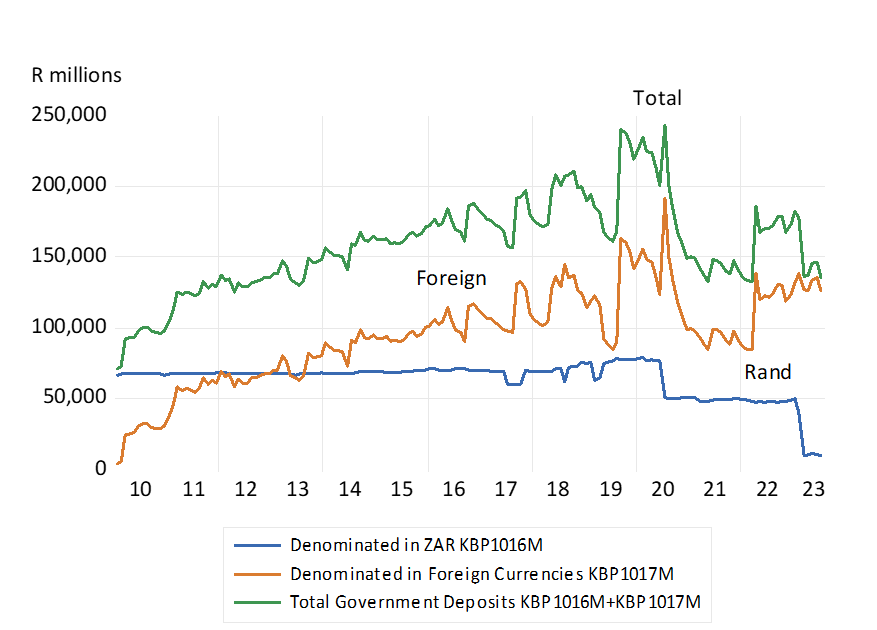
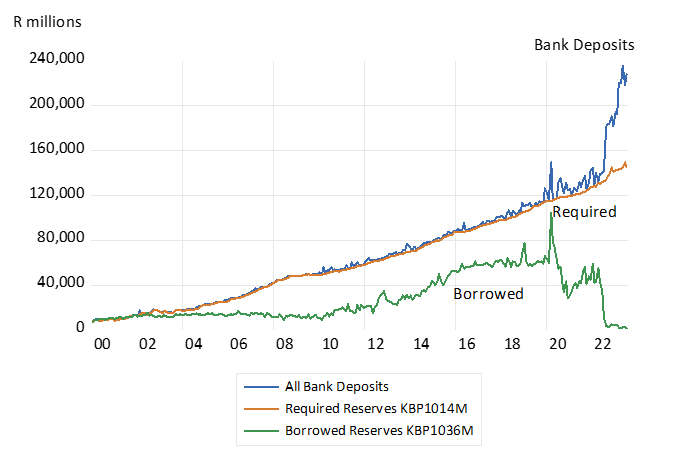
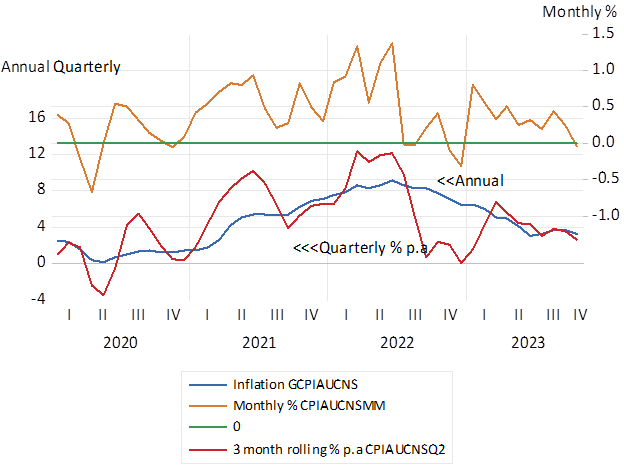
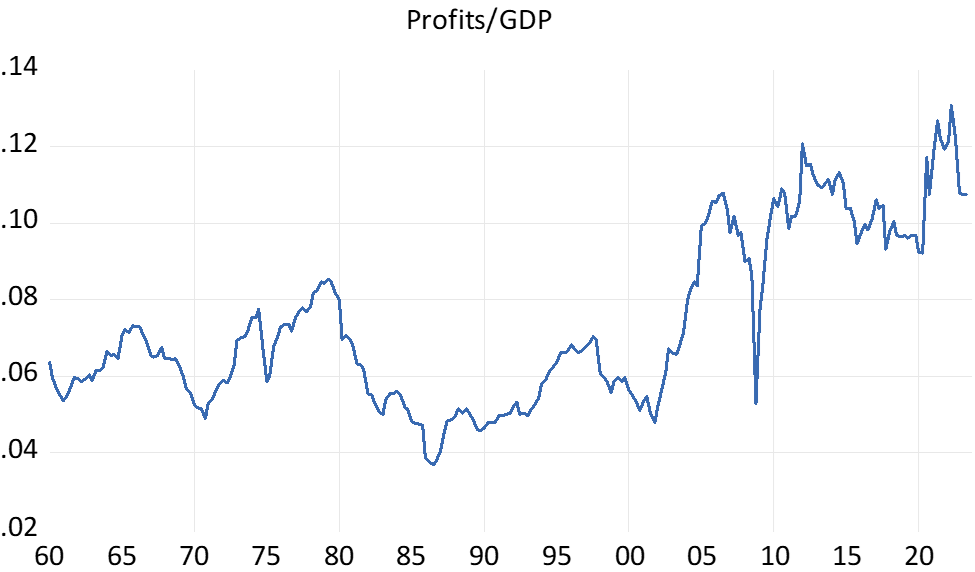
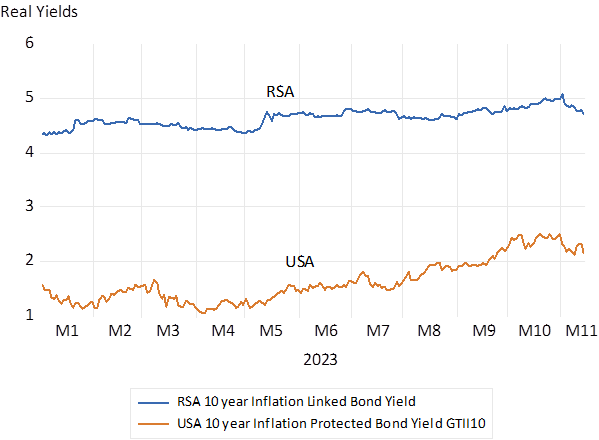
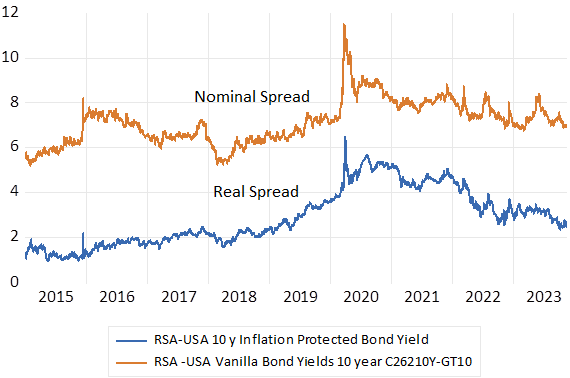

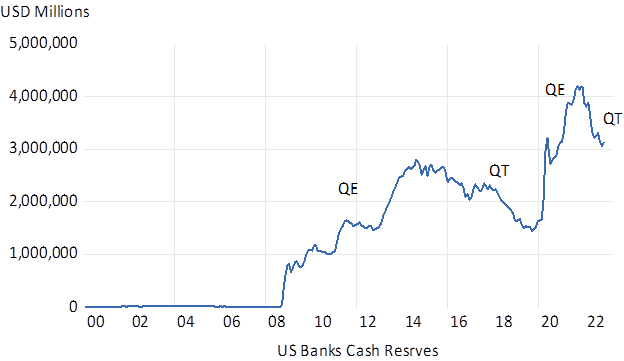
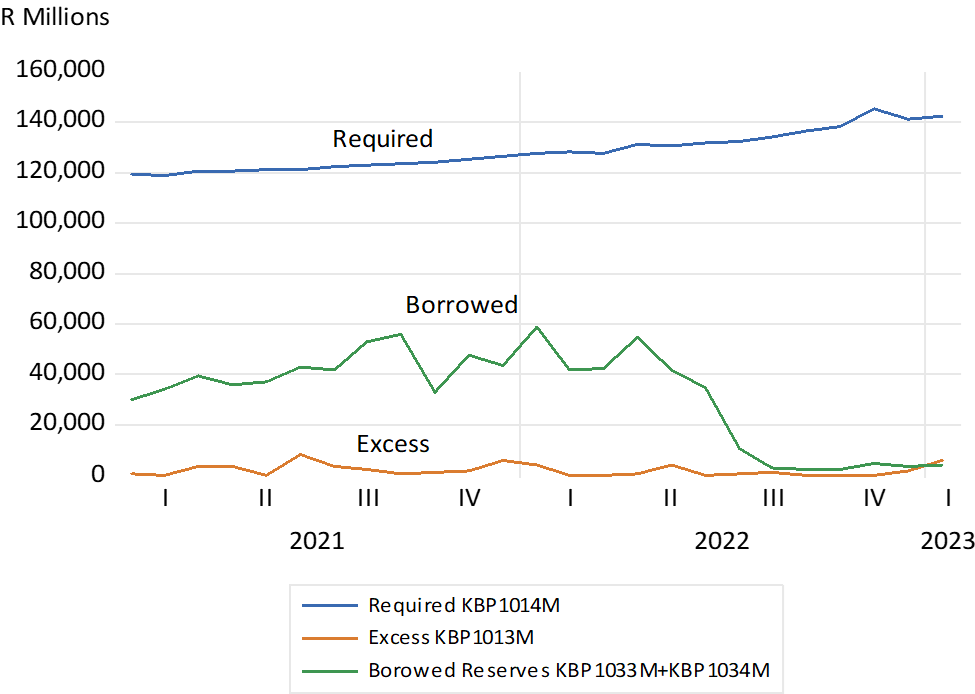
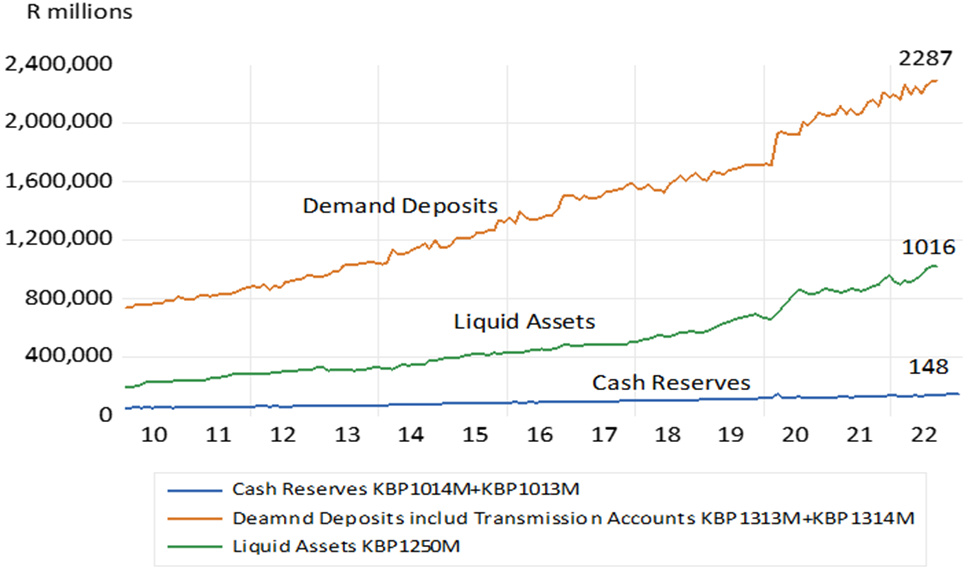
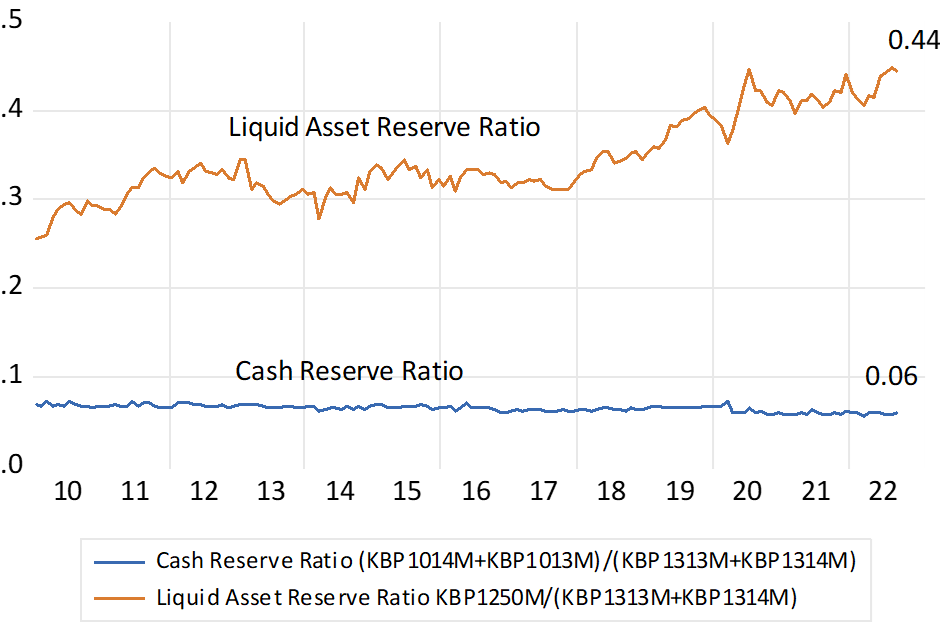
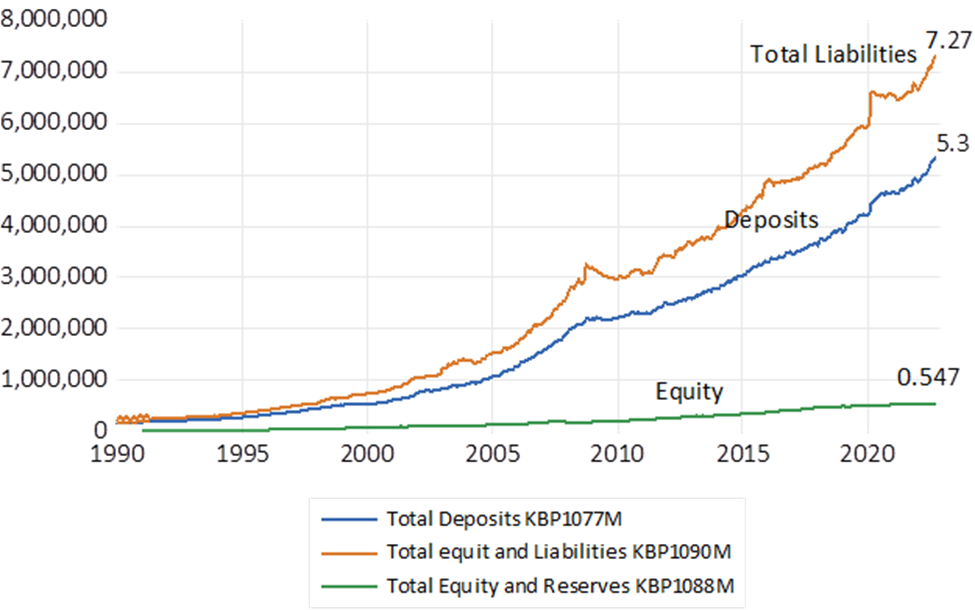
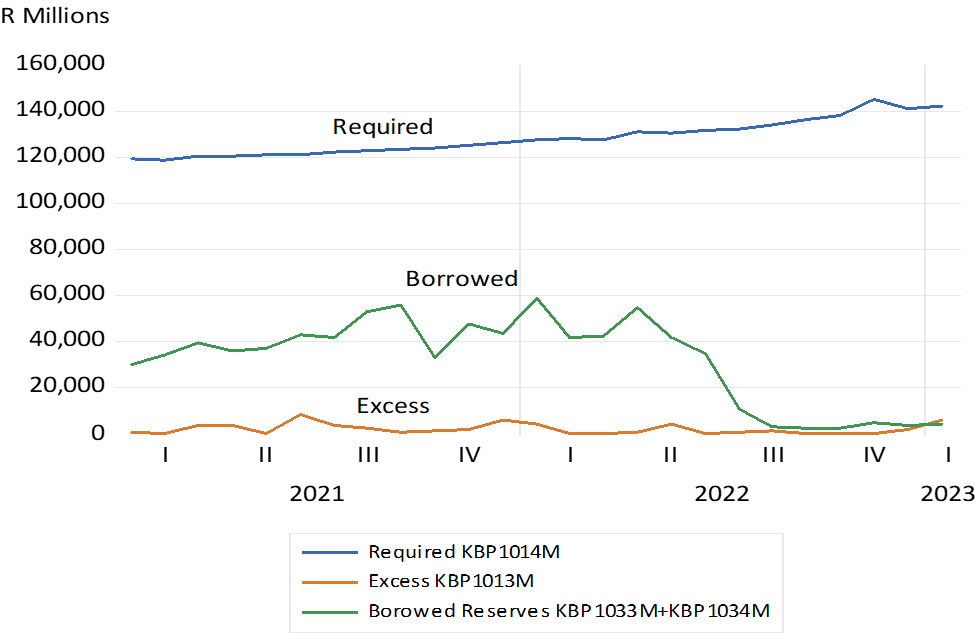
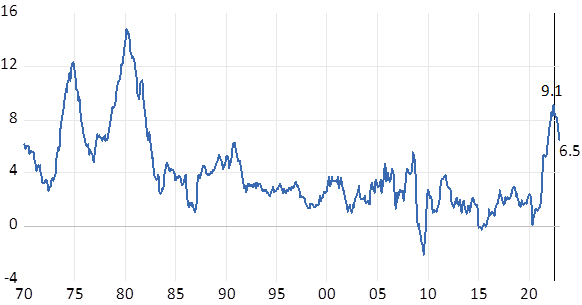
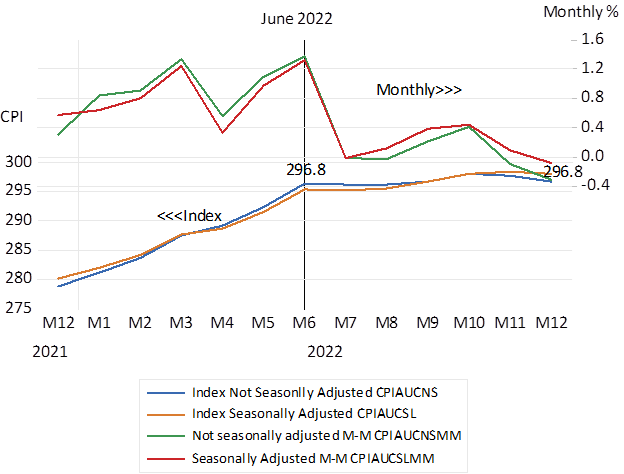
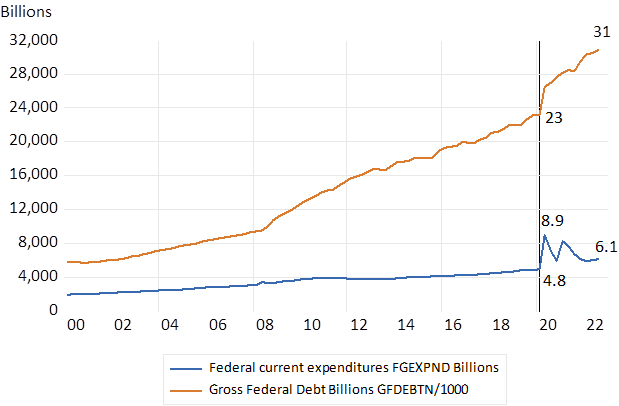
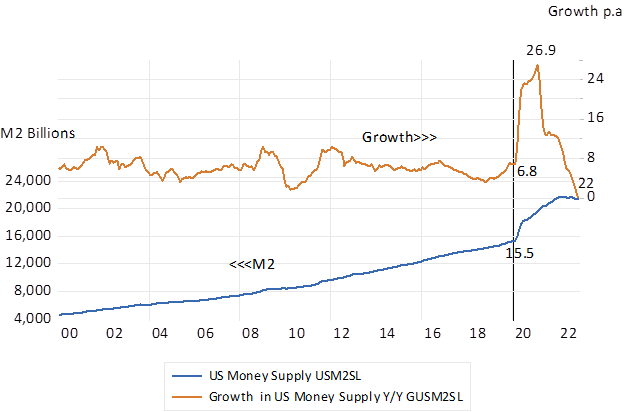
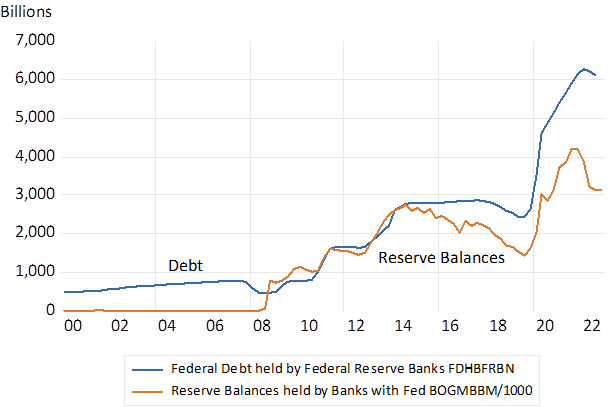
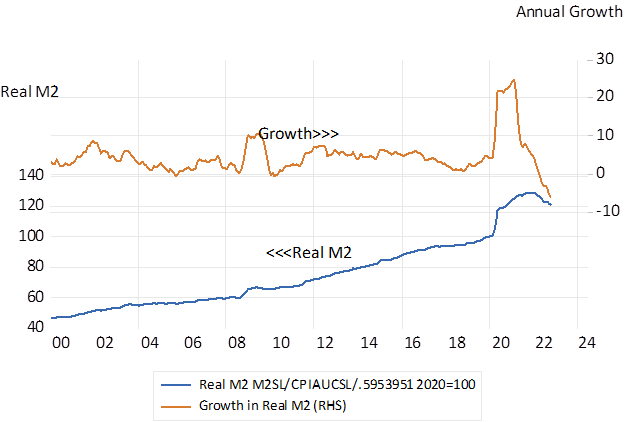
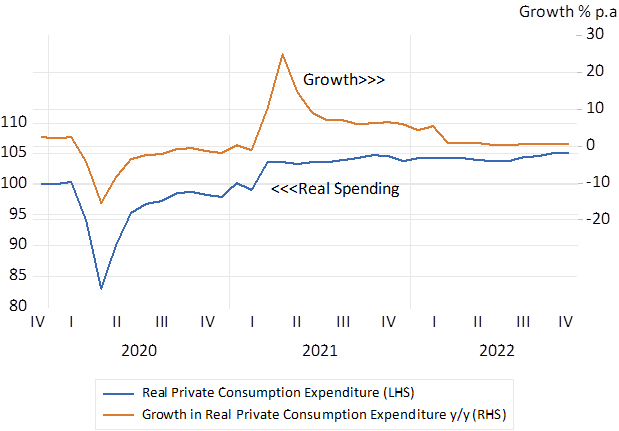
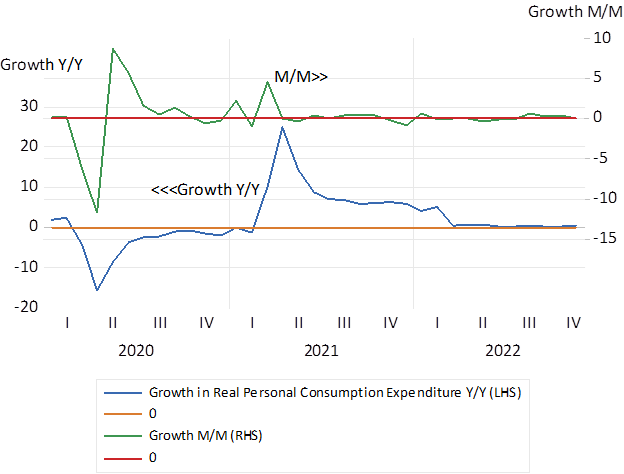
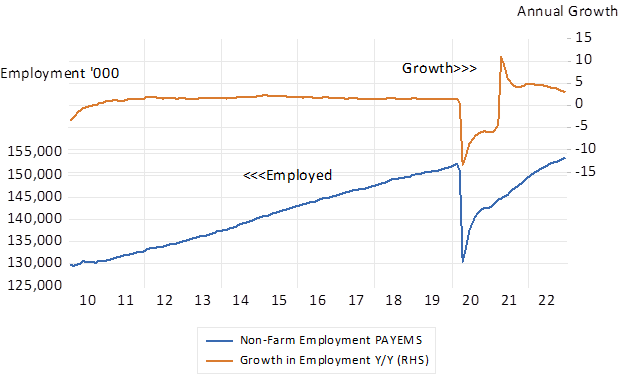
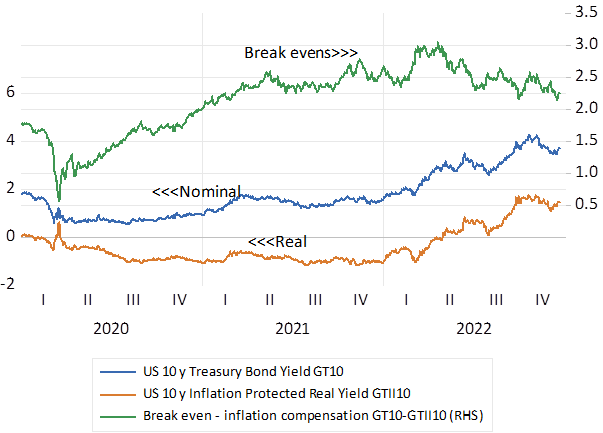
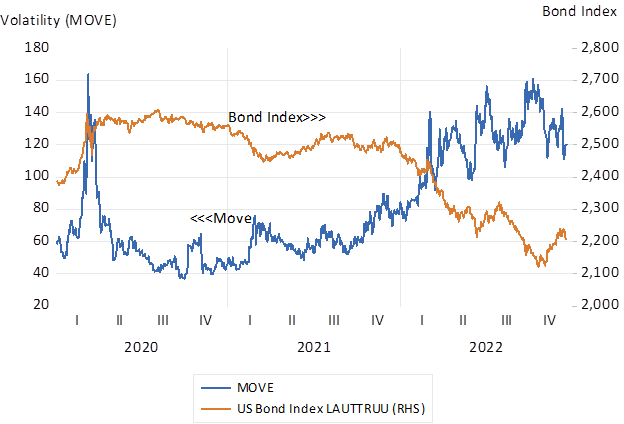
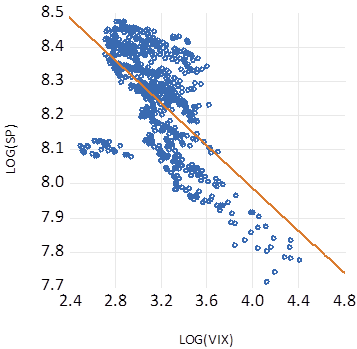
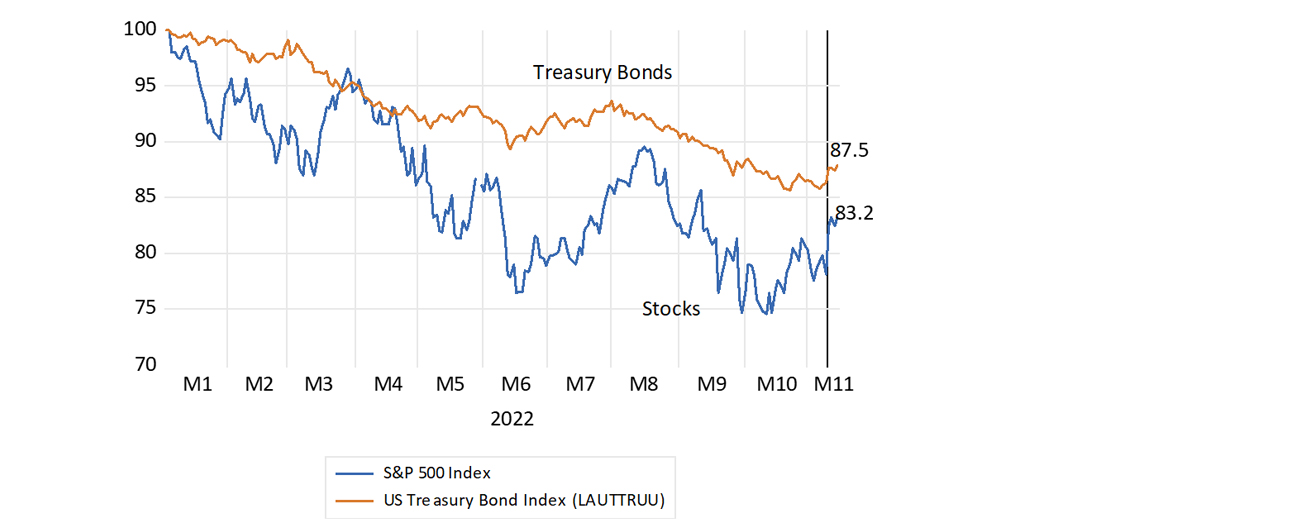
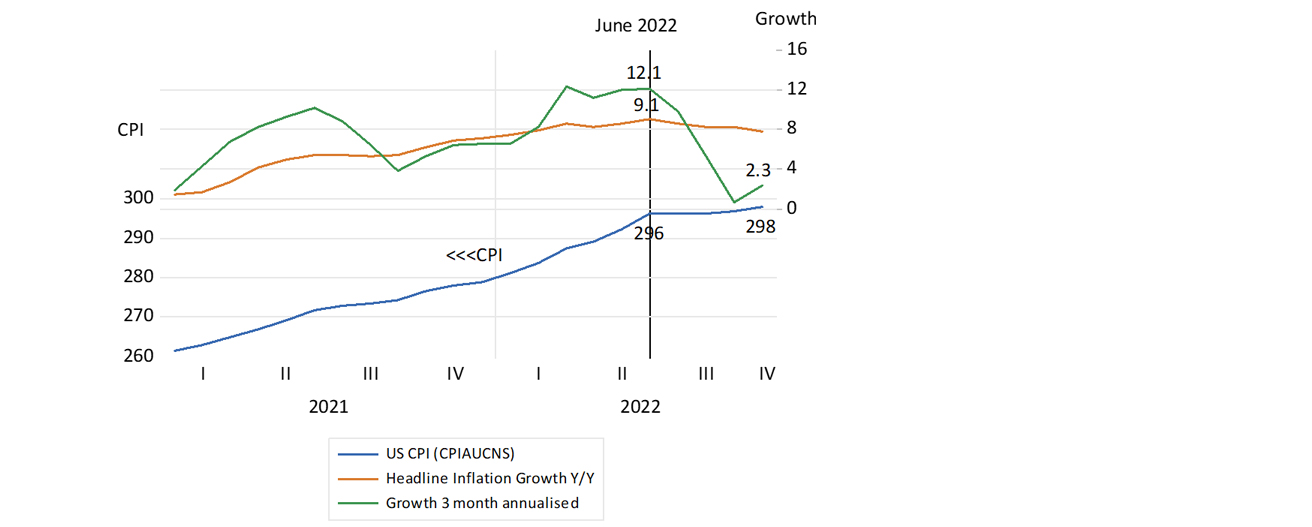
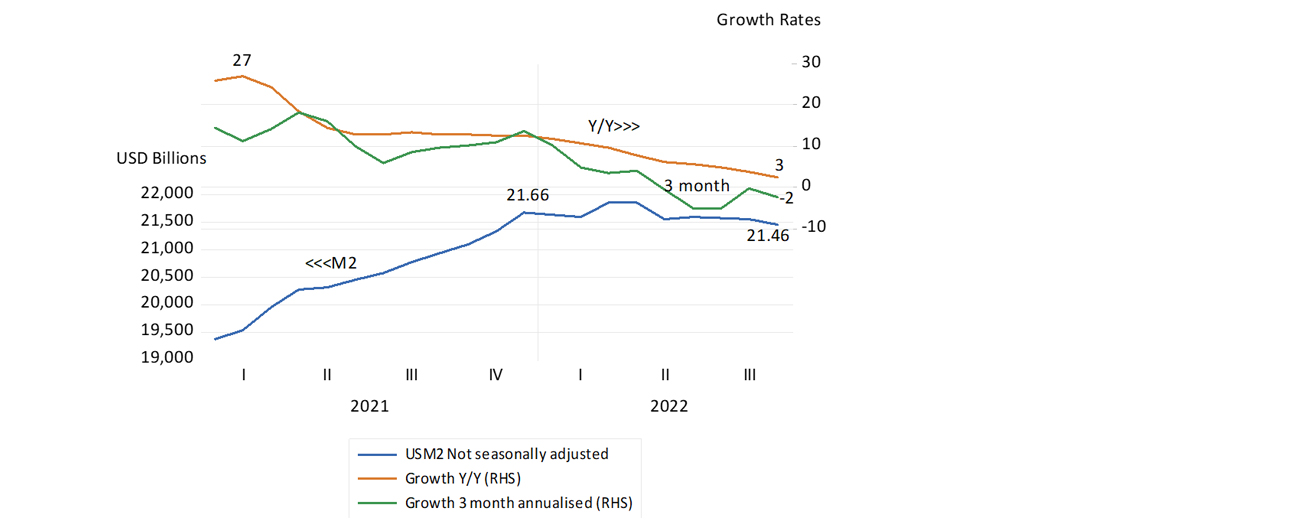
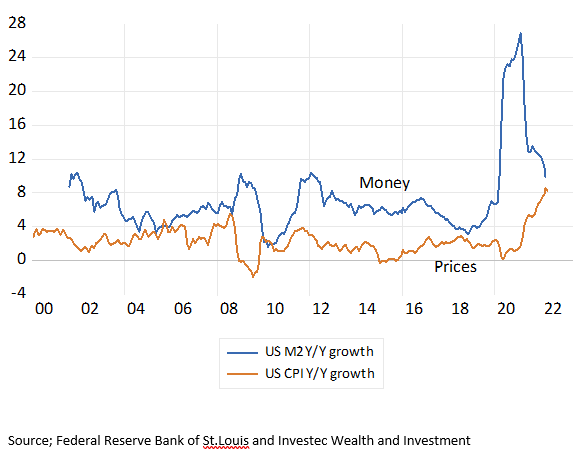
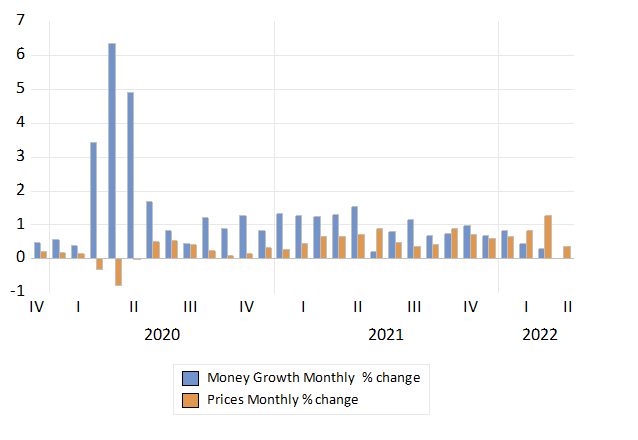
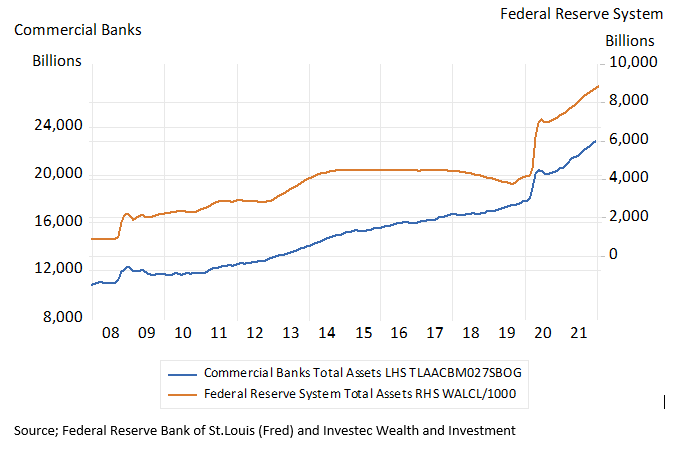
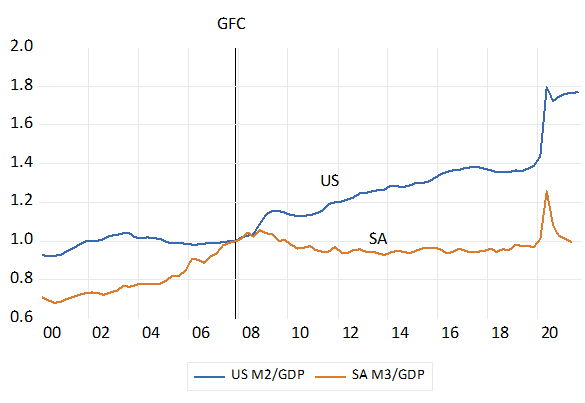
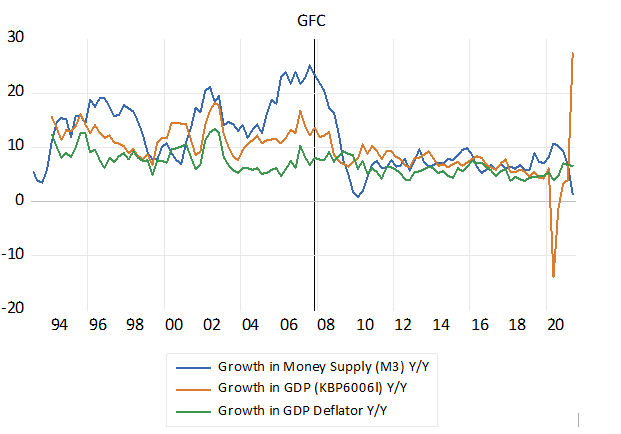
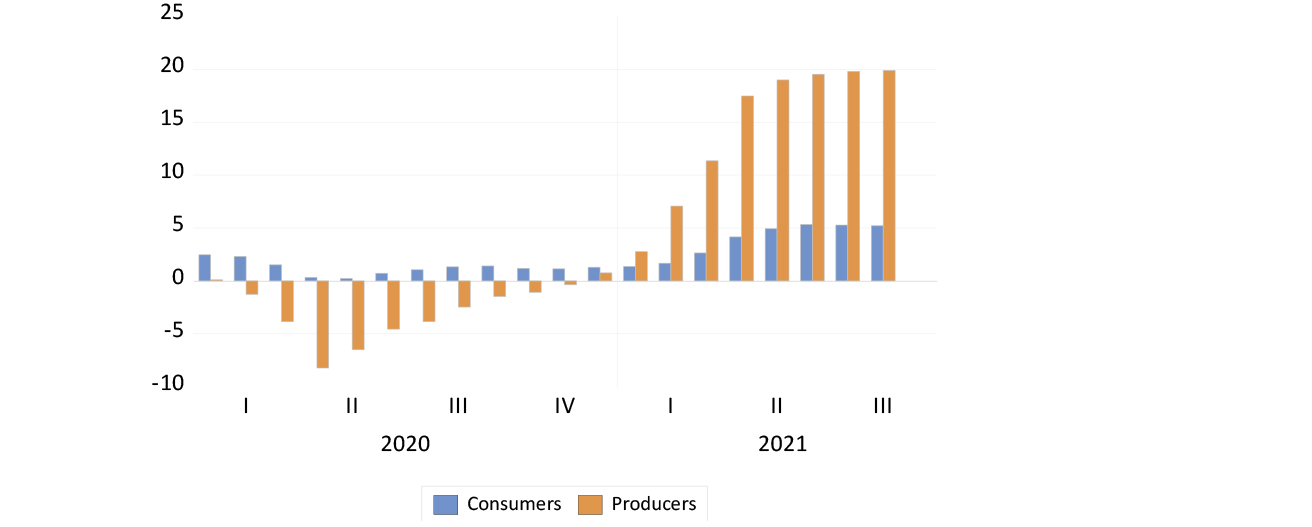
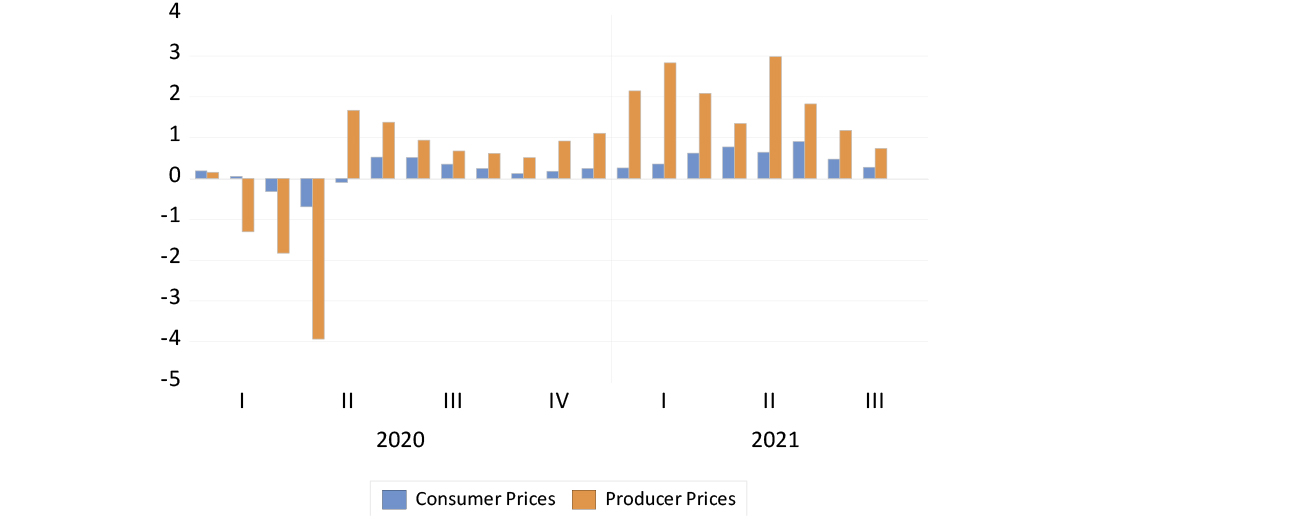
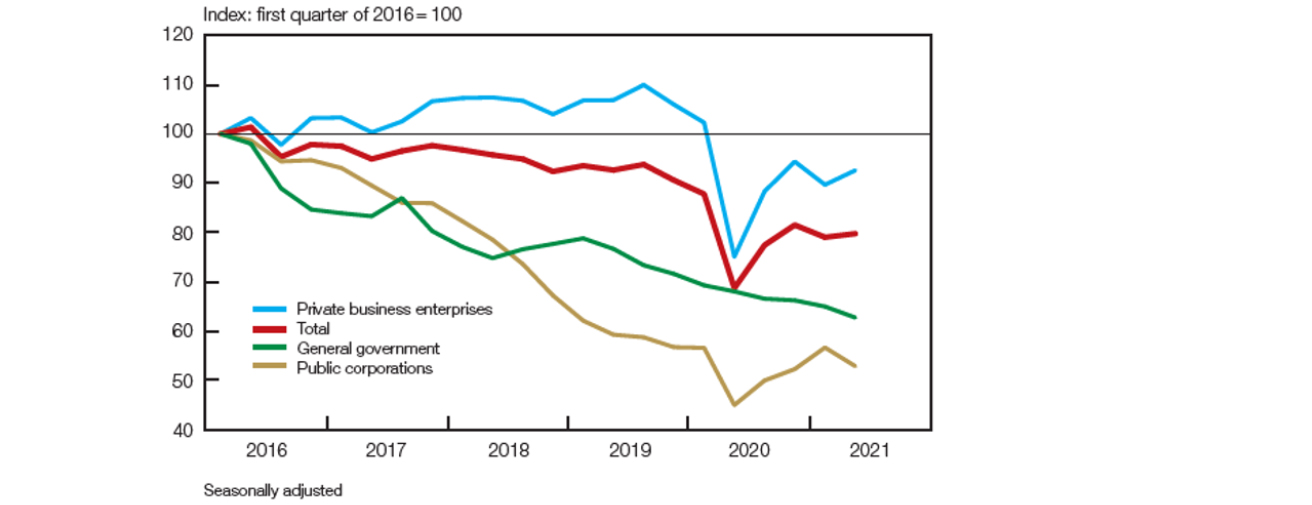
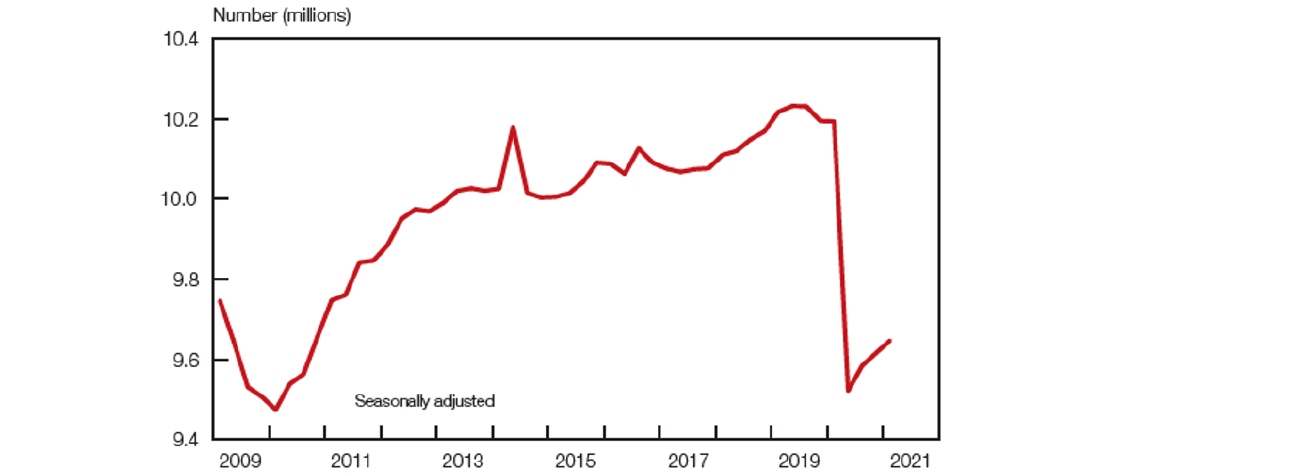
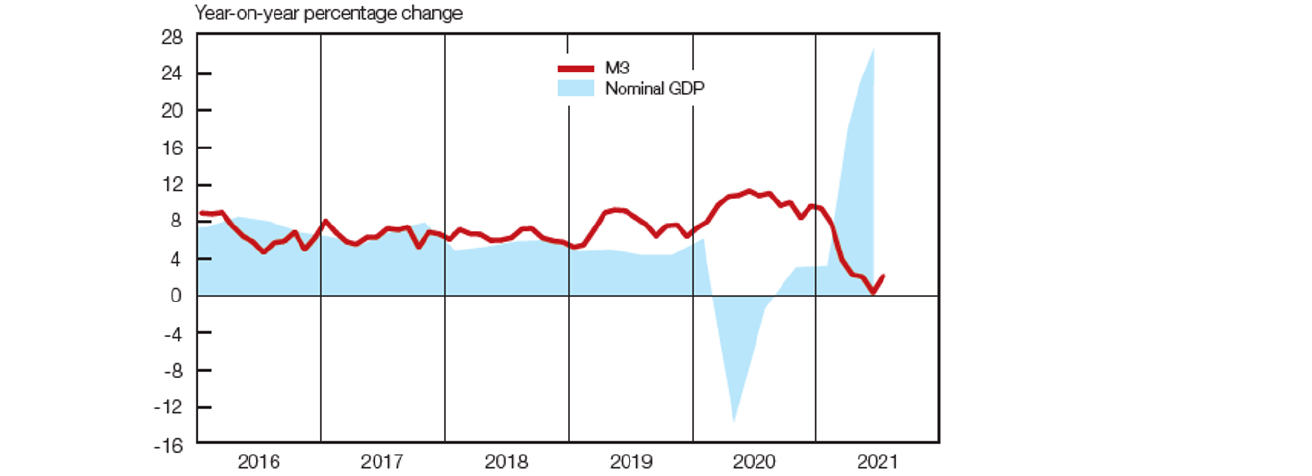
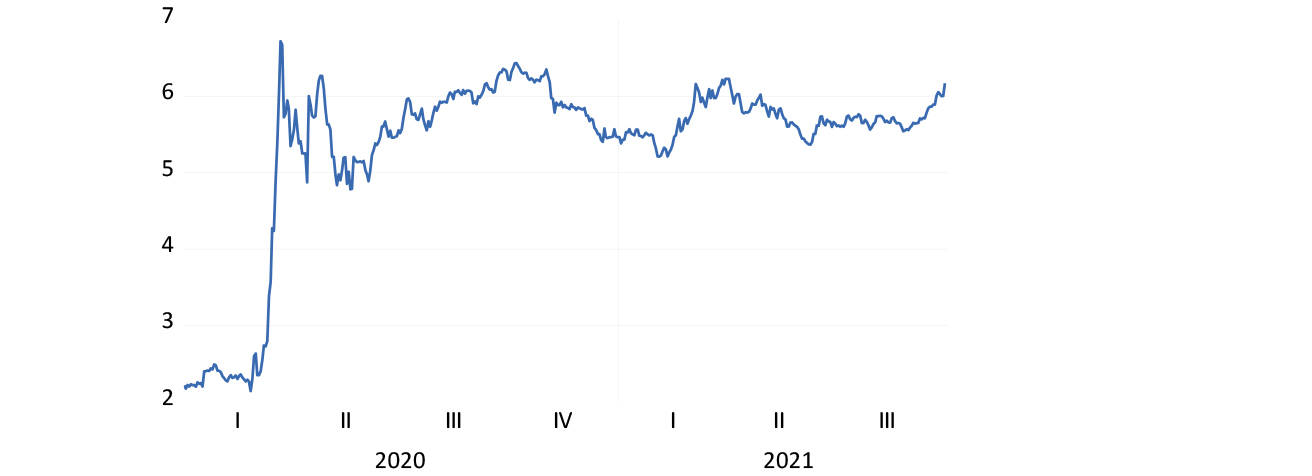
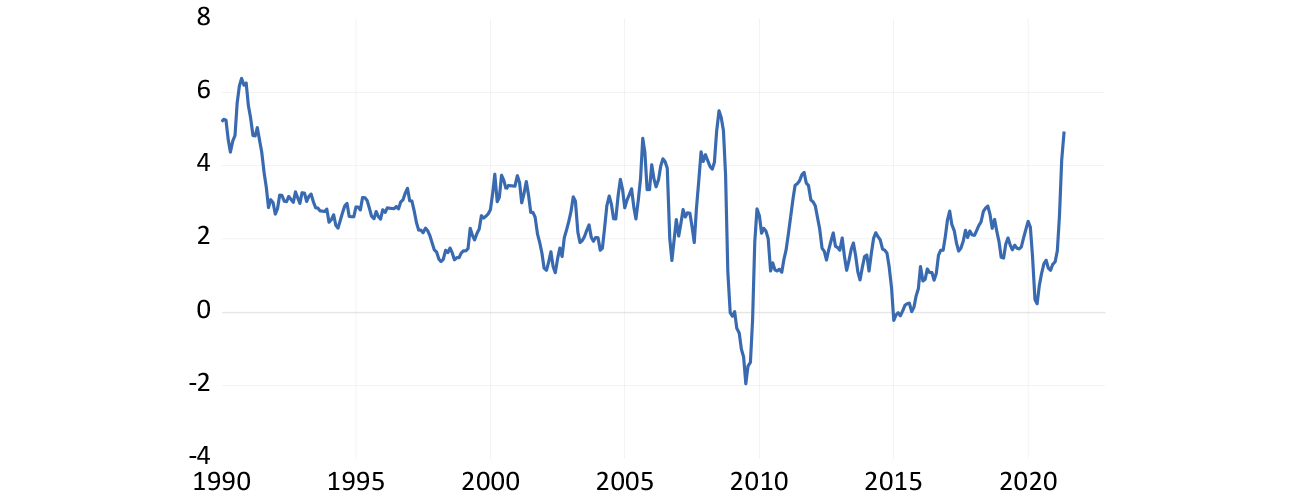
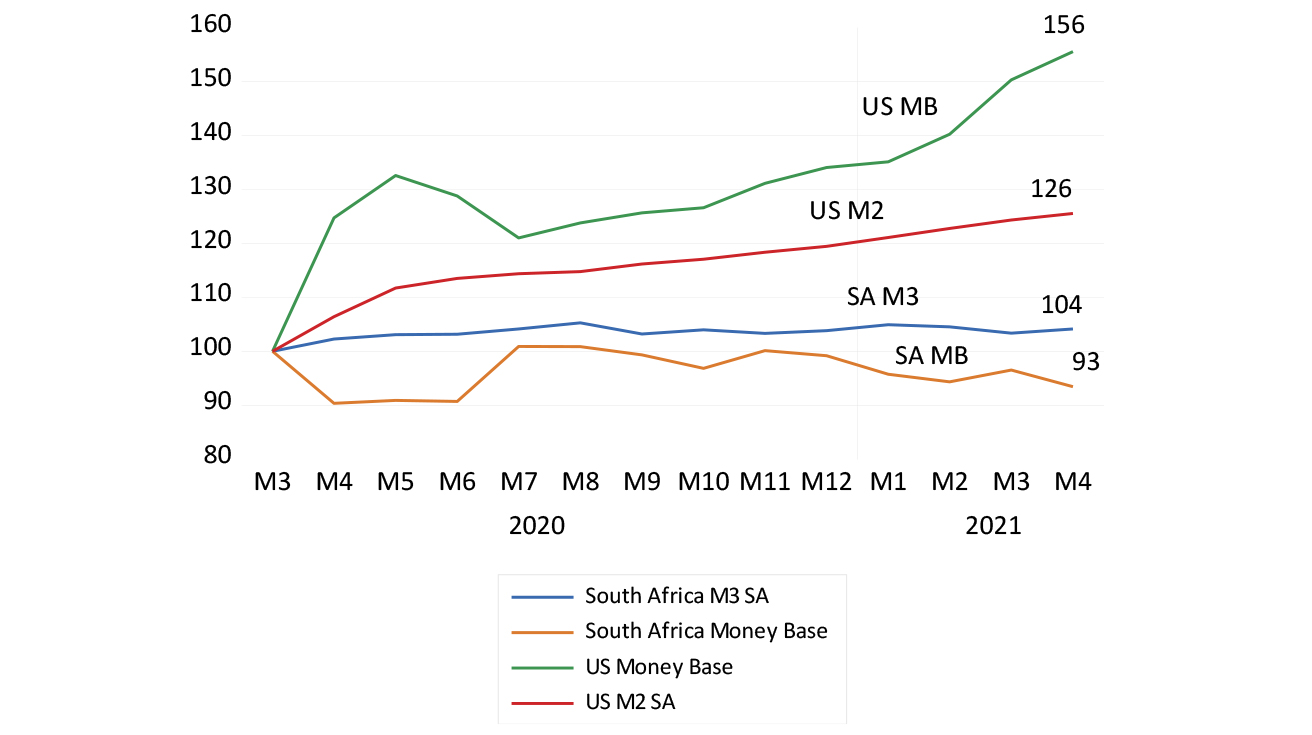
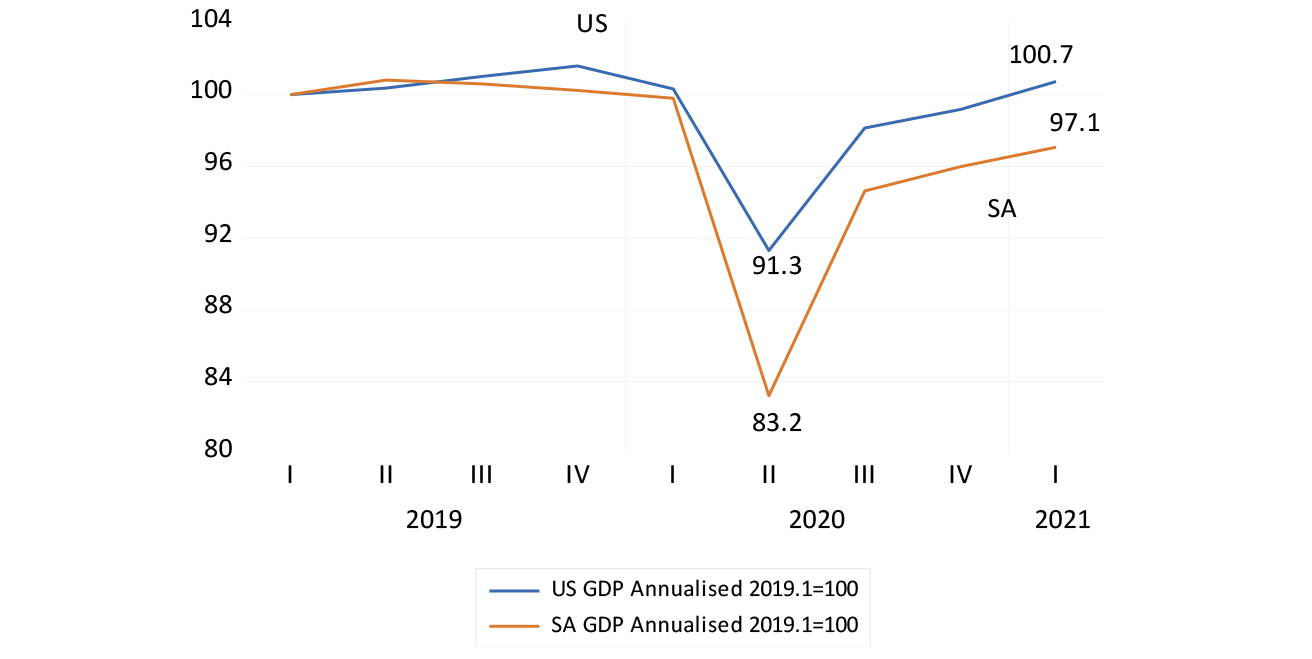
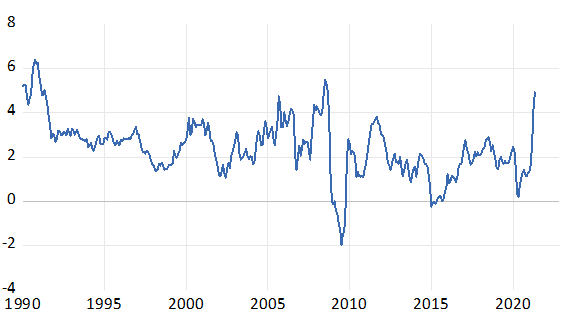
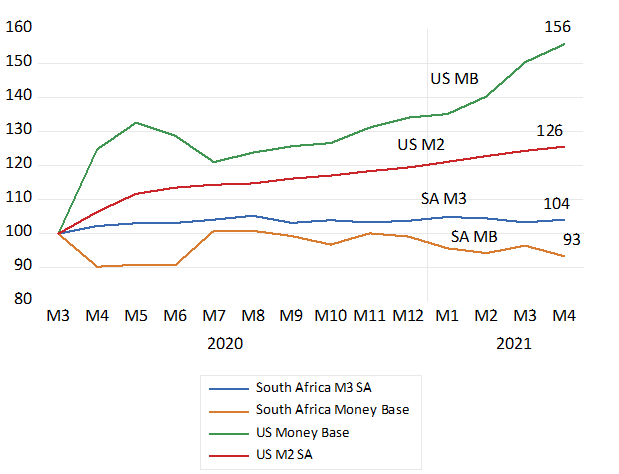
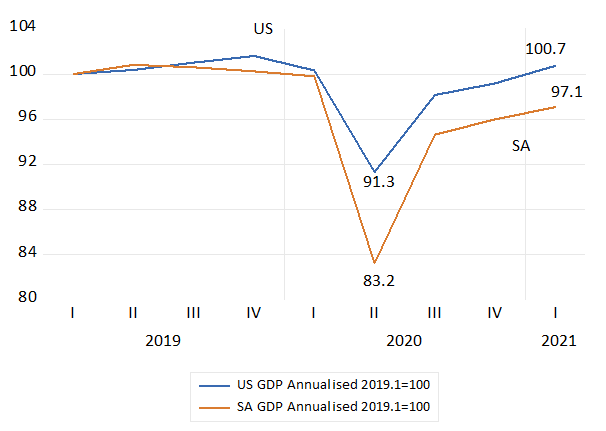
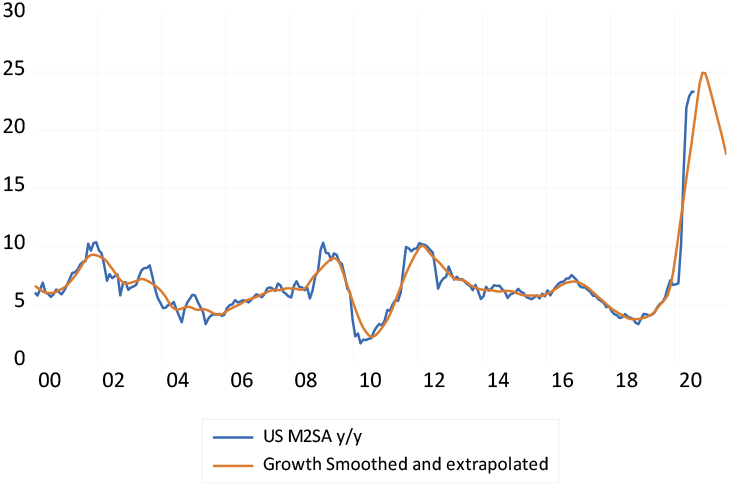
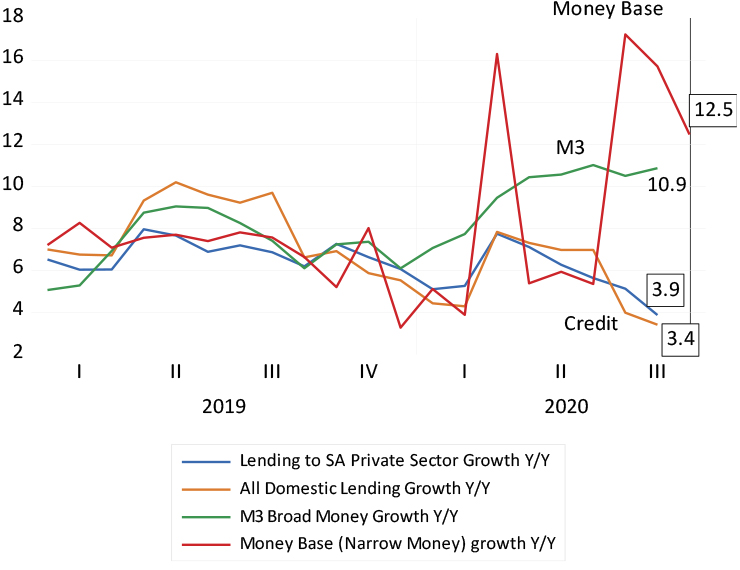
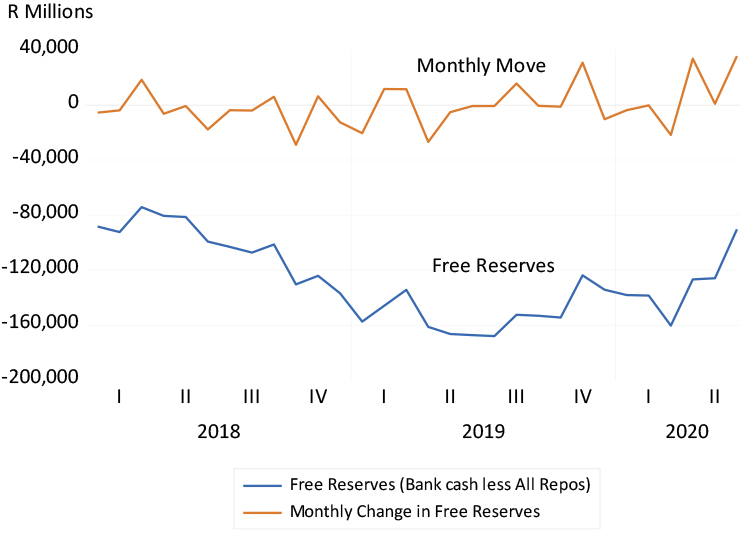
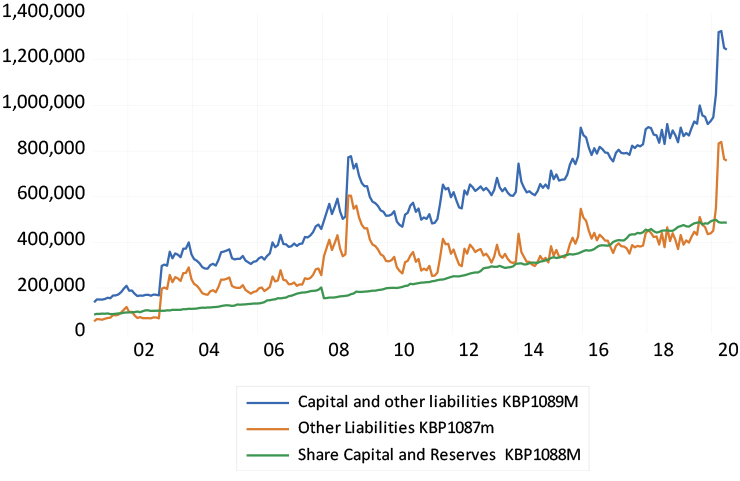
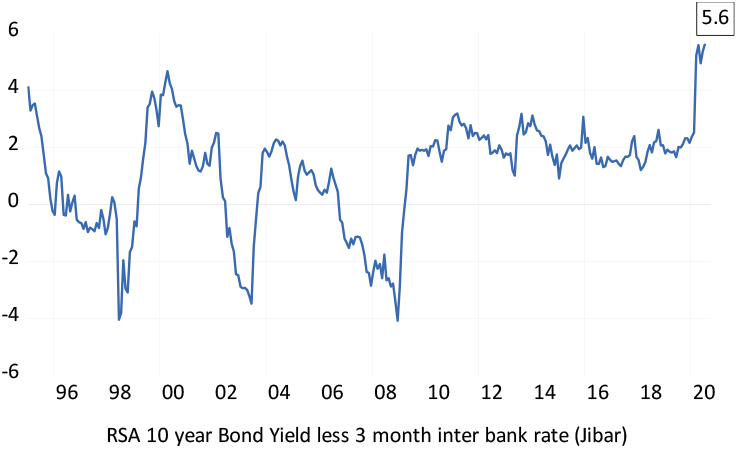
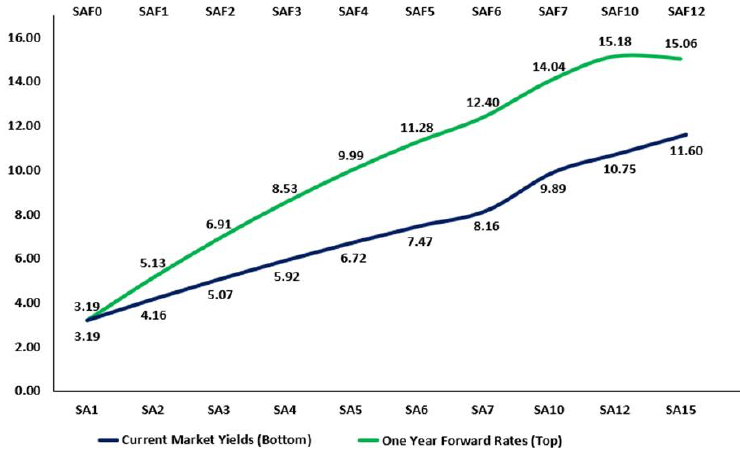
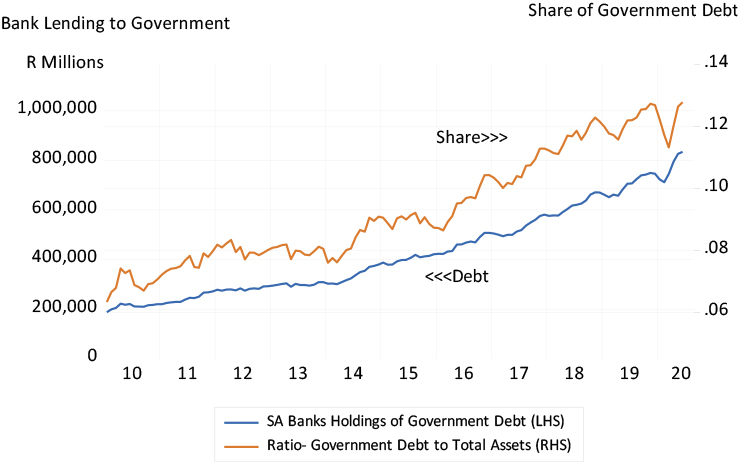
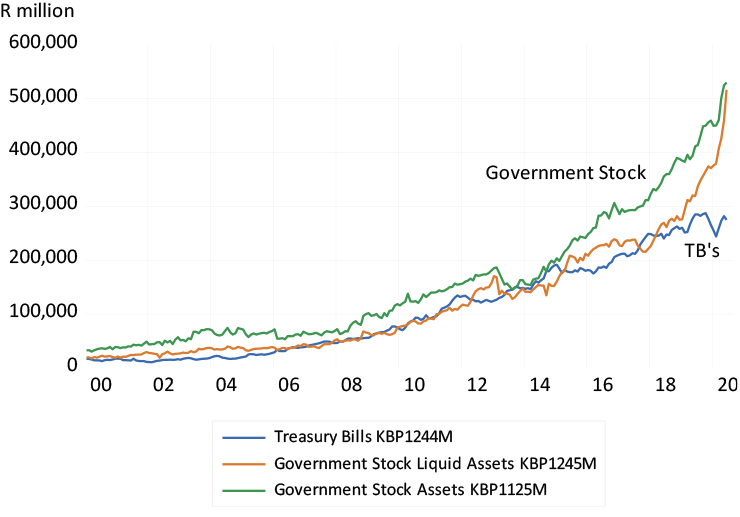 nd Investec Wealth & Investment